

惯性聚合 高效追踪和阅读你感兴趣的博客、新闻、科技资讯
阅读原文 在惯性聚合中打开

推荐订阅源

U
Unit 42
The Cloudflare Blog
OSCHINA 社区最新新闻
OSCHINA 社区最新新闻
Y
Y Combinator Blog
G
Google Developers Blog
Vercel News
Vercel News
让小产品的独立变现更简单 - ezindie.com
Jina AI
Jina AI
Blog — PlanetScale
Blog — PlanetScale
H
Help Net Security
博客园 - 三生石上(FineUI控件)
MongoDB | Blog
MongoDB | Blog
S
SegmentFault 最新的问题
阮一峰的网络日志
阮一峰的网络日志
H
Hackread – Cybersecurity News, Data Breaches, AI and More
aimingoo的专栏
aimingoo的专栏
T
Tailwind CSS Blog
博客园 - 叶小钗
freeCodeCamp Programming Tutorials: Python, JavaScript, Git & More
月光博客
月光博客
Microsoft Security Blog
P
Proofpoint News Feed
The GitHub Blog
The GitHub Blog
云风的 BLOG
云风的 BLOG

World Economic Forum

What happened at the MC14 WTO meeting in Yaoundé How giving gorillas digital wallets can help finance nature Why is leadership a strategic investment for philanthropy? Counting the many costs of the global mental health burden What we learned from the 2026 World Bank Spring Meetings Crop protection is at risk. How innovation can help Here's a playbook for boards on how to govern agentic AI Why connected data makes AI decision-ready for sustainability 3 ways better data practices are reshaping financial supervision What technology convergence looks like in practice 7 reasons the old order broke — and how it might be repaired How governments can make agentic AI re  ? Current and future uses of RNA, including mRNA vaccines Real-time deepfakes are rewriting the rules of child safety Electrification trend ‘unmistakeable’ – and more energy stories From smallpox to the common cold: A brief history of vaccines Saudi Arabia's new AI-powered sustainability platform could unlock $20 billion by 2030 Here are 6 ways that climate change is affecting sports around the world This crisis could be an opportunity for the energy transition Middle East war: 6 ways countries are responding to the historic energy shock Nature can teach us about leadership and building resilience How did the Strait of Hormuz become so important, and will it stay that way? Yes/Cities: Helping global cities become more resilient, sustainable and prosperous Healthy ageing in APAC: The role of the influenza vaccine Risk management, renewables and a rocky road ahead: Spring Meetings takeaways Japan in a world of rising middle powers EU plans to offset Iran war's energy impact, and other climate and nature news 3 cities leading on green investment for economic growth The coffee industry is making the case for climate insurance The ocean is now a subprime asset, so we need a sustainable blue economy
The Rayner plot: What it tells us about the future of jobs
2026-04-15 · via World Economic Forum
  • The Future of Jobs Report explores expected job growth and decline but the outlook feels very different for someone in a role that is stable versus churning, where companies are downsizing and upsizing simultaneously.
  • The Rayner plot is an interactive tool that explores these nuances for all professions in the Future of Jobs Report 2025.

Sometimes the most interesting story in labour market data isn’t the headline number but what sits underneath it. In the Future of Jobs Report, we track how roles are expected to grow or decline over the next five years. But those trajectories can take very different shapes beneath the surface.

Take drafters, engineering technicians and mapping technicians, for example. These roles are expected to grow 16% by 2030, following a trajectory similar to that of general and operations managers at 10%.

However, if we dig deeper, we see among employers hiring for technical drafting roles, 53% expect to increase hiring while 38% expect to reduce it (and just 9% expecting to hold employment levels stable) — making this one of the most dynamic and fast-changing roles in the dataset.

By contrast, 57% of employers expect to keep hiring for general and operations managers steady, making it one of the most stable roles.

Introducing the Rayner plot

This was Mark Rayner’s idea – a lead author on the report; it’s an exceptional depiction of the three possibilities – grow, decline or remain stable.

The X-axis shows the net balance of employer expectations, running from 100% expecting the role to decline to 100% expecting the role to grow. For example, "Car, Van and Motorcycle Drivers" are at the midpoint, with almost the same number of employers expecting growth and decline.

The Y-axis shows job stability. At the bottom, we see jobs that all employers expect will remain stable, while the top shows jobs that no employers expect will remain stable.

Now, let’s take a look at the diagram for all occupations in the Future of Jobs Report 2025. Take your time, there’s a lot going on here – we even threw in two extra dimensions: the size of the dot represents the total number of global workers, while the colour represents the main macrotrend driving change in each occupation.

(Click on the graphic to explore and interact using the filters on the left)
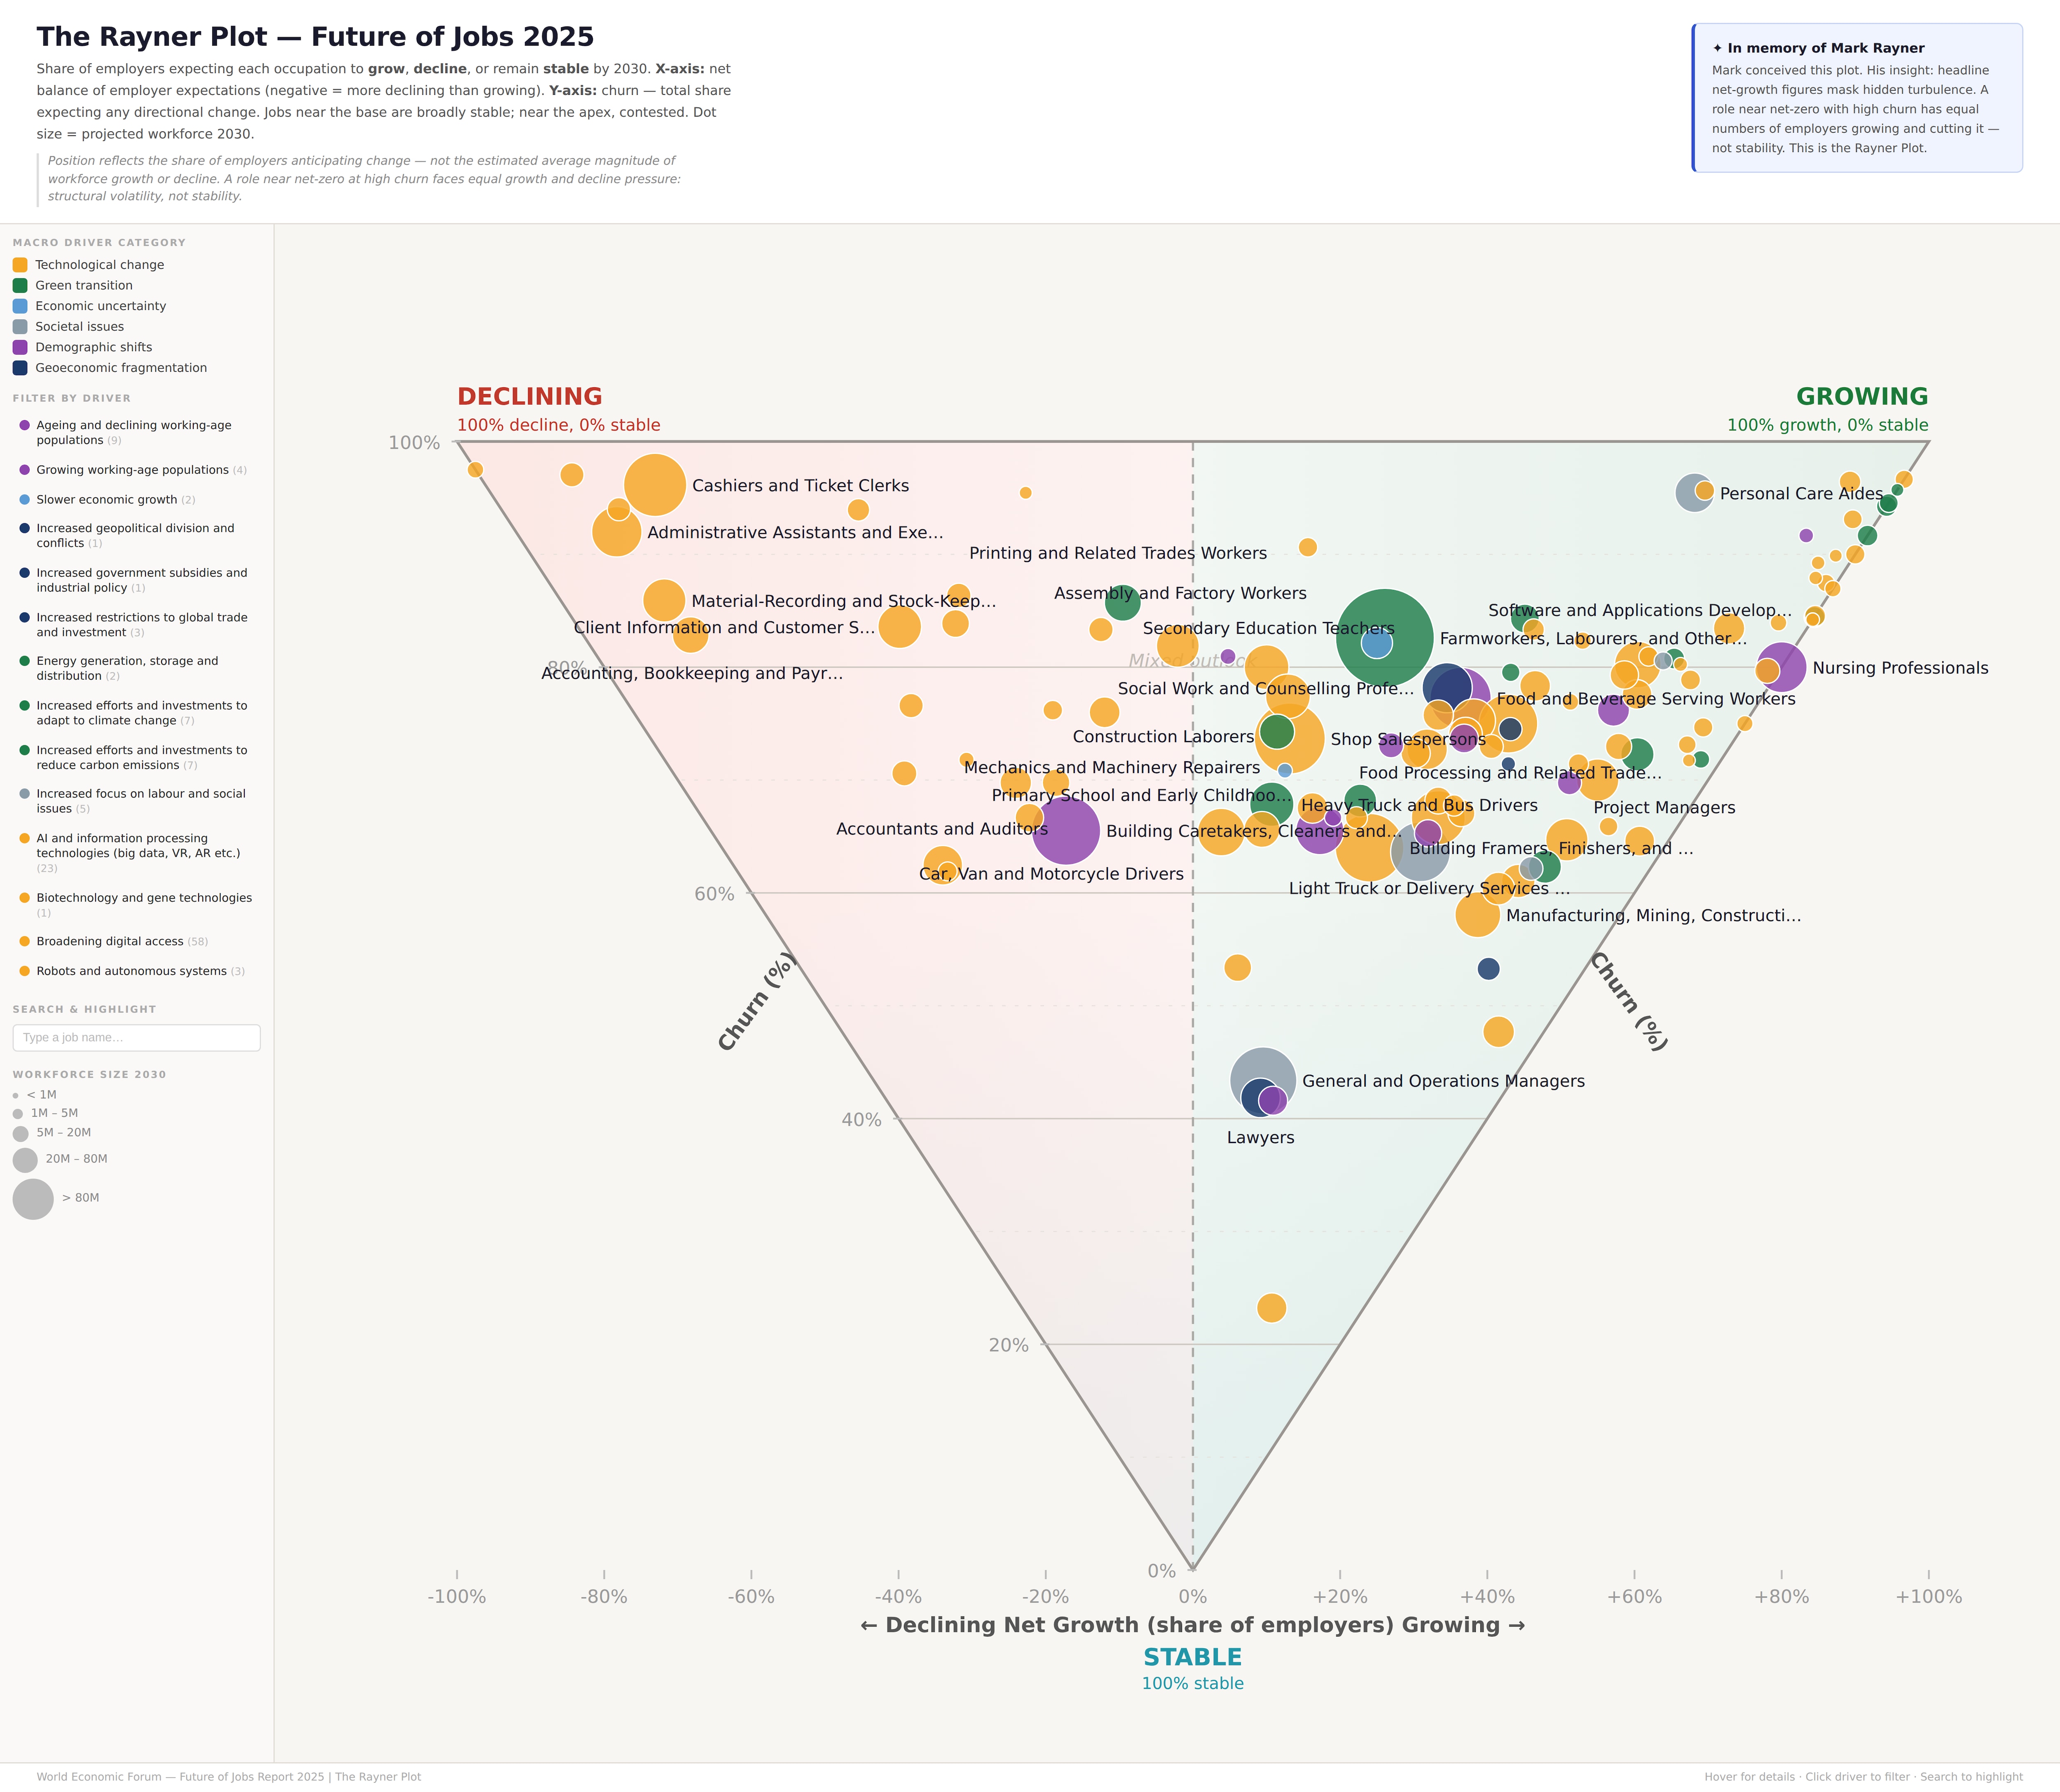
The Rayner Plot

The Rayner Plot Image: World Economic Forum

On Monday, 23 March, we lost Mark to a sudden illness. Our world is poorer without his caring nature, brilliant mind and deep passion.

Mark bought the rigour of a particle physicist to an economics role where his intellectual capacity often masked his connection to the lives of everyday workers and understanding of broad perspectives.

We miss you Mark.