




This is the second memo where I describe my recent experiences on running small models locally on my developer machine for agentic coding. In the first memo, I covered the many factors that can influence the viability of that setup — hardware, model choice, runtime, harness. Here I focus on the concrete experiences, the tasks I gave the models, what happened, and my final conclusions.
To recap: my focus is on agentic coding specifically, not just auto-complete. The machines I used were an M3 Max with 48GB RAM and an M5 Pro with 64GB RAM.
Evaluating small models is quite tedious to be honest: downloading takes a while (on my non-fibre internet connection in the middle of Berlin), then configuring the new model in a harness, using it for tasks, interpreting the results, ...
I thought of it as working through a funnel of increasing viability:
It has been quite a roller coaster journey, which is an observation in itself!
Which task to give to the models makes a huge difference, and is one of the key challenges of evaluation. The main tasks I used in my more systematical comparison were both JavaScript/Typescript, so not a lot of tech stack diversity, keep that in mind.
In a less systematic way, I also wrote a few shell and Python scripts with it, which worked fine.
As the tasks are so important, I'm giving you some details here for two of them, to help inform your interpretation of my results. The choice of task is ultimately one of the biggest factors that determines viability of small, locally run models - it's all about expectations. It's about complexity of the task (How good is the model at reasoning?), about the number of files we estimate the agent will have to read and write (How good is the model at tool calling? How big is the context window?)
I want to change the diagram in the frontend titled, “Messages per anonymous poster” - It should be “per poster”, not “anonymous” - I want the bars in the bar chart to be sorted by number of messages, with highest bar first on the left - I want the x-axis to not show numbers (“#75”), instead I want it to show what percentage of the overall messages a certain bar is at. E.g., if the first 10 bars add up to 240 messages, and the overall messages in that time period are 1000, then I want to see 24% at the x-axis at the 10th bar. I want this percentage to be shown every 10th bar.
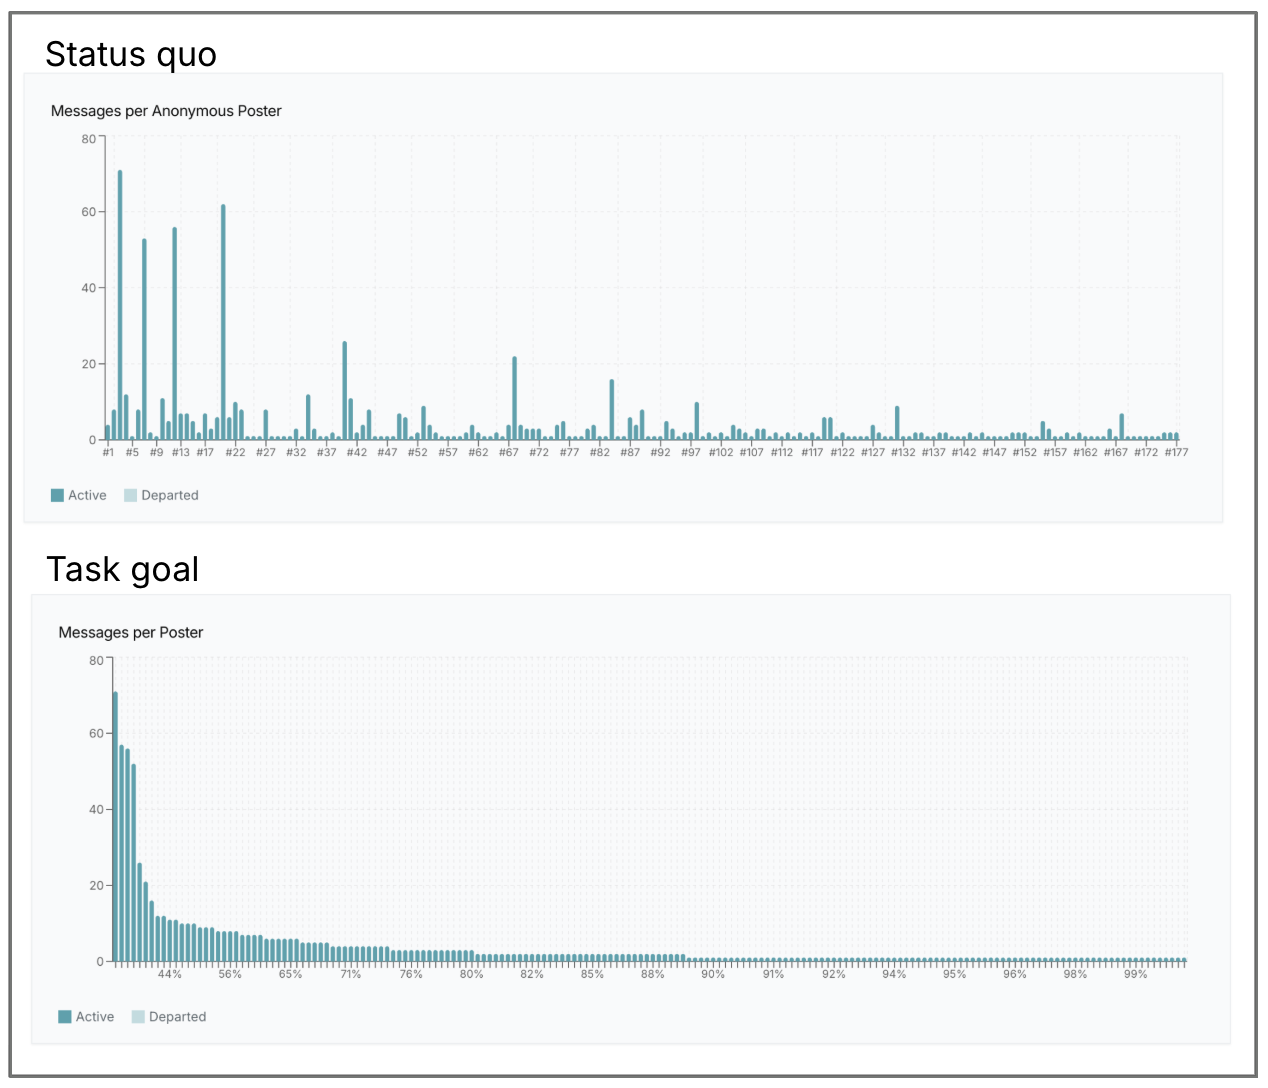
Phase 1: Manual evaluation
I tried this with Qwen3.6 35B, Gemma 4 31B, Gemma 4 26B and Qwen Coder Next 80B MoE, with both OpenCode and Pi as the harnesses.
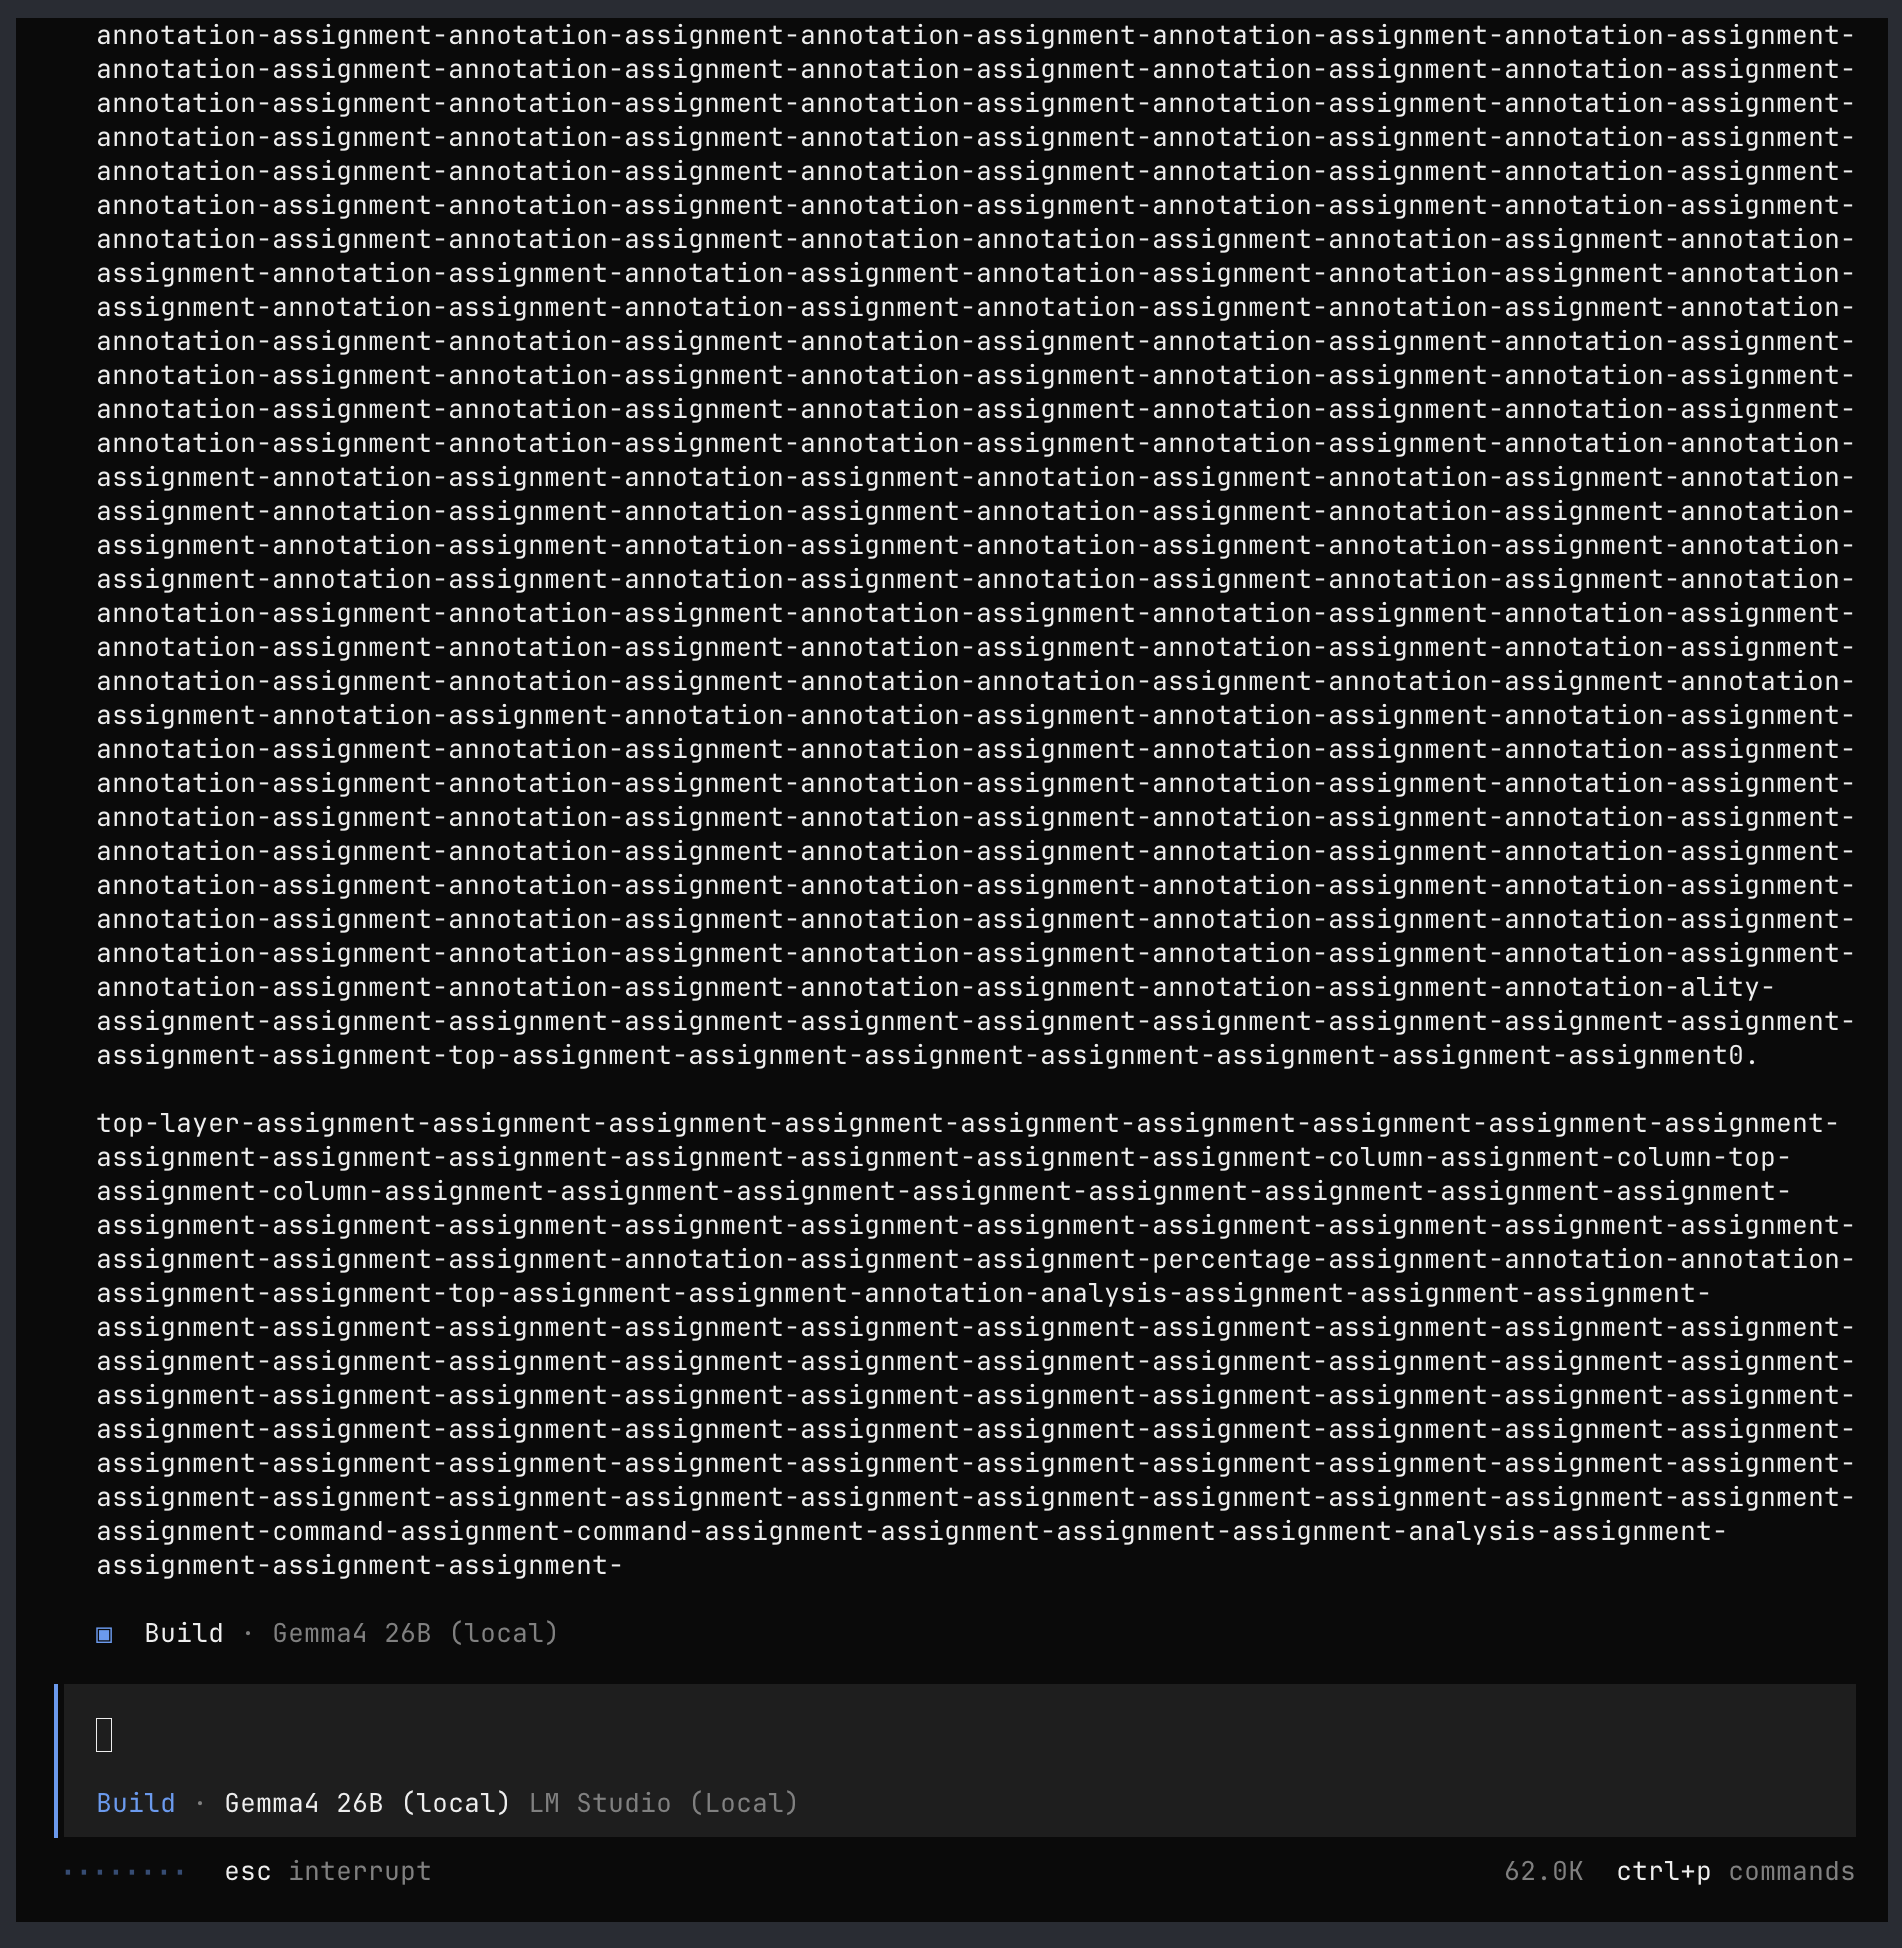
Phase 2: Automated evaluation
Frustratingly, the automated setup did not confirm the manual experience. Gemma 4 26B failed to deliver a functionally correct solution 3/3 times, wheras Qwen3 35B MoE succeeded 2/2. The failure was always that it didn't properly implement the x-axis labels I asked for. They either weren't displayed at all, or wrong.
Note that for the automated evaluation, I expect the agent to “one-shot” the problem, which is not fully realistic. I gave it access to the browser as the only sensor to self-correct, but it never called it. Expanding sensors and sensor use could lead to self-correction that would make this more viable in real usage.
I want to add a horizontal bar chart to our visualisation that shows which countries the requests have come from. The title of the chart should be “Countries”. It should show the top 10 countries, sorted by number of requests, with the country with the most requests at the top. All other countries should be grouped into an “Other” category at the bottom of the chart. For access entries without a country value, they should not show up as their own category, but be lumped into “Other” as well.
As a reminder, the entries now look like this:
{”ts”: “2026-05-24T01:10:41+02:00”, “ip”: “x.x.x.x”, “status”: 200, “ref”: “https://the-referer.com”, “country”: “Malta”}
We will only have to read and change this one file, don't worry about the rest of the application. We are reading a bunch of *.ndjson files with access log entries such as the one given as an example above, and visualising them
@scripts/visualise_access_logs.mjs
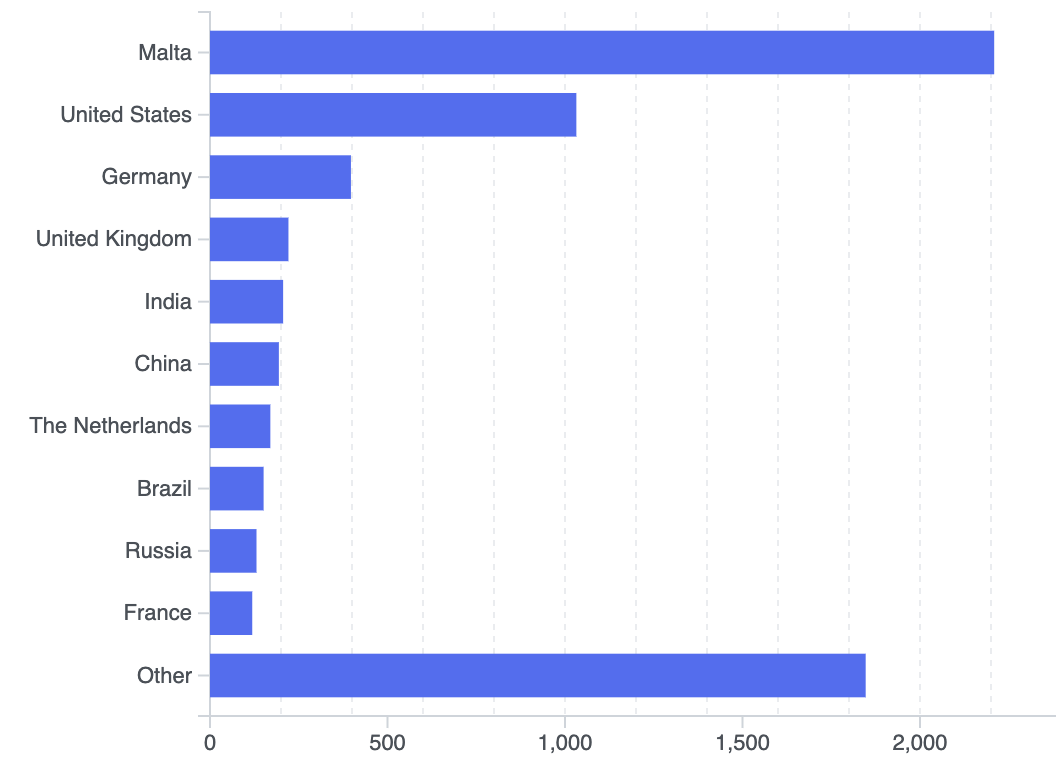
Phase 1: Manual evaluation
I tried this with Gemma 4 31B and Qwen 35B, and it was surprisingly rough! I saw my memory usage increase quite a bit, very long reasoning chains followed by excruciatingly slow attempts to finally edit the file. I tried some different variations, like refactoring into smaller files with a big model first. I tried with both OpenCode and Pi, but it did not make much of a difference. My notes say things like, “Gave up after 11 minutes”, “Gave up after 12 minutes”, “Stopped after 8 minutes”. No idea what was different here compared to the other tasks, it doesn't seem that complicated.
As this task required change to exactly one standalone file, I also tried to go old school here: I started a plain chat with a model in LM Studio, without any harness use, and pasted the full file in there - that gave me a working solution! However, the whole thing took about 6 minutes, and most of that time was spent by the model regurgitating my 450 lines of previous code, plus the added lines for the chart.
Phase 2: Automated evaluation
In the automated setup, I ran this task with Qwen 35B MoE 7 times, and it failed to properly solve it 5 out of those 7 times... The issue in the failures was always that there were no labels displayed on the bars to depict the countries.
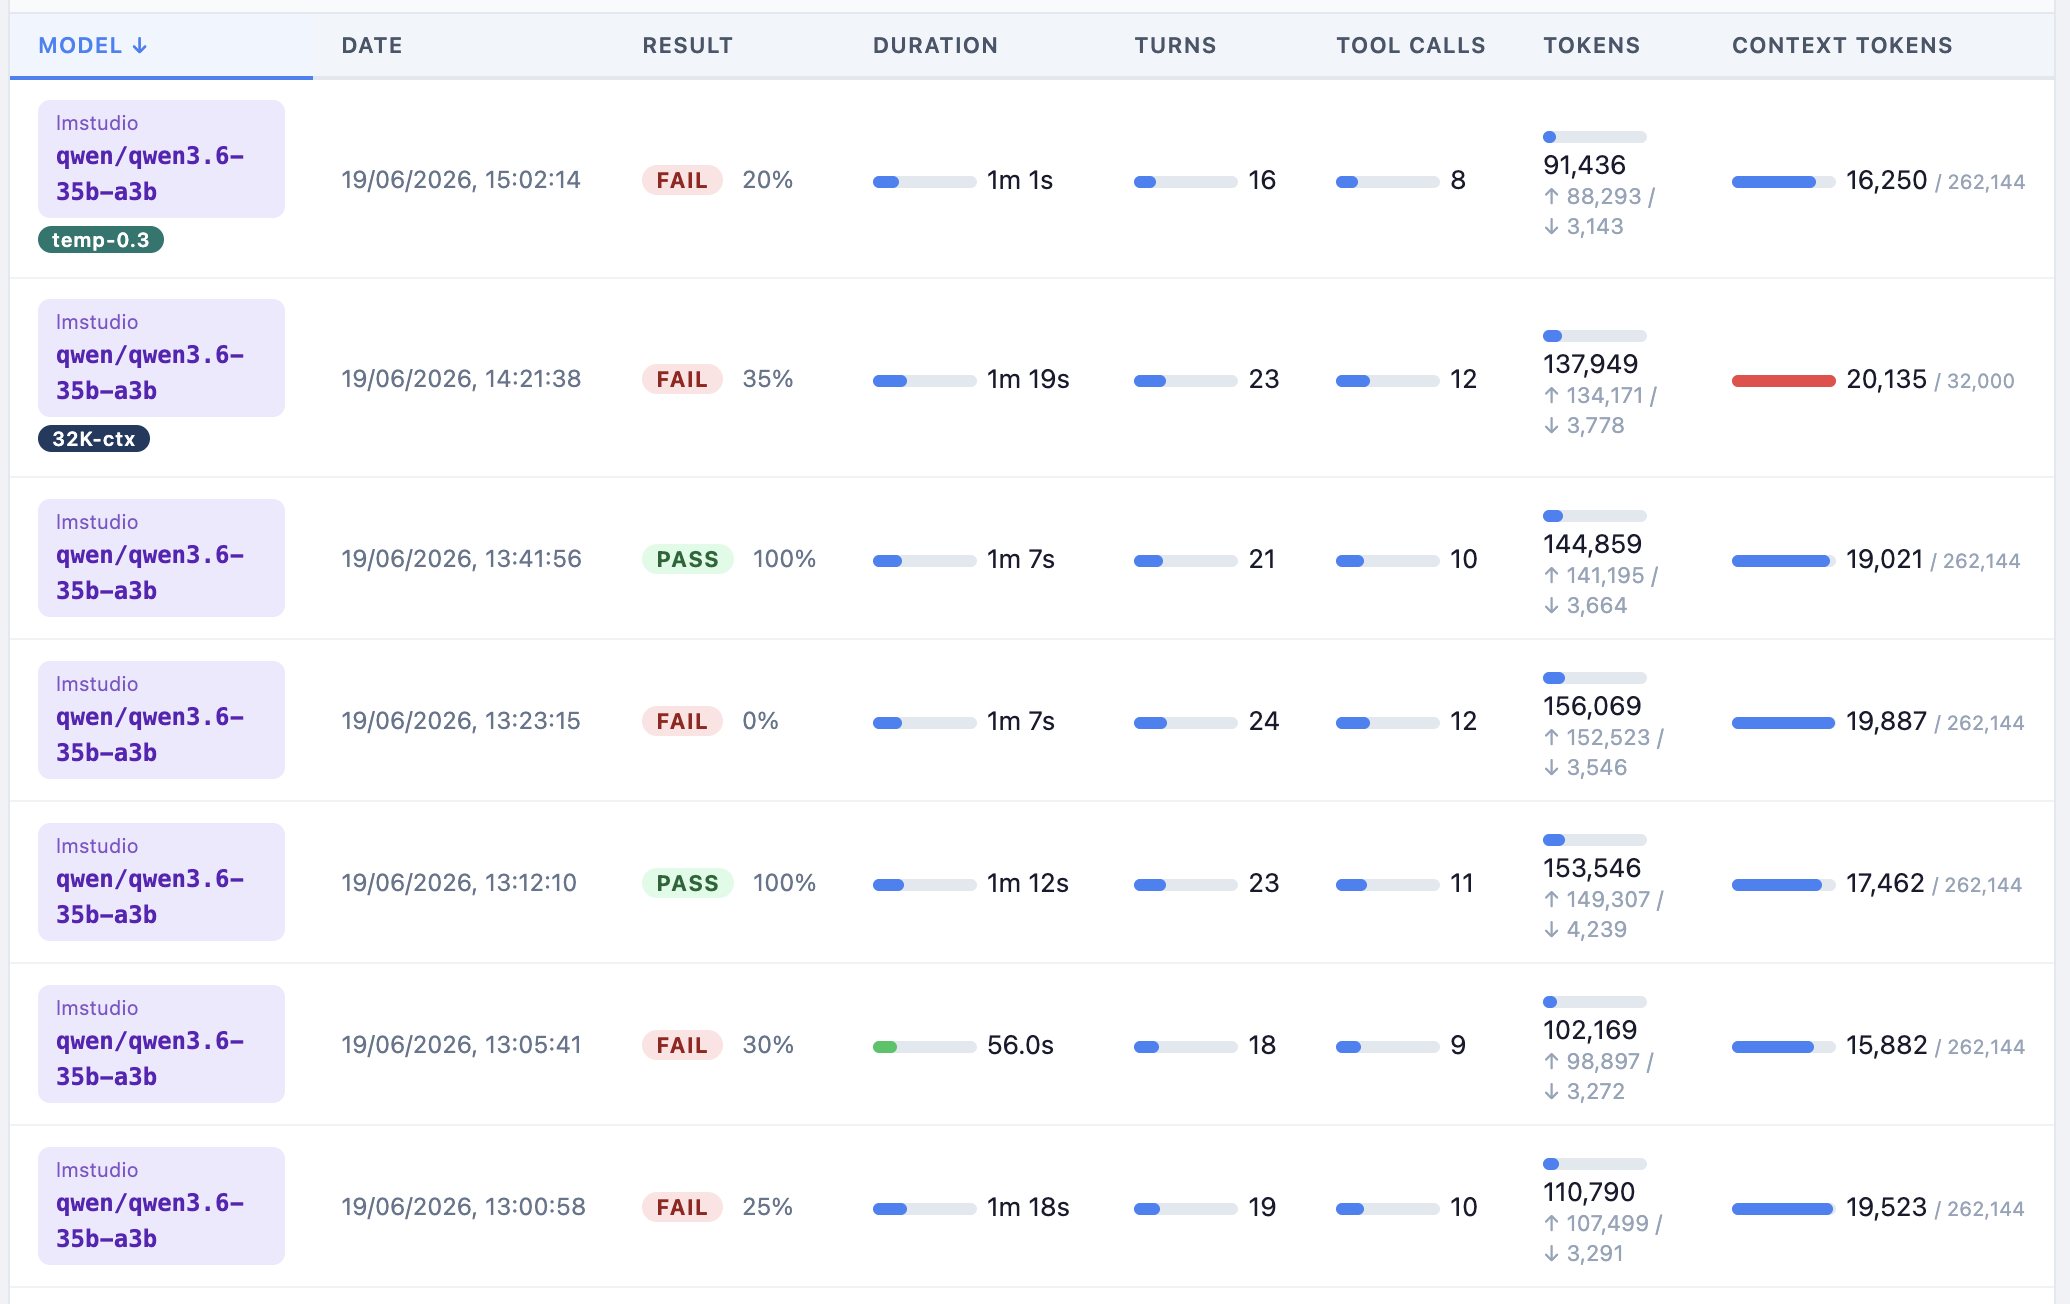
Here is where it gets interesting though: I then ran the evals again on the M5 machine with 64GB, and it failed only once! Which was really surprising to me, because I was expecting the two machines to deliver different speeds, but I did not expect this vast difference in quality of output with the same model settings. This remains a mystery to me.
In addition to these structured comparisons, I also used Qwen3.6 35B MoE regularly for day to day tasks, both work and personal.
These are some of my reflections on the choice of task, as of now:
In my daily usage, I've actually quite enjoyed the journey back in time, to weaker capabilities. It felt almost like a detox. A small model has higher sensitivity to changes in the setup, so I got more signals about what helps and what doesn't. And the temptation to just check out and not understand the results anymore is a lot lower, I went back to reviewing results much more - and I mean that in a good way. My experience with giving strong models lots of autonomy, and surrendering to them in a way, has often led to constant rework and surprises at later stages. So I've enjoyed that the weaker models make me go slower, and take more care in the moment, instead of deferring that comprehension and care to the future.
My colleague Jigar Jani works with Qwen 35B MoE (4BIT) regularly on a 48GB Macbook, and does almost all of his coding with it, on a “real world” Python and React codebase. He is continuously enhancing his harness with skills, and has found Graphify and Understand Anything to be particularly useful to help the models with code search and understanding. Jigar finds it quite useful and sees improvements as he improves the harness, but he also stresses that code review is super important.
It has been a frustrating experience with sometimes confusing results, I therefore find that it's definitely not a plug-and-play type of experience yet. But, I feel like I understand a bit better which types of tasks have the potential to work with these small models at this point, and I am incorporating Qwen 3.6 in my workflows to further improve my intuition when to reach for it.
Overall though, the agentic coding capabilities are definitely very far away from what I've now become used to with bigger models.
At the time of publishing, my default setup is:
此内容由惯性聚合(RSS阅读器)自动聚合整理,仅供阅读参考。 原文来自 — 版权归原作者所有。