







Every four years, the world stops for a month. Streets empty, offices grow suspiciously quiet, and collective breaths are held as the FIFA World Cup takes center stage. But here at Fastly, we don’t just experience the tournament by watching the pitches in Dallas, Miami, or Los Angeles. We watch the map.
As a platform that powers the moments that matter worldwide, we have a unique, real-time vantage point on human behavior. And when the World Cup schedule unfolds right here in our own time zones, the traffic flowing through our platform tells a fascinating story.
We’ve covered broad game viewership trends in other posts, but the World Cup is more than a story of bandwidth and bitrates. It’s a story of passion, loyalty, and the incredible mix of different cultures that defines the U.S. In this post, we share some of the most interesting things we discovered by analyzing World Cup traffic across the Fastly platform in the U.S.
Fastly’s Platform as a Microcosm of the World's Attention
Network traffic is, in a way, a proxy for human interest. When we look at how data shifts across our U.S. nodes during the group stages, we can literally map the country's diverse heartbeat.
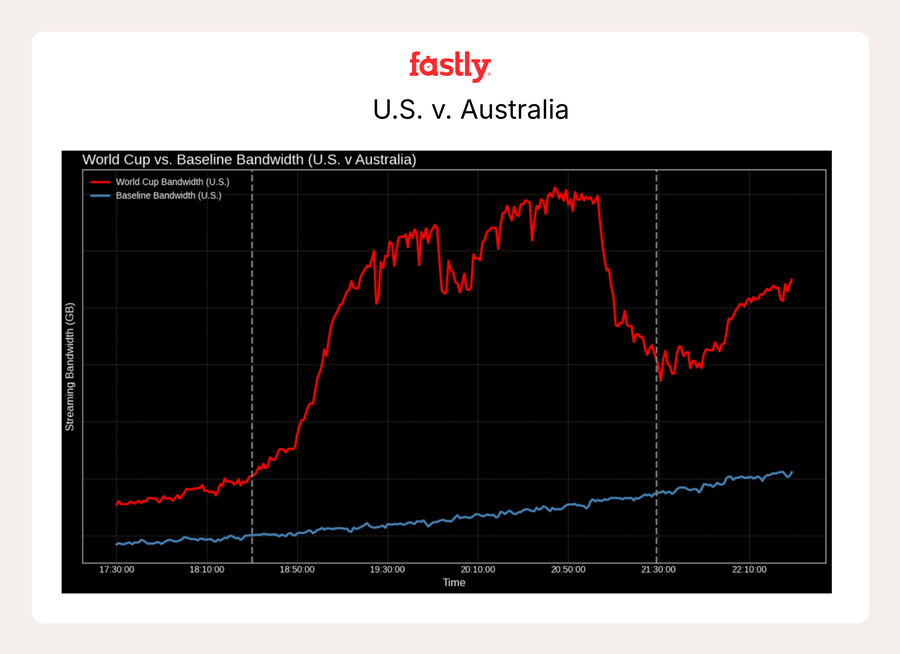
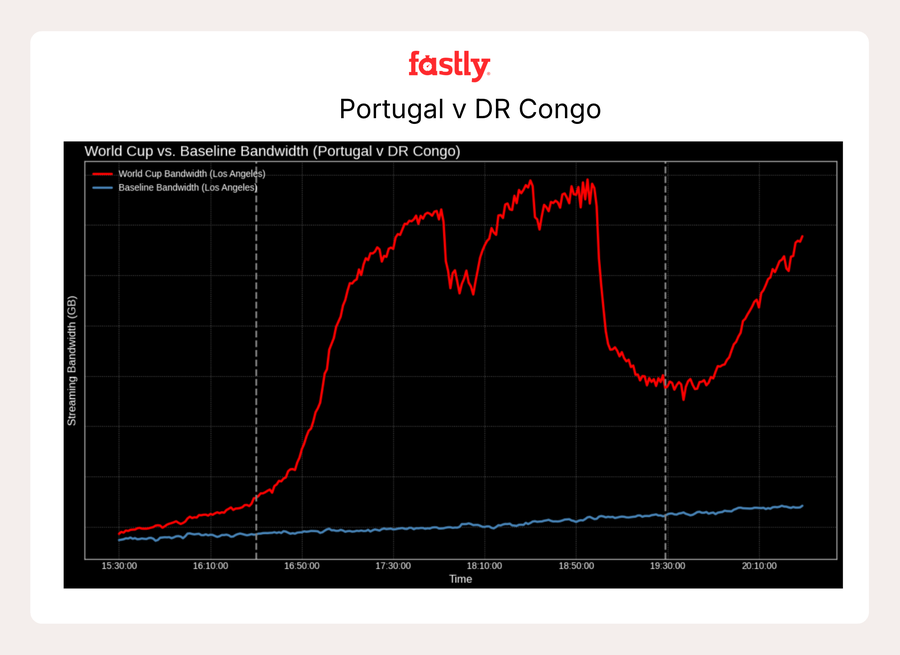
For each game, we analyzed minute-by-minute bandwidth consumption by PoP (Points of Presence) and compared that traffic to the same timeframe for the same weekday from June 3 through June 9 to provide a baseline comparison. For example, the US/Australia match took place on June 19 from 18:30 UTC to 21:29 UTC and we compared it to the same timeframe on June 5. We summed up bandwidth across the length of the game to provide aggregate increases versus baseline. All figures stated below use this methodology.
Here is what the data showed us as the tournament unfolded:
Australia: when the US Men's National Team took the pitch against Australia on a Friday, we saw a nationwide wave. Across the board, streaming traffic surged by 93% compared to the same time during our June 3–9 pre-World Cup baseline week. Interestingly, the biggest localized spikes weren't just in expected hubs, but in cities like Palo Alto and Vancouver, which saw bandwidth consumption jump by up to 3x during the game compared to the reference timeframe.
Portugal: During Portugal’s thrilling match against the Democratic Republic of Congo, traffic through our Miami and Los Angeles PoPs increased by a staggering 4.81x and 3.26x, respectively, dwarfing the national baseline for that time slot.
Sweden: When Sweden played Tunisia, we saw our servers in Columbus reach 3.1x greater than their baseline. Minneapolis lit up, peaking at 1.71x of their traffic levels over the reference period. Later, when Sweden faced the Netherlands, Minneapolis traffic levels reached 1.26x compared to pre-World Cup levels.
Cabo Verde: One of the most unexpected results to come out of the World Cup was Cabo Verde, one of the smallest countries to ever qualify. When Cabo Verde played Saudi Arabia, social media bandwidth jumped to 1.4x baseline, with particular spikes of 3.85x in Phoenix and 3.27x in Dallas. iGaming (betting) also saw traffic increase during all three Cabo Verde matches in our dataset, ranging from 1.6x to 2.2x the normal amount.
Delivering the Passion
These large, dynamic shifts are exactly what keep Fastly focused, and what get our engineering teams fired up. When millions of dispersed fans suddenly demand high-definition, ultra-low-latency video at the exact same second, our infrastructure delivers.
At the end of the day, bytes are just bytes, and servers are just metal. But the data they process during a World Cup represents something much bigger. It represents fans honoring their home cultures while watching on a smartphone in a break room. It represents a neighborhood gathering around a screen to celebrate the teams they grew up watching.
At Fastly, we don't just deliver data. We deliver those moments. And as the final whistle approaches, we'll be here, so the fans can keep cheering.
Learn more about how Fastly's platform can support your critical event streaming at scale.