











Server monitoring has always felt like a solved problem that nobody actually solved for the people who need it most. The options split into two extremes and neither is right for a solo developer running side projects. On one side you have Datadog, New Relic, and the rest of the SaaS stack, somewhere in the range of $15-30 per host per month, which sounds reasonable until you have five servers and you're looking at a $150 monthly bill for infrastructure that generates exactly zero revenue. On the other side you have the self-hosted route - Prometheus, Grafana, Alertmanager, node_exporter, all bolted together - and you spend a weekend configuring something that's more operationally complex than the infrastructure it's supposed to be watching. For a company with a dedicated platform team the second option makes sense. For a solo developer it really doesn't.
I've been in this situation for a while. Several projects, a handful of servers, and I just couldn't justify the cost for things that only I care about. The open source stack was always sitting there as a theoretical option but every time I got close I'd think about the maintenance burden and close the tab. So for longer than I'd like to admit I just didn't have any monitoring, which is its own kind of uncomfortable - you find out something's wrong when someone messages you, not when it starts going wrong.
I decided to build something instead.
The requirements were simple: CPU, memory, disk, and network metrics per server, alerts when something crosses a threshold, a dashboard I could look at without it feeling like a chore, and installation that doesn't consume half a day. I also needed it to work across different networks without firewall configuration, because I run servers in a few different places and the last thing I wanted was to open inbound ports everywhere just to scrape metrics.
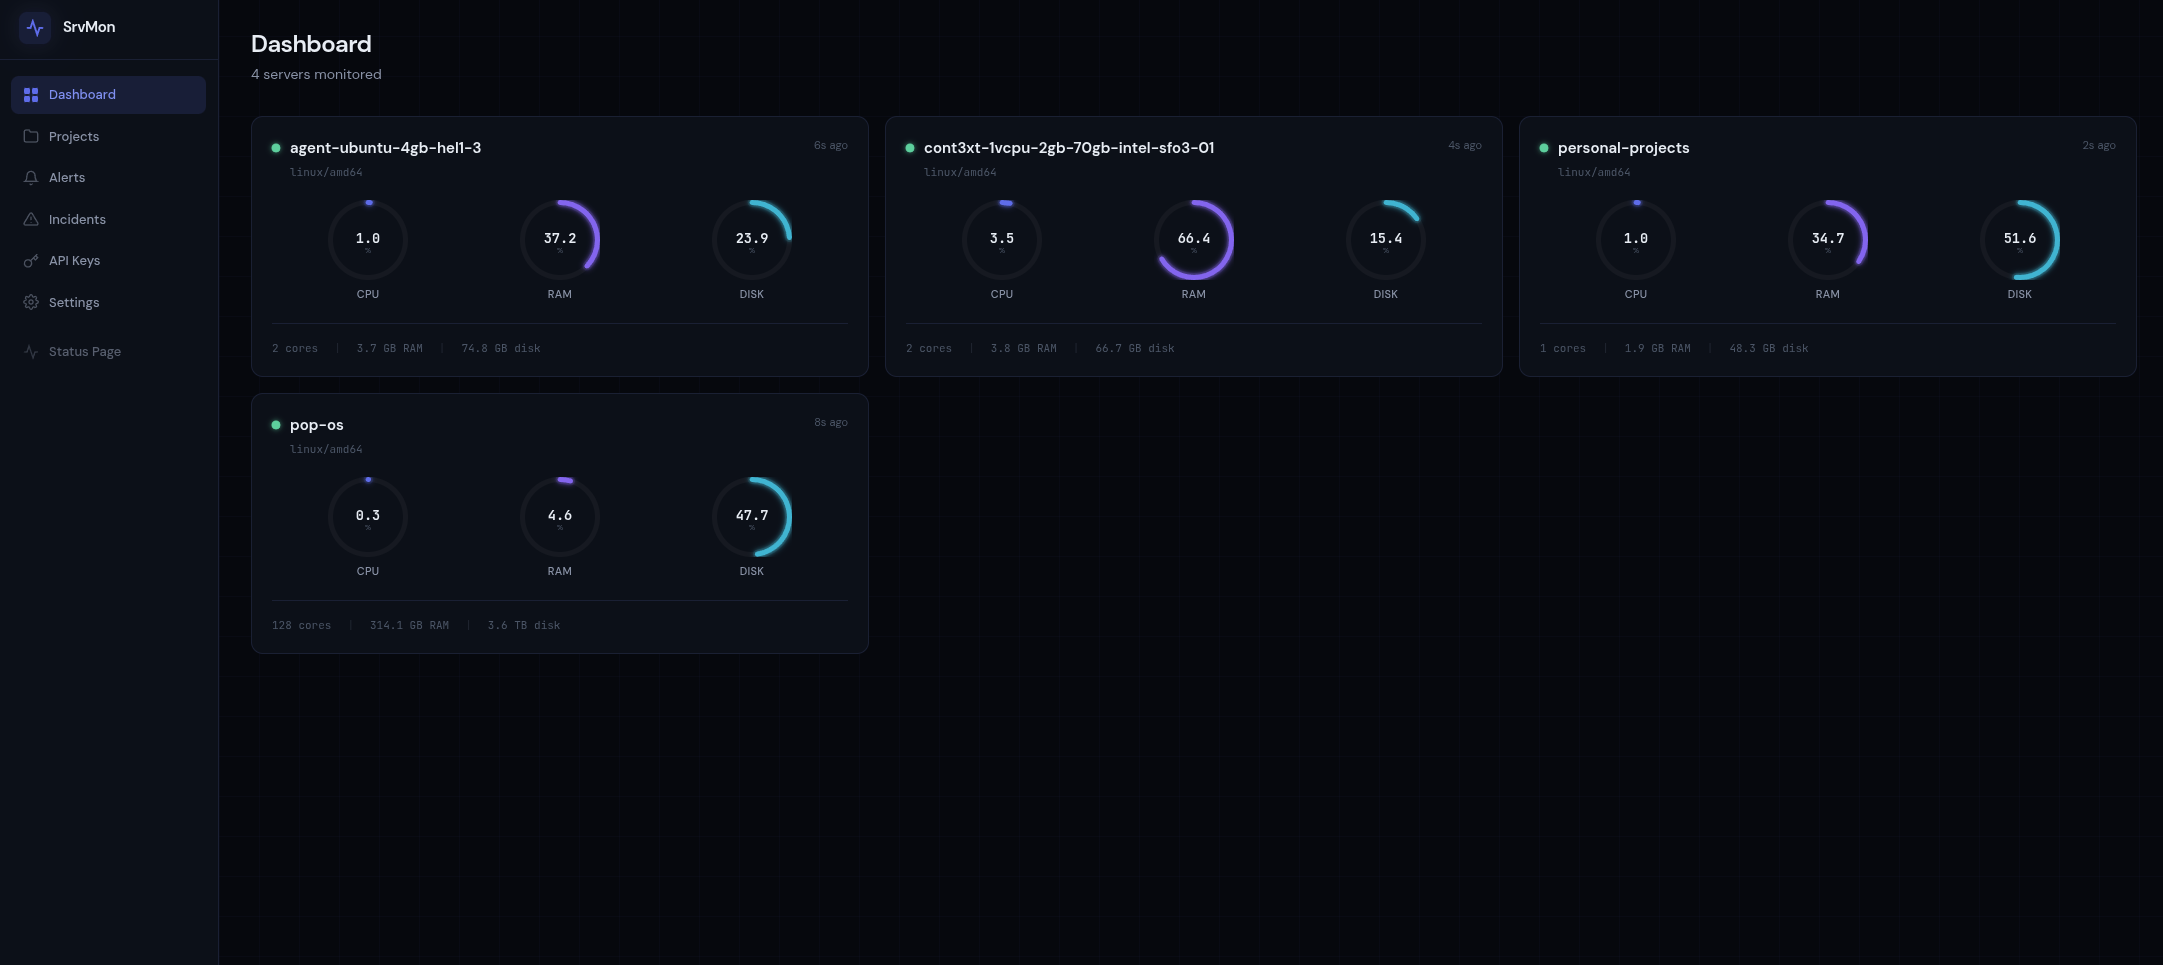
The result is SrvMon - a self-hosted server monitoring platform with a 6MB static agent binary, a Go API server backed by PostgreSQL, and a Vue 3 dashboard. No per-host pricing, no external service dependencies, no complex stack to maintain. It's open source and free to deploy yourself, or you can sign up at srvmon.dev and use the hosted version.
This is probably the obvious question, and the honest answer is setup complexity and maintenance overhead. Prometheus is genuinely excellent for what it does, but what it does assumes you have certain things already in place. It's pull-based, which means it needs to reach your servers, which means firewall rules or service discovery or both. You then need Grafana to actually see anything useful, and Alertmanager if you want notifications, and node_exporter on every host you want to monitor. Each of those is a dependency you own and need to keep running.
I've done this before on projects where it made sense - where there was a team and the monitoring stack was worth the investment. For a handful of personal servers it felt like using a crane to hang a picture frame. What I wanted was something I could deploy once, forget about, and trust to tell me when things go wrong.
The other thing worth saying is that Prometheus's pull model is genuinely the wrong architecture for monitoring servers across different networks. You'd need either a central Prometheus server with network access to everything, or a push gateway, or a federation setup - and at that point you're deep into configuration work that has nothing to do with actually monitoring your servers.
I built SrvMon almost entirely with Claude Code over a few days, working through a structured 13-phase plan where each phase was designed to produce a complete deployable feature rather than a pile of partial implementations. Claude Code handled around 98% of the implementation. The pace was fast enough that the thing that surprised me most wasn't how quickly the code came together, but how well the one-line agent installation worked - run a script, it detects your platform, downloads the binary, writes a config to /etc/srvmon/agent.env, creates a hardened systemd service unit, and starts it. That whole flow just worked.
I'm currently running SrvMon on four of my own servers and the agents have been quietly doing their job since I deployed them.
Deployment uses Ansible, which I reach for on almost every project at this point - agentless, idempotent, no orchestration infrastructure required. Caddy sits in front handling TLS automatically via Let's Encrypt, and GitHub Actions runs the Ansible playbook on every push to main. The whole server side is a single static Go binary and a PostgreSQL database.
The rest of this article covers how SrvMon works under the hood - the push-based architecture and why it beats pull for this use case, the Go backend design decisions, the database schema and query patterns, the alerting engine, and a full walkthrough of getting it running on your own server. Sign up free to keep reading.
Sign up to read the post and as well as all other member only posts. Subscribing only takes a few seconds and will give you immediate access.
Already have an account? Log in
此内容由惯性聚合(RSS阅读器)自动聚合整理,仅供阅读参考。 原文来自 — 版权归原作者所有。