





📊 TensorFlow Computational Graph
🔹 What is a Computational Graph?
A computational graph is a directed graph used to represent mathematical computations.
- Nodes (vertices) → Operations (like addition, multiplication, activation)
- Edges → Tensors (data flowing between operations)
👉 Simple idea:
Graph = Operations + Data flow
🔹 Components of the Graph
1. Nodes (Operations / Ops)
- Represent computations
-
Examples:
- Matrix multiplication (
matmul) - Addition
- Activation functions (ReLU, Sigmoid)
- Matrix multiplication (
👉 They take tensors as input and produce tensors as output
2. Edges (Tensors)
- Represent data flowing between nodes
-
Carry:
- Inputs
- Intermediate results
- Outputs
👉 Think: Edges = Data pipeline
🔹 How to Build a Computational Graph
Step 1: Define Operations
- Decide what computations you need (e.g., multiplication, loss calculation)
Step 2: Create Tensors
- Inputs
- Model parameters
- Intermediate values
Step 3: Connect Operations
- Link outputs of one operation to inputs of another
👉 This creates a graph structure
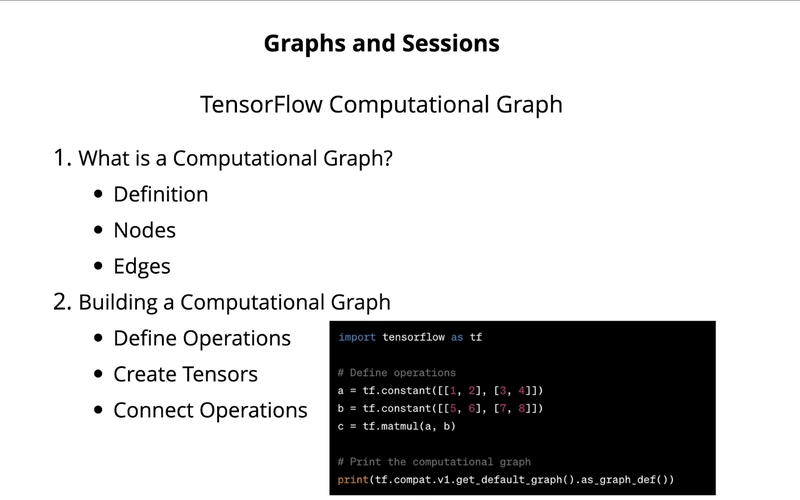
🔹 Example (Conceptual)
import tensorflow as tf

a = tf.constant([[1, 2], [3, 4]])
b = tf.constant([[5, 6], [7, 8]])

c = tf.matmul(a, b)
👉 Here:
-
a,b→ tensors (edges/data) -
matmul→ node (operation)
🔹 Execution of Graph (Sessions)
In TensorFlow 1.x style:
- Graph is built first
- Then executed using a session
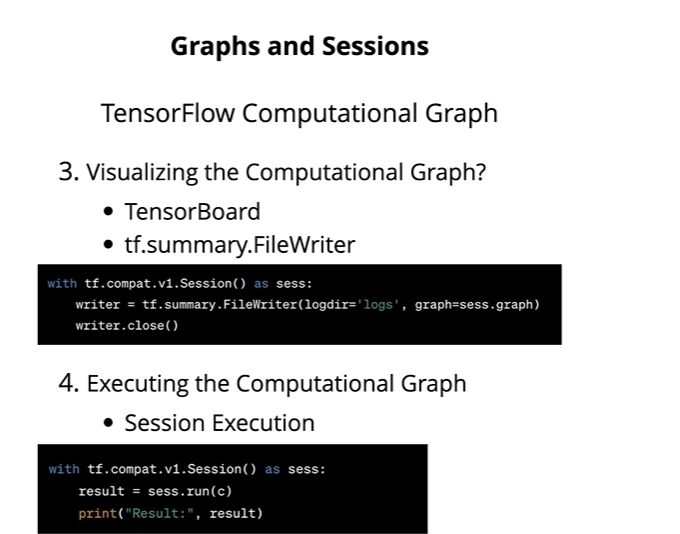
with tf.compat.v1.Session() as sess:
    result = sess.run(c)
    print(result)
👉 Important:
- Graph = Blueprint 🧠
- Session = Execution 🚀
🔹 Visualization (TensorBoard)
TensorFlow provides a tool called
TensorBoard
Use:
- Visualize graph structure
- Understand data flow
- Debug models
Example:
writer = tf.summary.FileWriter("logs/", graph=tf.compat.v1.get_default_graph())
writer.close()
Then run TensorBoard to view it.
🔹 Benefits of Computational Graph
✅ 1. Optimization
- TensorFlow optimizes execution
- Improves speed and memory usage
✅ 2. Portability
- Graph can be saved and reused
✅ 3. Debugging
- Visualization helps track errors
✅ 4. Parallelism
- Independent operations can run simultaneously
🔹 Important Note (Modern TensorFlow)
In TensorFlow 2.x:
- No need for explicit sessions
- Uses eager execution (default)
👉 Code runs immediately, like normal Python
But:
- Computational graph still exists internally (for optimization)
🎯 One-Line Summary (Exam Ready)
A TensorFlow computational graph is a directed graph where nodes represent operations and edges represent tensors, enabling efficient execution, optimization, and visualization of machine learning models.
⚡ What is Eager Execution (TensorFlow 2.x)?
👉 Eager Execution = “Run code immediately”
- As soon as you write a line, it executes instantly
- Works like normal Python / NumPy
✅ Example:
import tensorflow as tf

x = tf.constant([1, 2, 3])
print(x)
👉 Output comes immediately
🧠 Simple Understanding
Eager = “No waiting, no graph building, just direct result”
🧩 What is Graph Execution (TensorFlow 1.x)?
👉 Graph Execution = “Build first, run later”
- First: create a computational graph (blueprint)
- Then: execute using a session
❗ Key Idea:
Code does NOT run immediately
🧠 Simple Understanding
Graph = “Plan everything first, then execute”
⚔️ Eager vs Graph Execution (Easy Comparison)
| Feature | Eager Execution ⚡ | Graph Execution 📊 |
|---|---|---|
| Execution | Immediate | Delayed |
| Debugging | Easy | Hard |
| Style | Like Python | Like building a model graph |
| Flexibility | High | Less |
| Performance | Slower (sometimes) | Faster (optimized) |
| Default | TF 2.x | TF 1.x |
🔥 Important Concept: @tf.function
TensorFlow 2.x gives both worlds 👇
👉 By default: Eager mode
👉 With @tf.function: Graph mode
Example:
import tensorflow as tf

@tf.function
def matmul(a, b):
    return tf.matmul(a, b)
👉 What happens:
- Function is converted into a computational graph
- Runs faster (optimized)
🧠 Simple Understanding
@tf.function= “Convert Python code → Graph for speed”
🚀 Why Use Graph Mode?
Even though eager is easy, graph mode is powerful:
✅ Benefits:
- Faster execution (optimization)
- Better for large models
- Can use XLA (Accelerated Linear Algebra) optimization
- Easy to save & deploy models
🎯 Final Exam Answer (Short)
Eager execution in TensorFlow 2.x executes operations immediately like normal Python, making debugging easy. In contrast, graph execution builds a computational graph first and executes it later in a session. TensorFlow 2.x uses eager execution by default but allows graph execution using
@tf.functionfor better performance and optimization.
Good question—this is exactly where many people get confused 👍
In TensorFlow 2.x, graphs are mostly hidden, so you need a tool to see them.
👀 How to Visualize a TensorFlow Graph
The main tool is 👉 TensorBoard
🔹 Method (TensorFlow 2.x)
You need to:
- Convert your function into a graph using
@tf.function - Log it
- Open TensorBoard
✅ Step-by-Step
1. Create a Graph Function
import tensorflow as tf

@tf.function
def my_func(a, b):
    return tf.matmul(a, b)
2. Enable Logging
log_dir = "logs/graph"

writer = tf.summary.create_file_writer(log_dir)

tf.summary.trace_on(graph=True, profiler=False)

a = tf.constant([[1, 2]])
b = tf.constant([[3], [4]])

my_func(a, b)

with writer.as_default():
    tf.summary.trace_export(
        name="my_graph",
        step=0,
        profiler_outdir=log_dir
    )
3. Run TensorBoard
Open terminal and run:
tensorboard --logdir=logs/graph
Then open browser:
👉 http://localhost:6006
🧠 What You’ll See
- Nodes = operations (
MatMul, etc.) - Edges = tensors (data flow)
- Full computational graph visualization
🔥 Simple Understanding
TensorBoard = “Graph ka map” 🗺️
It shows how data flows inside your model
⚠️ Important Notes
- Without
@tf.function, graph won’t appear properly - Eager execution does not create a visible static graph
- Graph is created only when tracing happens
🎯 One-Line Answer (Exam)
TensorFlow graphs can be visualized using TensorBoard by tracing a
@tf.functionand exporting it to log files, which are then displayed as a computational graph.