





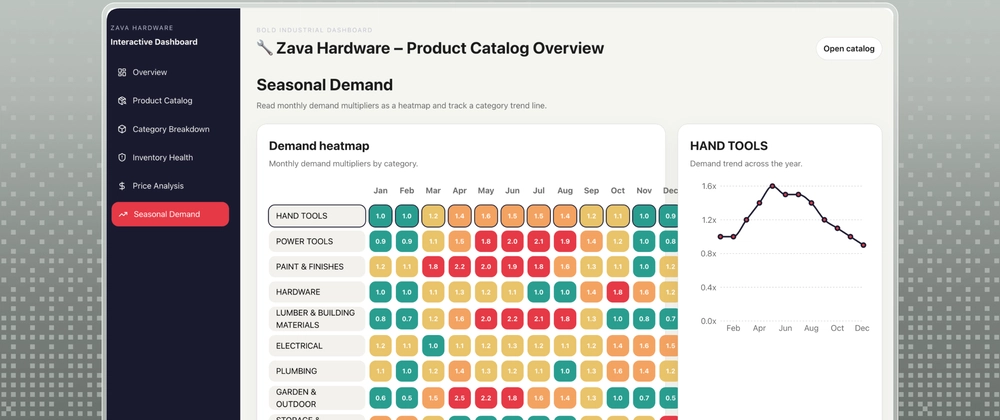

Every Thursday, GitHub hosts a livestream - Rubber Duck Thursdays across multiple time slots, where we go over what's new in the world of GitHub, engage in community discussions and live QnA and build awesome projects together!
This week, we dove into the GitHub Copilot CLI showcasing /research, /share, /plan, /fleet, /env for a scenario I think you'll find interesting.
What did we build?
Let's set the scene.

You work at Zava and are going about with your uneventful day, when an urgent request drops in your inbox, for you to prepare an interactive inventory & sales intelligence dashboard for an upcoming business review with key stakeholders.
It will take the BI team at least 3 weeks to build the dashboards, and no - you don't have 3 weeks. The review is in 3 days!
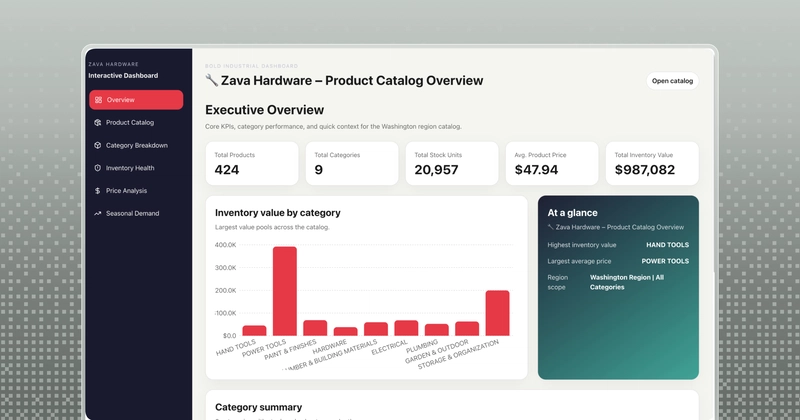
All you have is a messy JSON export from your inventory system sitting on your computer. So we had Copilot shape our raw data, design and build an interactive Electron dashboard ready for presentation.
How did we build it?
Messy JSON file. Dirty data. Zero clue about the data and data structure.
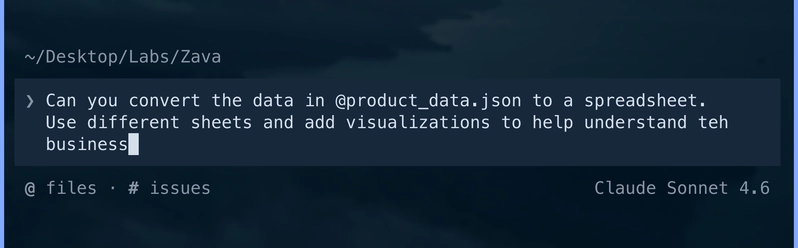
Step 1: We asked Copilot to convert the product_data.json into an excel spreadsheet to familiarize ourselves with the business information.
Good. We now have an excel file with clean data - grouped in different sheets, and this forms the foundation of what comes next.
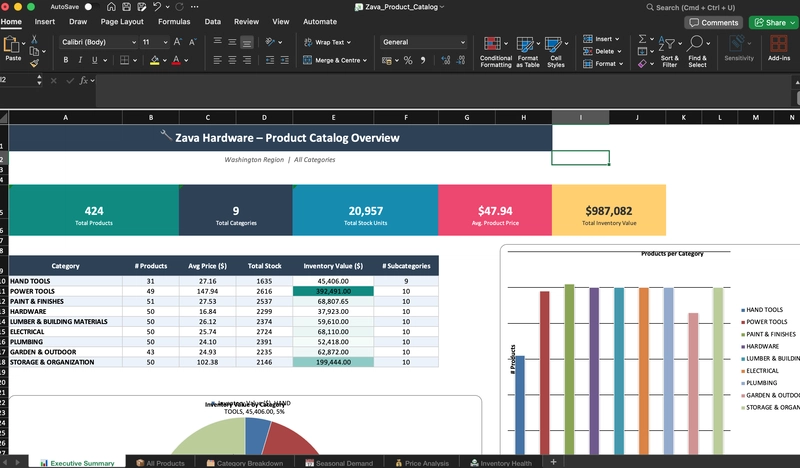
Step 2: Before diving straight into writing the code, wouldn't it be nice to work on quick designs, get those approved and then start development? I mean - a mistake in the design stage would be cheaper, both time-wise and token-wise, compared to re-implementing functionality down the line, right?
I've heard good reviews of Pencil, an agent-driven MCP canvas for 'vibe-designing', but was yet to give it a try.
The tool is fairly new, so we pointed Copilot to its documentation to conduct deep research and basically know all there is to know about the tool, what it is and how it works. We used /research to initiate the research session.
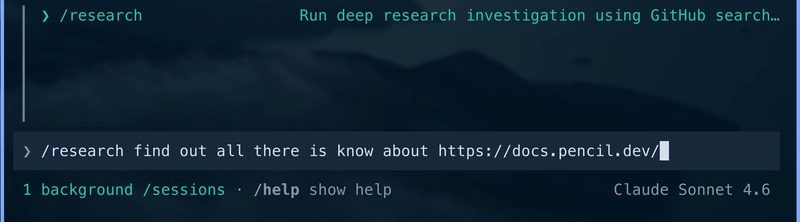
We got back a comprehensive report on Pencil, which we saved in our working directory using /share file research research.md, and reset our context for the next step.
Step 3: We have the clean product data in excel and research findings on Pencil. Now we needed to create an implementation plan to capture both the Design and Development phases. For that, we switched over to /plan mode, pointing to both the xlsx and research.md, to generate a plan.
![I want to build an interactive dashboard for [📈 zava_product_dashboard.xlsx] and start with complete end-to-end designs <br>
first using @research.md](https://irss.plus//node/data/uploads/original/image/33/d4/33d464a0c5395218575e7c03aafc6699.webp)
Plan is ready. We save the plan in plan.md in our working directory and reset the context again with /new.
Step 4: It's design time!

I had already installed the Pencil MCP server, so Copilot at this point had access to all the tools it needed to interact with the Pencil canvas. We saw our designs start to pop up on canvas in real time, and the agent captured screenshots for each page and added them into our working directory as instructed.

Step 5: Designs were coming in hot! We got to the last part - building the app.
Few words about using /fleet orchestration @houeseokay
A question about the /fleet command was asked on the Livestream, so we incorporated it into our workflow.
While one agent was wrapping up on our designs on Pencil, we kicked off a fleet job where copilot orchestrated 2 agents running in parallel: One to review our designs as they came in, and one to start on the Electron app.
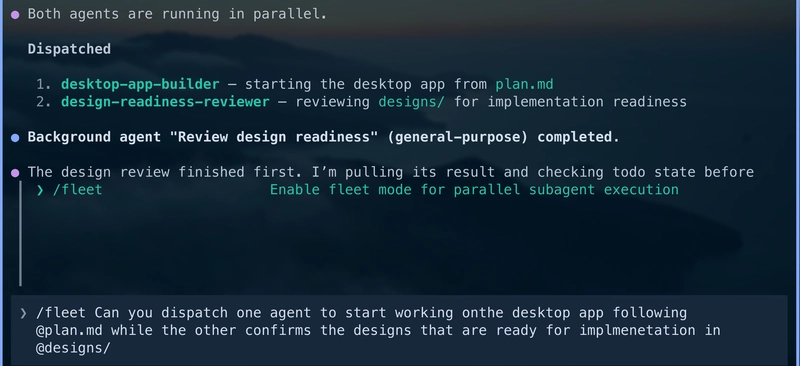
... And shortly after the livestream, this is what we got with GPT-5.4.
Now, the stakeholder Business Review can be moved earlier in the week - and we will be READY!
Watch the livestream for the full workflow.
Just getting started with the GitHub Copilot CLI? Check out the GitHub Copilot for Beginners Course for quickstarts and more tips!