







Since the ZeroDayClock relaunch, many people have asked me to bring back Time to Exploitation, and I understand why, because CISOs keep telling me that the clock helped them explain to engineering teams and to business leaders why response speed matters. In this post I want to explain why we are moving beyond a single TTE curve, what comes next for ZeroDayClock, and what the recent criticism of the project gets right and where it does not hold up.
When I launched ZeroDayClock early in 2026, the goal was to find one message that CISOs and decision makers could use to raise awareness and support the calls to action we have been making for years.
In cybersecurity, we always try to measure speed through metrics such as mean time to detect, mean time to respond and mean time to remediate, because the time it takes us to act affects what an attacker can achieve. I chose Time to Exploitation to bring the vulnerability discovery and exploitation side of that discussion into focus, drawing on an established industry metric to make timing part of the conversation about vulnerability management.
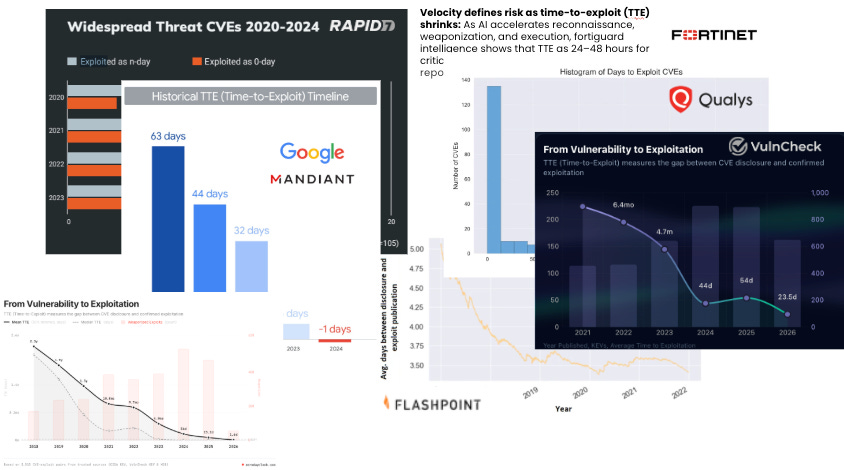
After the launch of ZDC, the chart appeared in the press, in presentations at RSA and the World Economic Forum, and in discussions with governments and boards. For me, its value was helping people start conversations about security problems we have struggled to get attention for, despite years of explaining why they matter.
That reach has also led to the occasional surreal moment when vendors started to pitch ZeroDayClock back to me in their opening slides, before explaining how their product would solve the problem it described.
Having worked as a CISO on both the vendor and customer sides, I understand the frustration with security marketing. I want ZeroDayClock to help leaders understand the problem and make better decisions, and its success should be judged by that contribution rather than how often it appears in a sales presentation.
TTE provided a clear starting point, but it cannot carry the full picture of a changing threat anymore and it also has some weaknesses I would like to address. The next step is to build on that foundation with measures that give defenders a broader macro-view of what is changing and what it means for their response.
A vulnerability disclosed five years ago has had five years to accumulate evidence of exploitation, while one disclosed last month has had only a month. Comparing their recorded exploitation times without accounting for that difference can make recent vulnerabilities look artificially faster.
Imagine watching a marathon and using the average time of the first eight finishers to describe the typical runner, while thousands are still on the course. Your calculation describes the runners who have finished, but the slower results have not arrived yet.
The same problem affects TTE when recent vulnerability cohorts have not had enough time to reveal exploitation recorded months or years after disclosure. That applies to ZeroDayClock as much as to any other TTE chart. The original version did not adjust for it, so recent years looked faster than they were, which means the acceleration it showed, and the share of it I attributed to AI, were both stronger than the data supports.
Historical results can also change as KEV catalogues add evidence about older vulnerabilities, including attacks that happened years before the records were added. VulnCheck has explicitly documented recent additions based on historical exploitation evidence, which shows why catalogue growth can change our understanding of the past as well as the present.
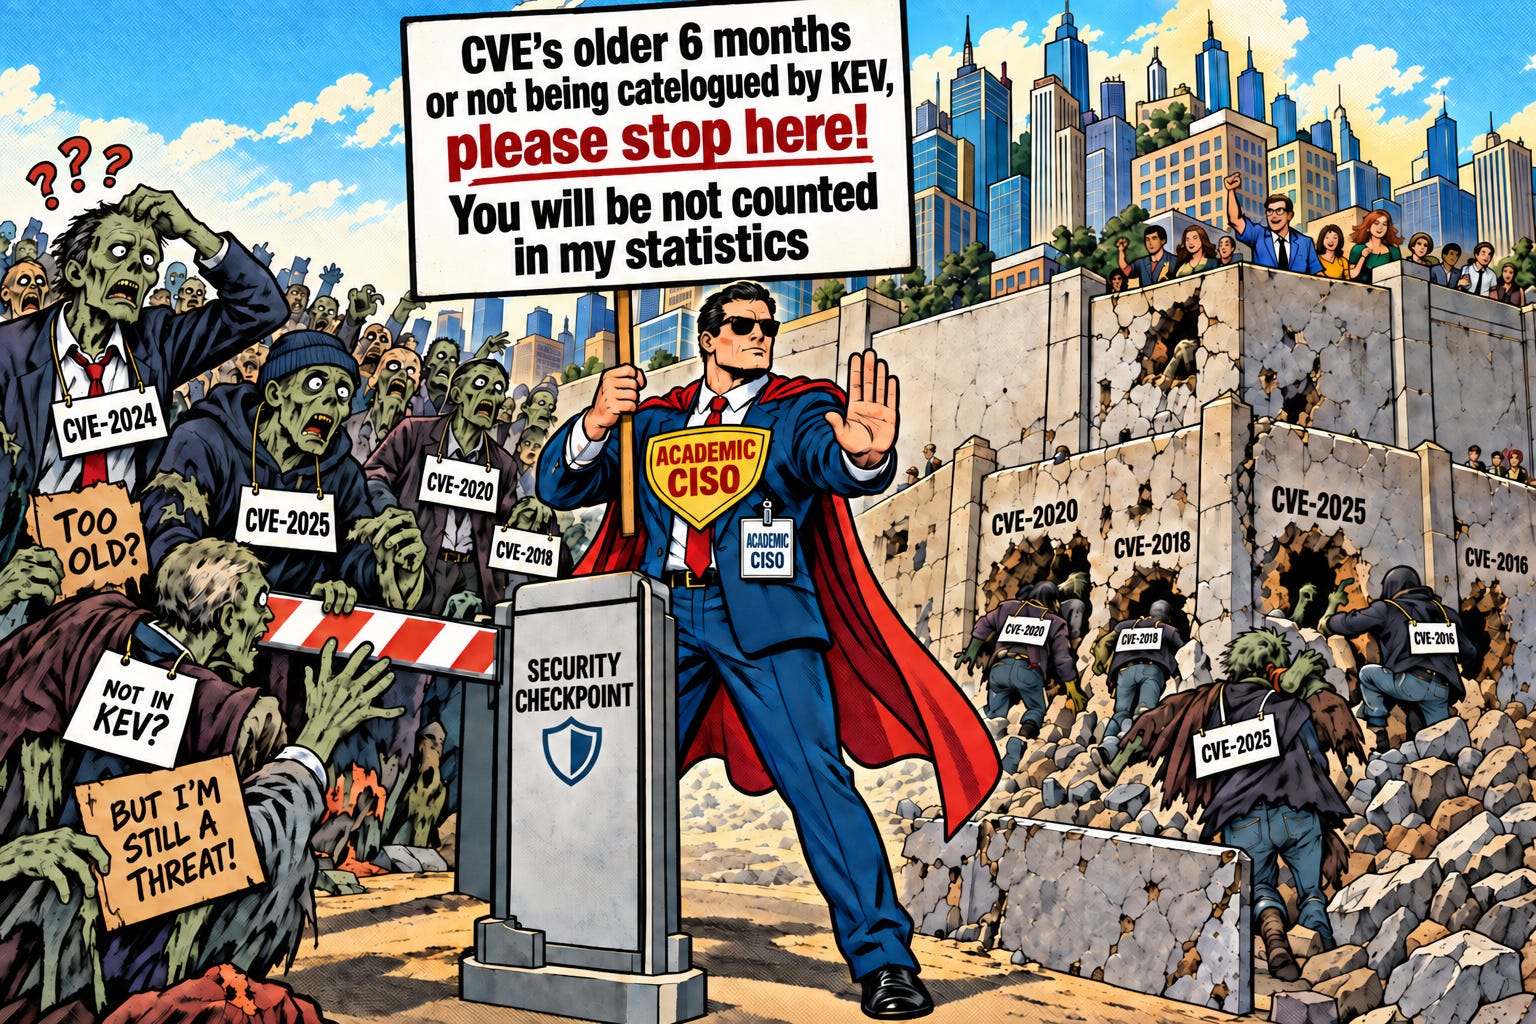
Giving each cohort the same observation period (e.g. 6 months) could be statistically a useful solution, but only if the vulnerabilities that were not exploited in that window stay in the count. Otherwise you are still averaging the finishers.
For CISOs, the operational problem continues beyond whichever period we choose for that comparison. A vulnerability does not disappear from an exposed system after six months, and attackers can continue exploiting weaknesses disclosed years ago. A fair comparison of recently disclosed vulnerabilities therefore answers one useful question, while the exploitation of older vulnerabilities remains another part of the problem we need to measure.
The same discipline applies to other familiar cybersecurity metrics, because the outcomes missing from a calculation can matter as much as those included:
MTTD and dwell time: Timing only the intrusions we discover leaves those still undetected outside the calculation.
Mean time to remediate: An average based only on completed remediation can look healthy while the unresolved backlog continues to grow.
Vulnerability lifetime: Estimates based on discovered bugs may not represent the bugs that remain hidden.
Time to compromise in a red team exercise: Averaging only successful compromises during a two week engagement leaves out attempts that did not succeed before the test ended
ZeroDayClock needs both fair comparisons of exploitation timing and a view of exploitation activity across vulnerabilities of every age, because the end of an observation period is not the end of our exposure.
A TTE curve can move because attackers change their behavior, because exploitation is reported sooner, or because we start observing a different set of vulnerabilities. A single average cannot tell us which of these changes is driving the result.
Why the dates cluster around disclosure
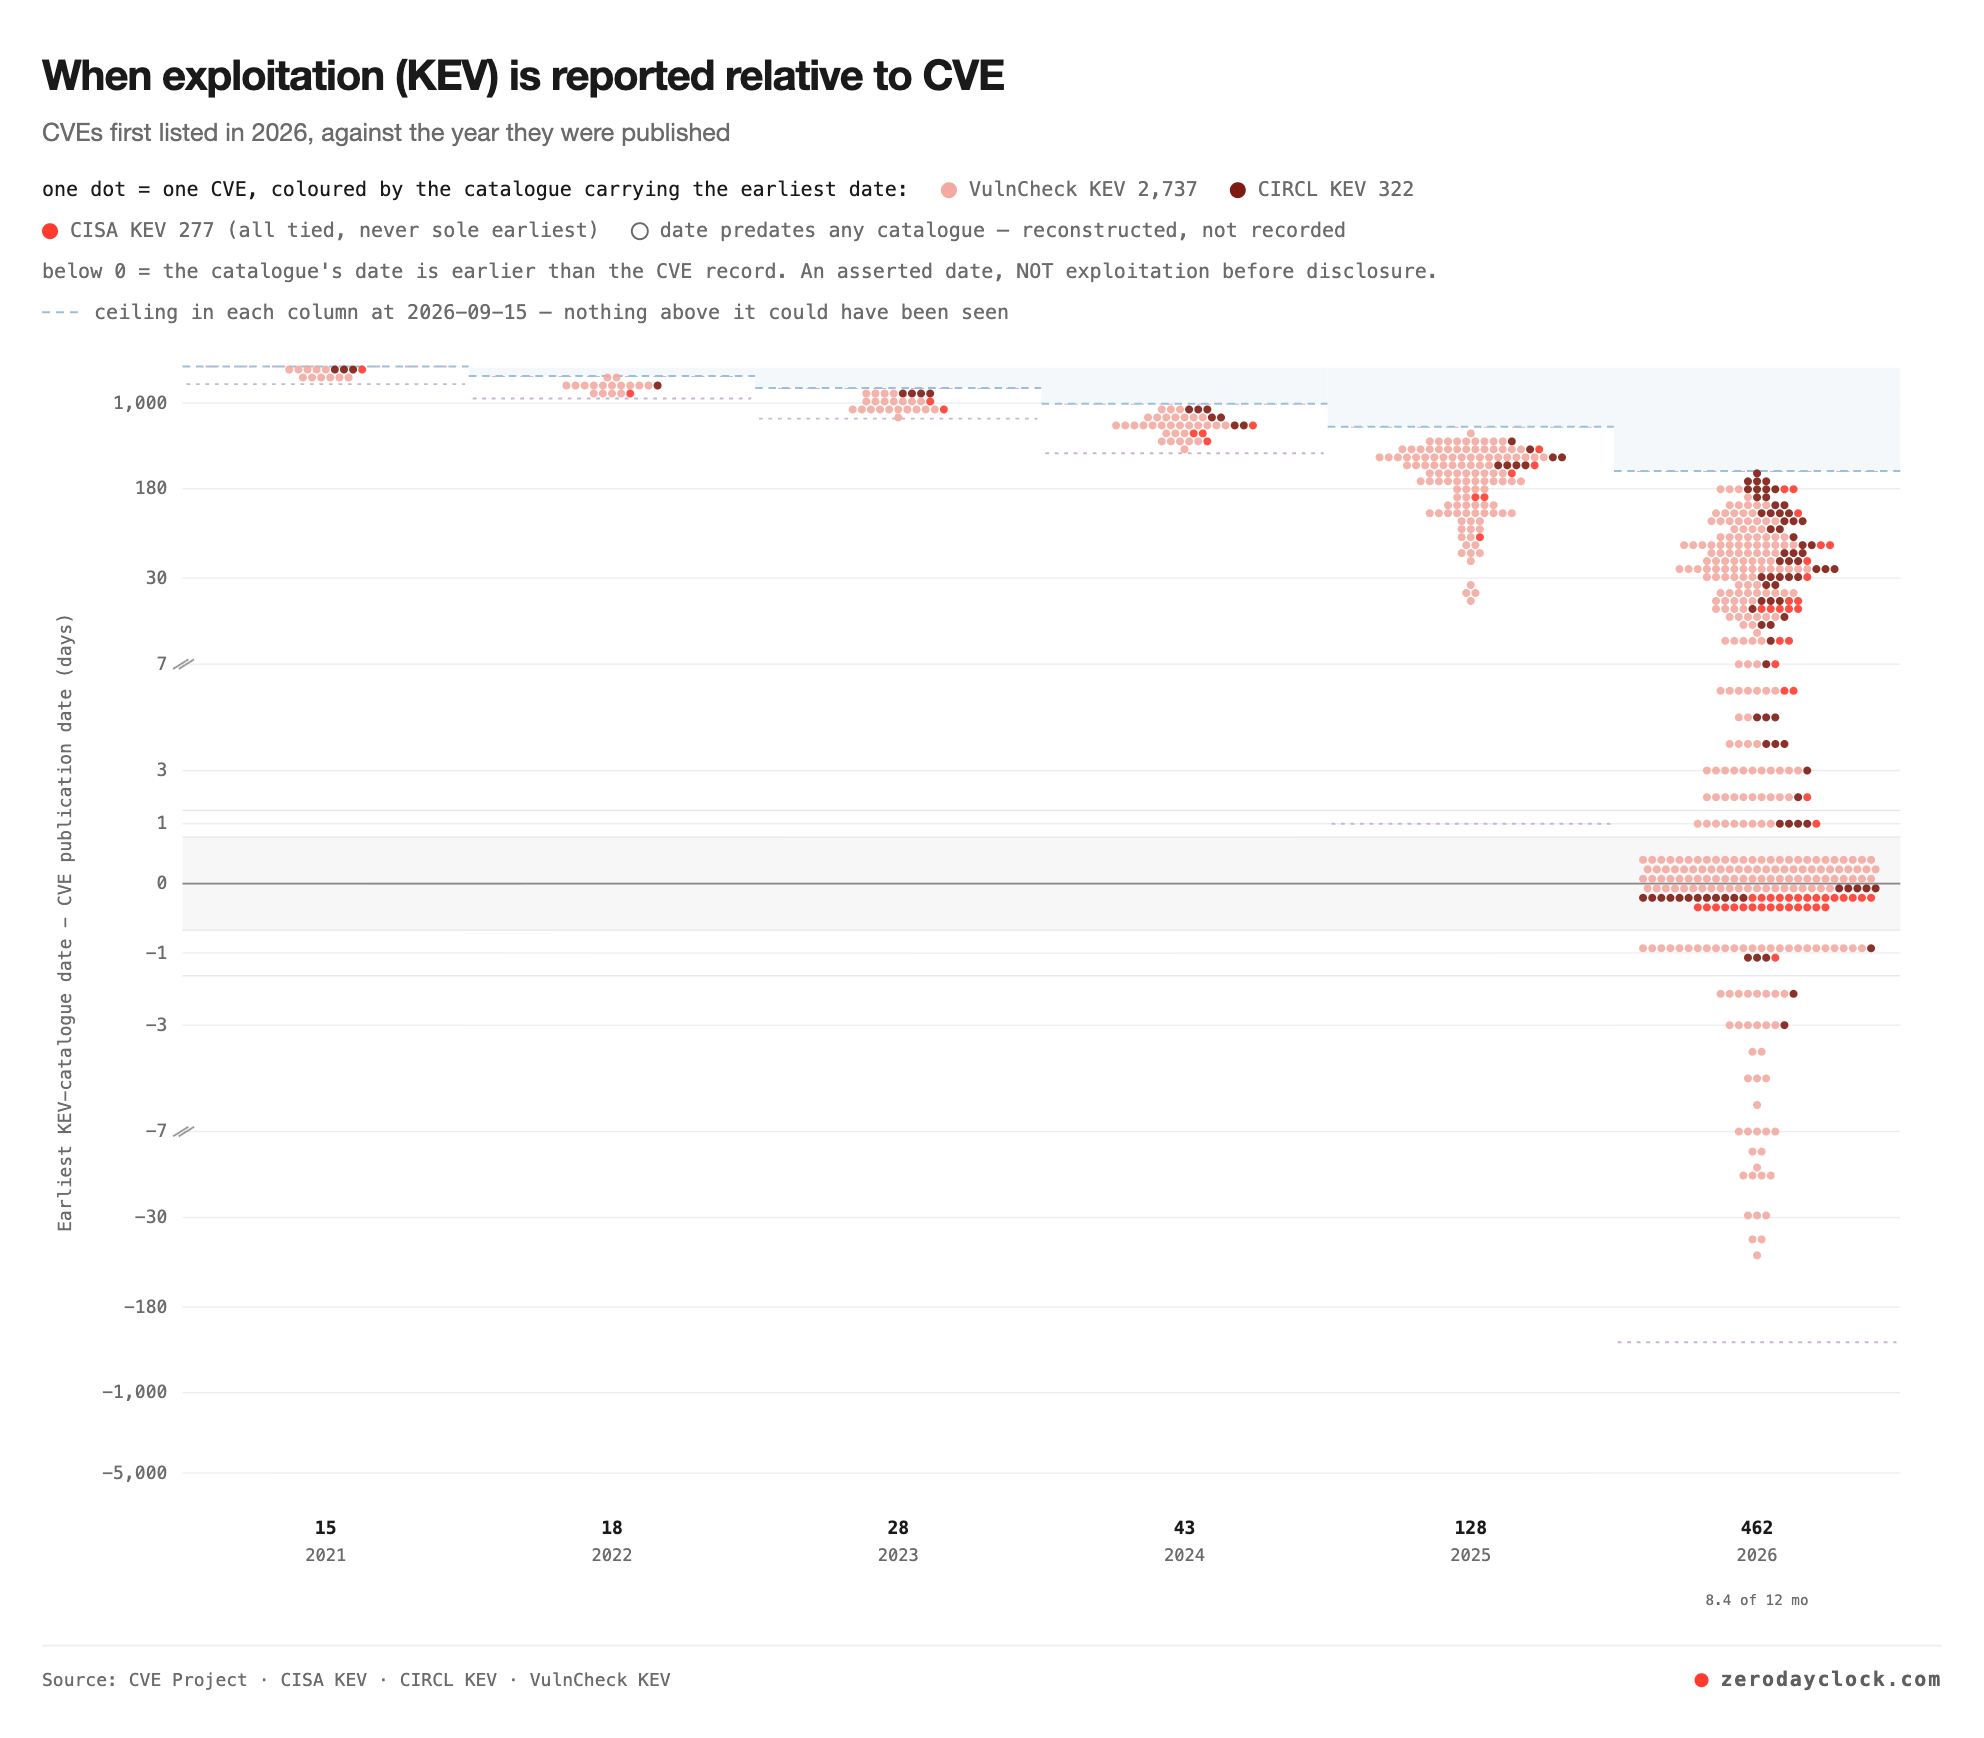
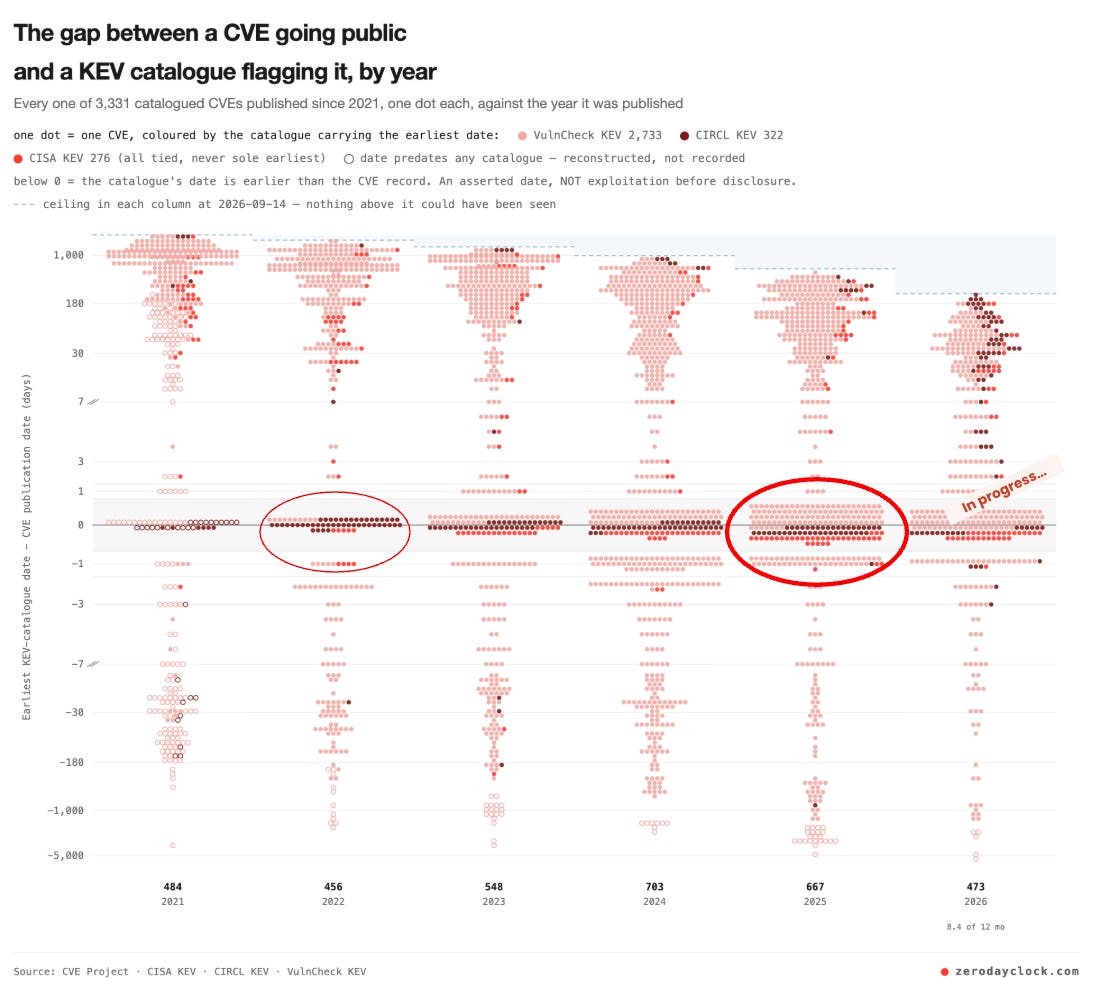
In the ZeroDayClock data, we see recorded KEV dates clustering around CVE publication, often within a day on either side. We can measure that clustering, but the dates alone cannot explain its causes, with several possible factors contributing:
More exploitation of Zero Day vulnerabilities. An increase in vulnerabilities being exploited e.g. due to AI.
More coordinated disclosure. Vulnerability disclosure and confirmation of exploitation may be released together, bringing CVE publication and the recorded KEV date closer together. This can happen with vulnerabilities exploited before a fix existed, as well as vulnerabilities patched before their security implications were publicly disclosed.
Broader and earlier reporting. Sources such as VulnCheck expand the set of known exploited vulnerabilities and can record public exploitation evidence earlier than CISA’s catalogue admission date. Changing that coverage can change the measured TTE even without a change in attacker behavior.
As more dates cluster around disclosure, a metric measured in whole days also loses the detail needed to distinguish events happening hours apart. This is the saturation problem: the curve becomes less informative about timing differences within that cluster.
Why AI could push measured TTE upwards
The second effect is the long tail of vulnerabilities that could become attractive to attackers as exploit development becomes cheaper. Older vulnerabilities and less widely used software may become worth targeting when the work required falls, expanding the range of weaknesses defenders need to address.
Anthropic’s research on n-day exploitation demonstrates that models can automate exploit development in controlled tests, supporting the possibility of lower development costs. How widely attackers are applying those capabilities, and how much they expand exploitation of older vulnerabilities, remain separate questions.
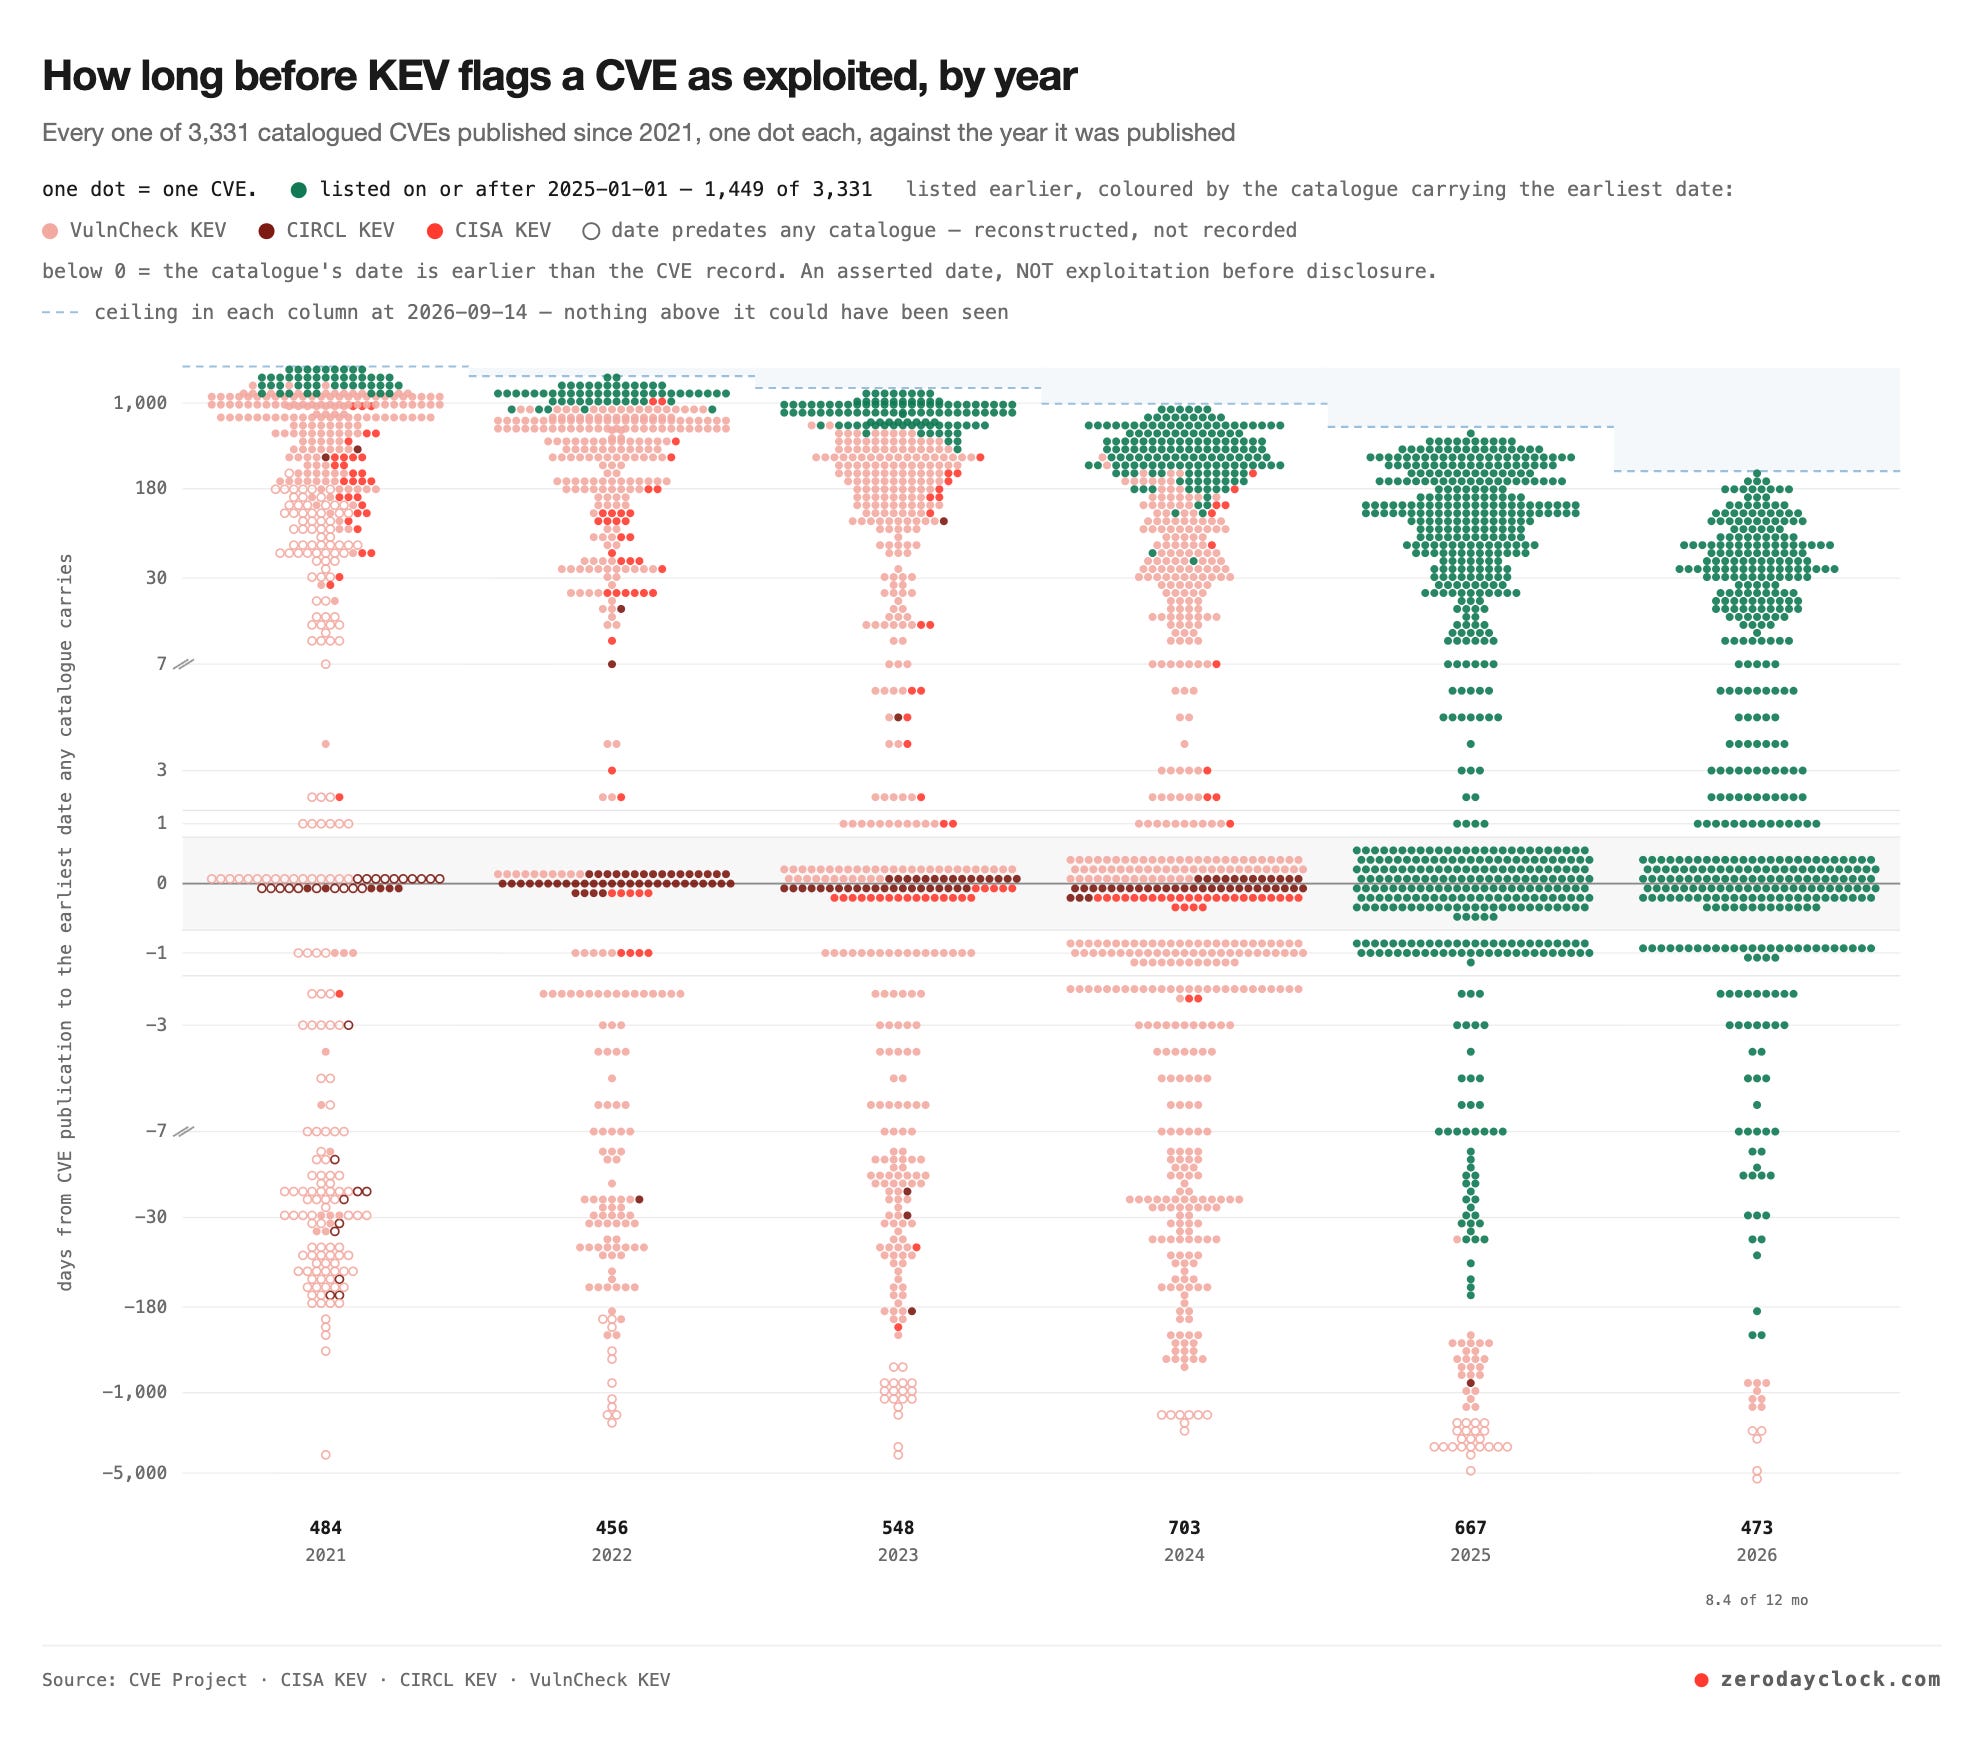
Consequently, a longer measured interval could reflect attackers reaching further into the backlog of old vulnerabilities, which would be a very different development from defenders becoming safer or attackers needing more time to build an exploit.
This is a hypothesis to test as the data develops, including whether our sources can observe a wider range of exploitation spread across smaller campaigns and less visible systems which will be invisible to KEVs. ZeroDayClock needs several measures to distinguish changes in reporting, exploitation speed and the range of vulnerabilities attackers target, because each has different consequences for defenders.
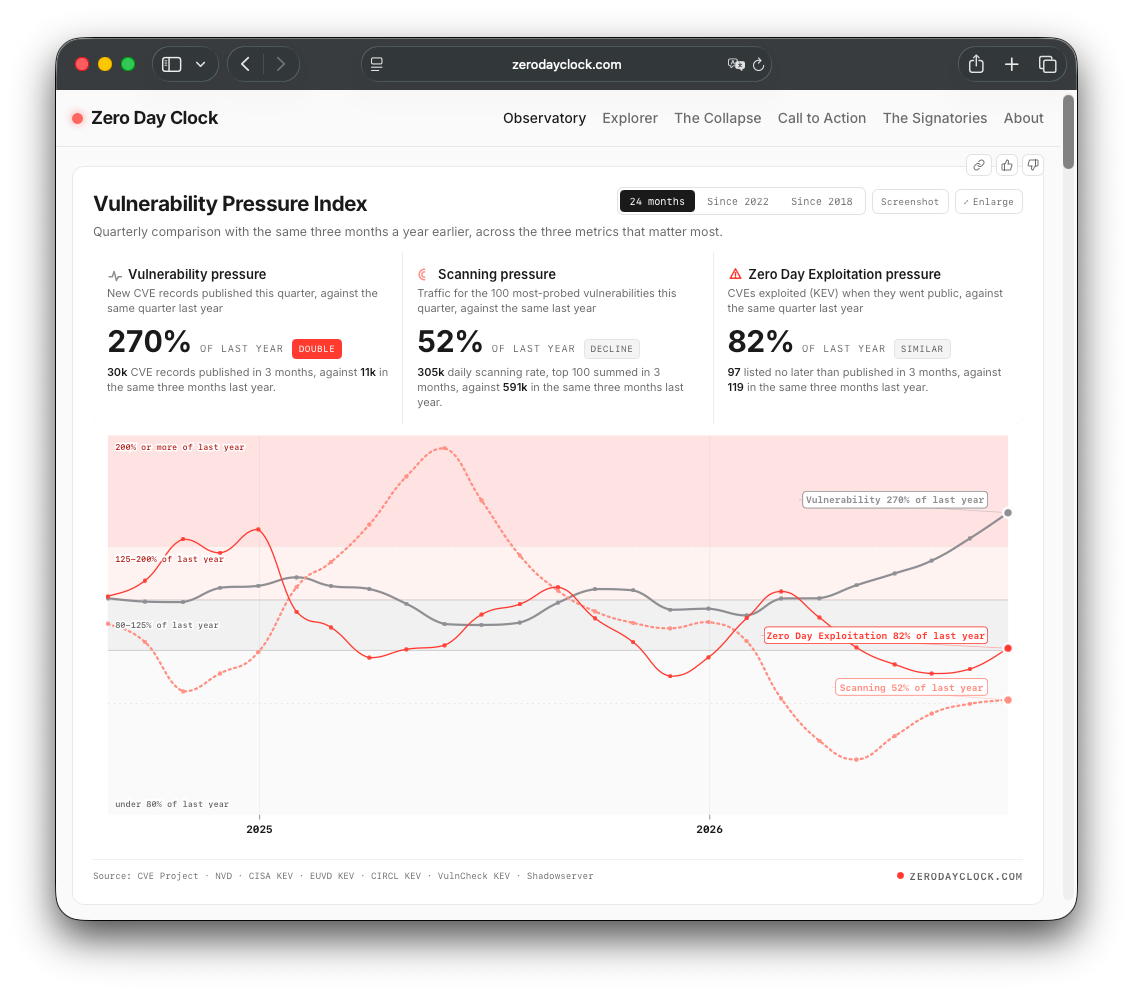
Time-To-Exploit helped bring response speed into the conversation, but the next step for ZeroDayClock is to make that conversation more useful as the evidence changes. The relaunched ZeroDayClock brings together published vulnerabilities, records of known exploitation and observed scanning activity (from Shadowserver as the largest honeypot network in the world) to help us understand several aspects of the pressure defenders are facing, without presenting those indicators as a direct measurement of an individual organization’s risk.
Cataloged exploitation in KEVs is only a fraction of real exploitation. A great deal more is happening in the wild that nobody had time to document, or that was never considered critical enough to document.
In most cases exploitation began days, weeks or months before the catalogue entry. CISA does not backdate exploitation, VulnCheck does.
We do not have reliable patch release dates, so we cannot confirm with full accuracy whether exploitation in the wild began before a fix existed. We define a ZeroDay KEV as a KEV reported on or before the day of CVE publication. In some circumstances, (e.g. silent patching) a patch could be available before CVE publication.
Better visibility e.g. more CNAs and KEV registrars will artificially increase growth.
Scanning can come from attackers or from security researchers, and we cannot always tell them apart.
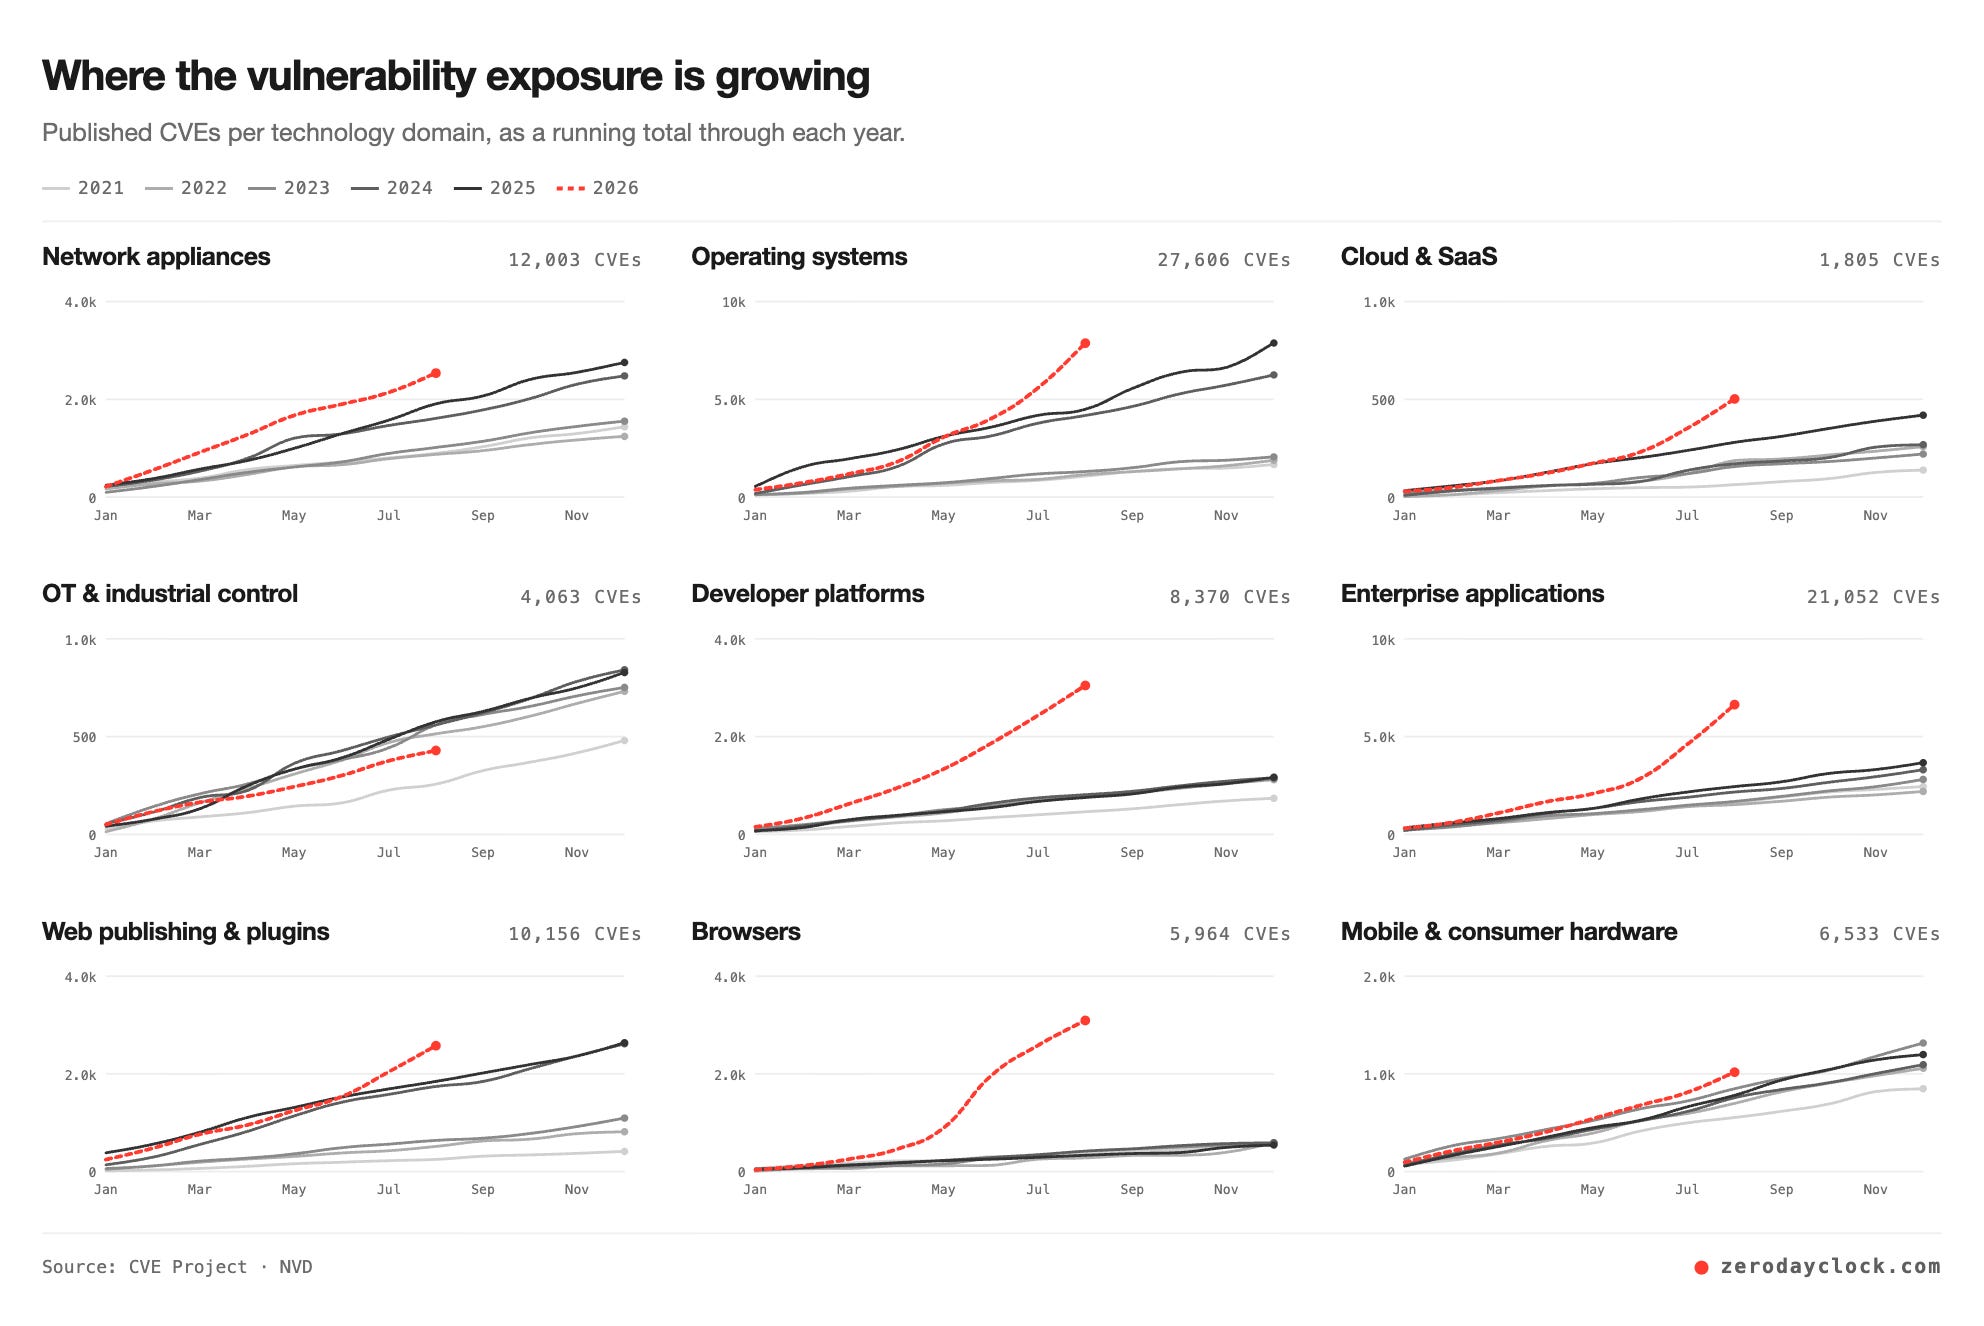
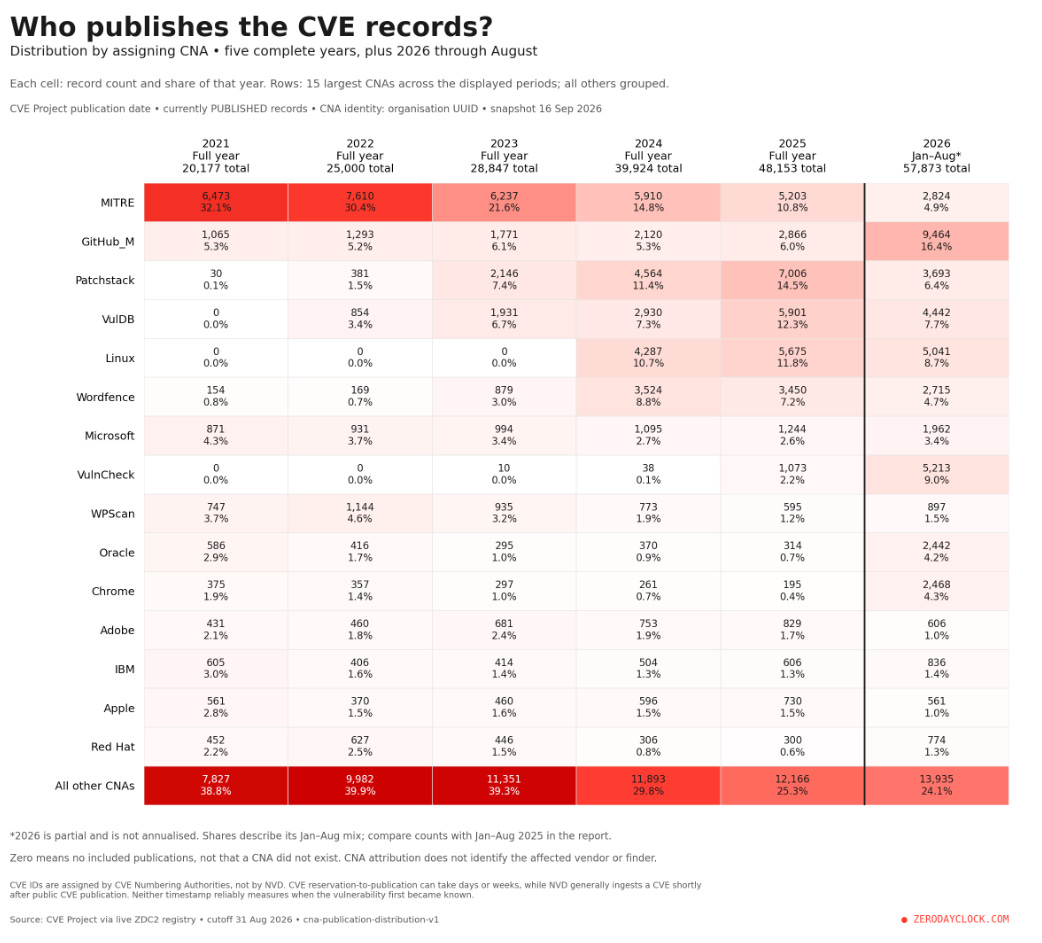
Is the number of cataloged vulnerabilities growing? Yes, at 270 percent of last year, 29k against 11k, though sixteen CNAs account for 86 percent of that rise. The biggest growth this year in vulnerabilities is in open source projects for web applications, community platforms, media libraries, remote-desktop software, AI interfaces and agent tools, automation and clinical/education applications.
Is cataloged exploitation growing? Yes. It grew at a steady pace across the last two years and the first half of 2026 is running slightly ahead, at 485 first listings against 436 in the same half of 2025.
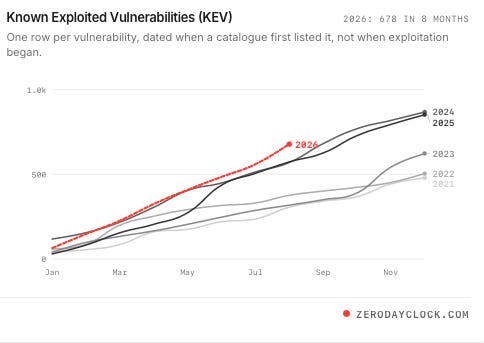
Is real exploitation and attack growing? We don’t have proper instrument to see it. KEVs typically record only observed mass exploitation of CVEs.
Is emergency work (ZeroDay KEVs) for CISOs growing? Doubling in two years and then holding. The Pressure Index reads 82 % of last year for the quarter to August (97 against 119). Annually it doubled between 2022 and 2024, from 166 to 363
Are vulnerabilities exploited and attacked earlier? We cannot measure it systematically. Cataloging exploitation in KEV is delayed, incomplete and not accurate. However, see those documented examples of accelerated exploitation:
Do I need to patch KEV exploited vulnerabilities immediately? No. Even if a vulnerability is being catalogud as being exploited (KEV), typically only 2 to 5 percent of those vulnerabilities are reachable in your network and on code level.
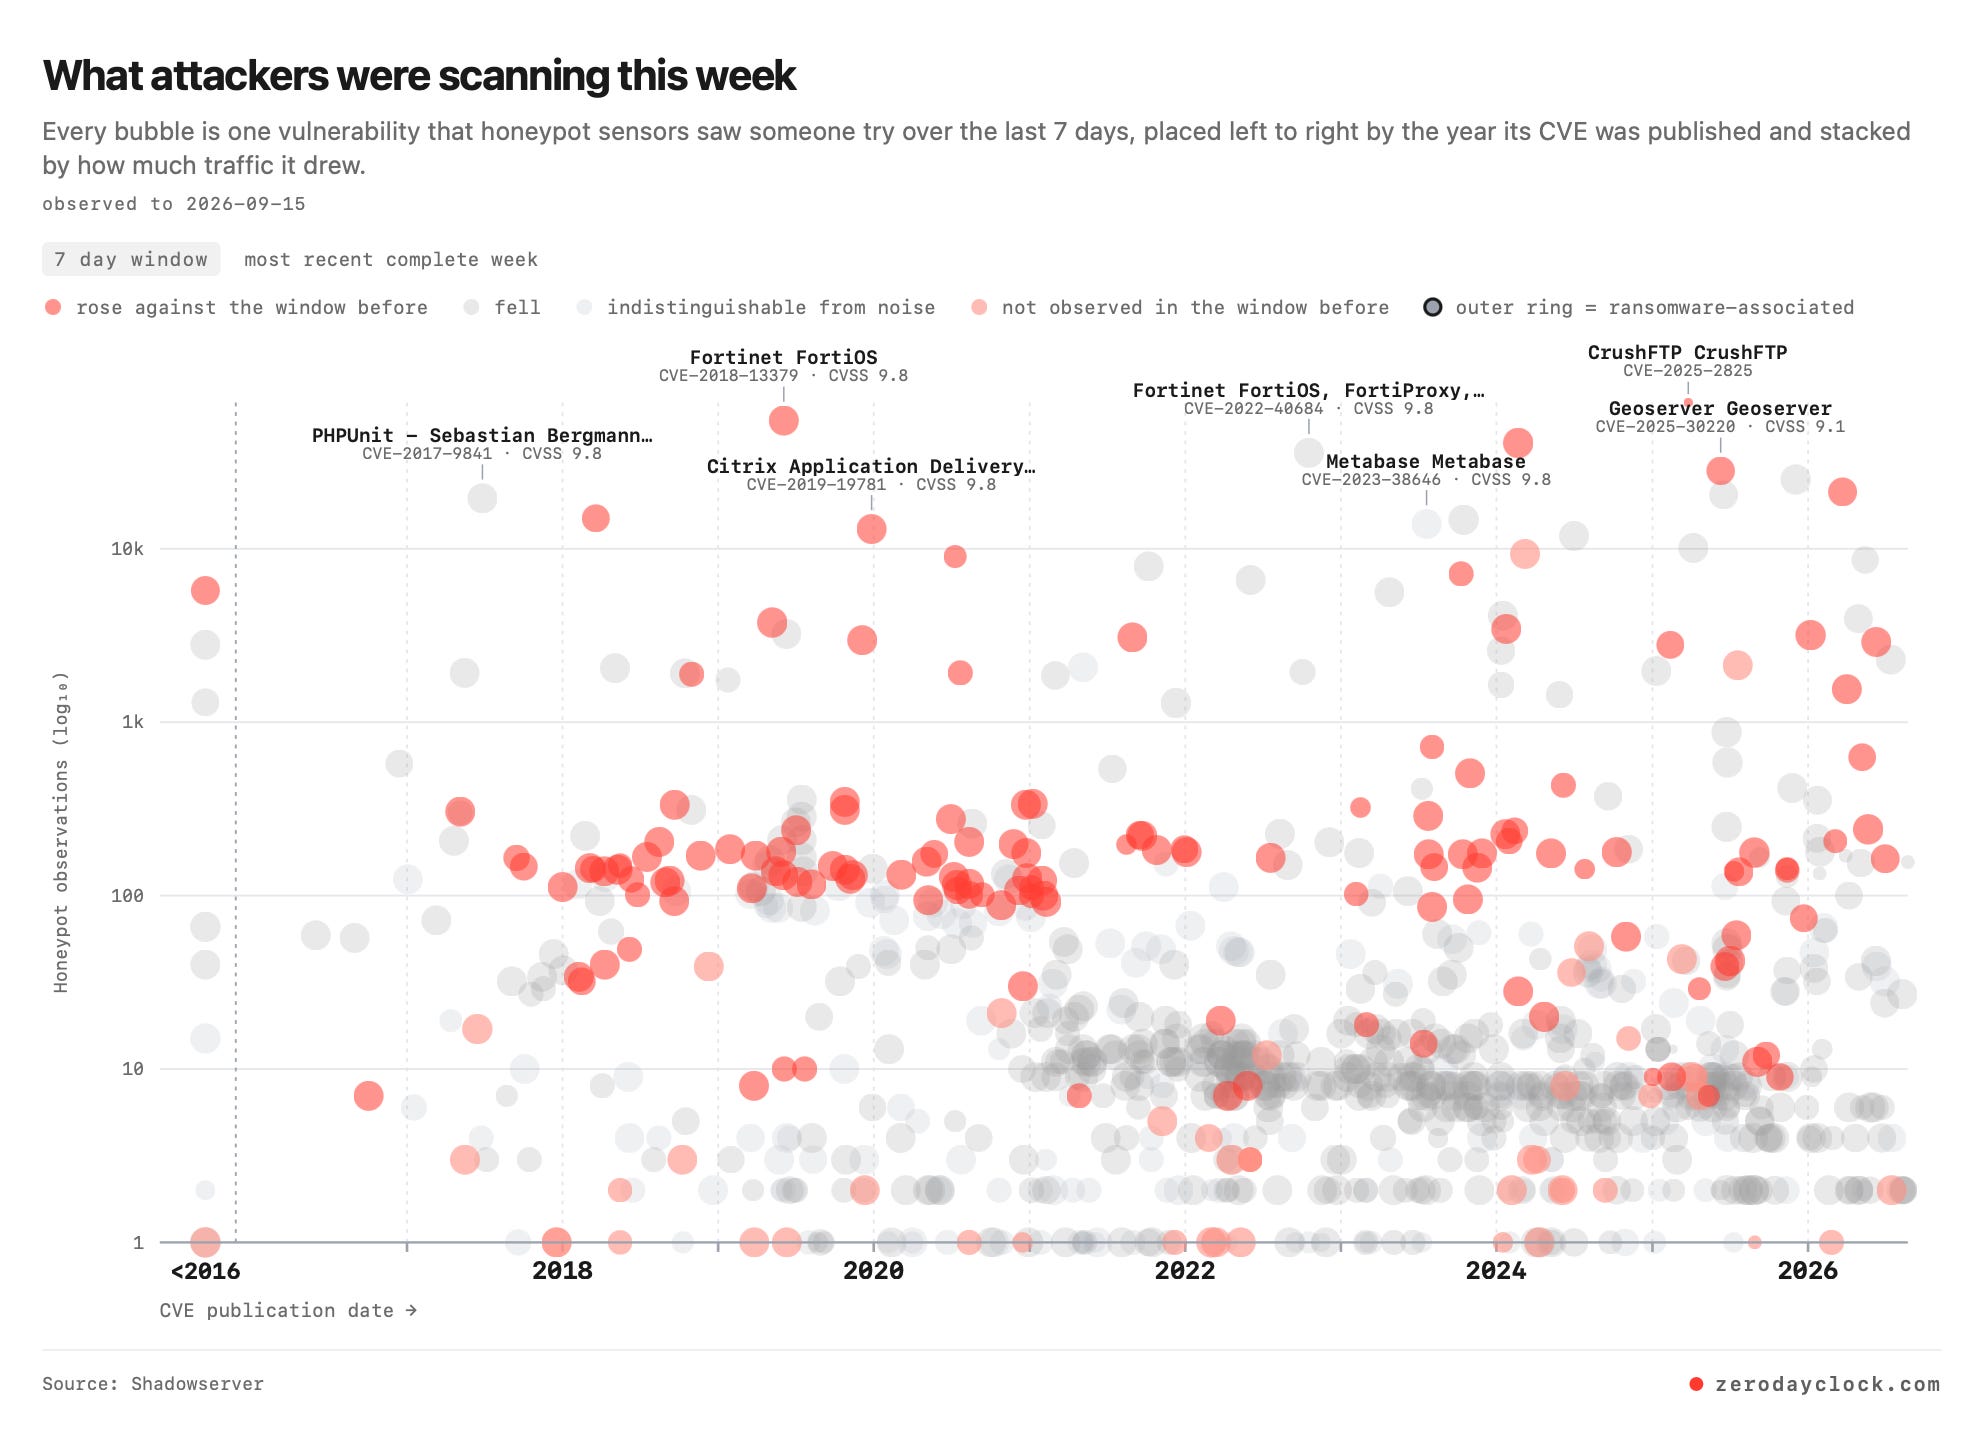
Which CVEs are being scanned most? It changes every week, but more than 80% of vulnerabilities being scanned are older than 1 year.
The only criticism of the relaunch came from Root Evidence’s Vulnpocalypse Report, published the day before the updated ZeroDayClock went live, although the rebuild had already been in preparation for several weeks. The report challenges ZeroDayClock’s TTE chart affected by aging, tells readers to set its findings aside and presents its own approach as the correct way to measure exploitation. The startup which sells vulnerability intelligence promoted those conclusions through a press release and CEO commentary, alongside a commercial proposition built around exploitation and financial loss.
There has also been some sharp language from Roots Evidence’s CTO on LinkedIn about parts of this industry selling lies in order to move product. I am setting all of that aside and testing only the claims and proposals in the report. Spoiler: None of the three hold up under the report's own method.
Let me be precise about what testing means here, because it is not reading the report and disagreeing with it. For each claim I rebuilt the measurement from the primary sources, using the report’s own declared method wherever the report declared one, and where it did not declare one I built every reasonable version I could think of and checked whether any of them landed on the published figure.
First, Root Evidence heavily criticizes the selection/aging problem in ZDC’s Time-To-Exploit metric. We have discussed the implication in the first paragraph.
Instead, they propose a “defender window”, which measures the days from a patch being released to exploitation being first recorded.
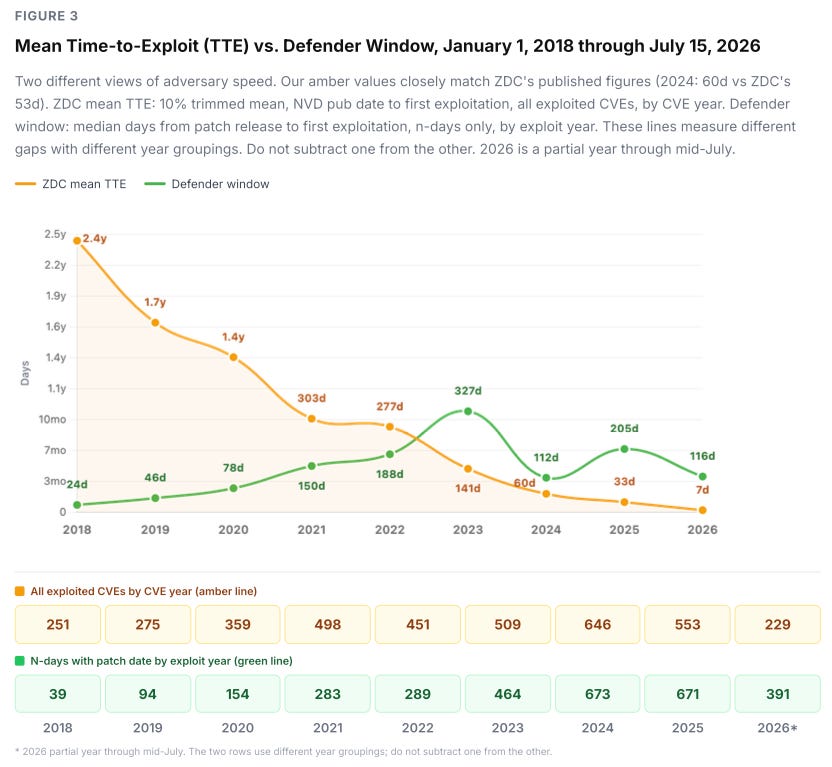
However, it excludes CVE IDs from before 2018, and it groups its annual results by the year in which exploitation was recorded.
This CVE ID year governs only which CVEs enter the 2018+ analysis cohort. The year by year charts in both reports group CVEs by the year of first confirmed exploitation, so per year chart totals can differ from CVE ID year counts.
- Root Evidence, Vulnpocalypse Report
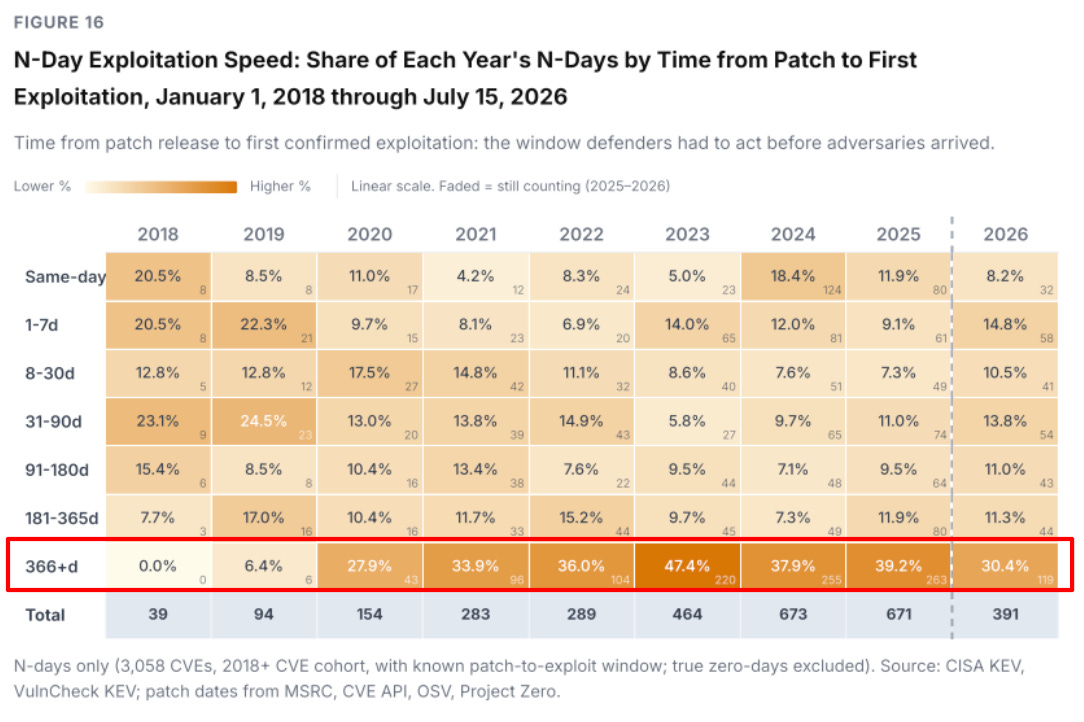
Those two choices together create exactly the effect Root Evidence criticizes. Because the population starts in 2018 and the results are grouped by the year of the attack, the largest gap that 2018 can physically record is 364 days, while 2026 can record more than 3,100 days.
Root Evidence measures its defender patch window with a ruler that gets a year longer every year
You can see the effect directly in their own table. The row for gaps longer than a year reads zero percent for 2018, and the report describes this as adversaries never having taken more than a year in that period. It is not a fact about adversaries, because a gap longer than a year was not an available outcome for that cohort. I have plotted the same effect using my own data, drawn from the same sources Root Evidence used:
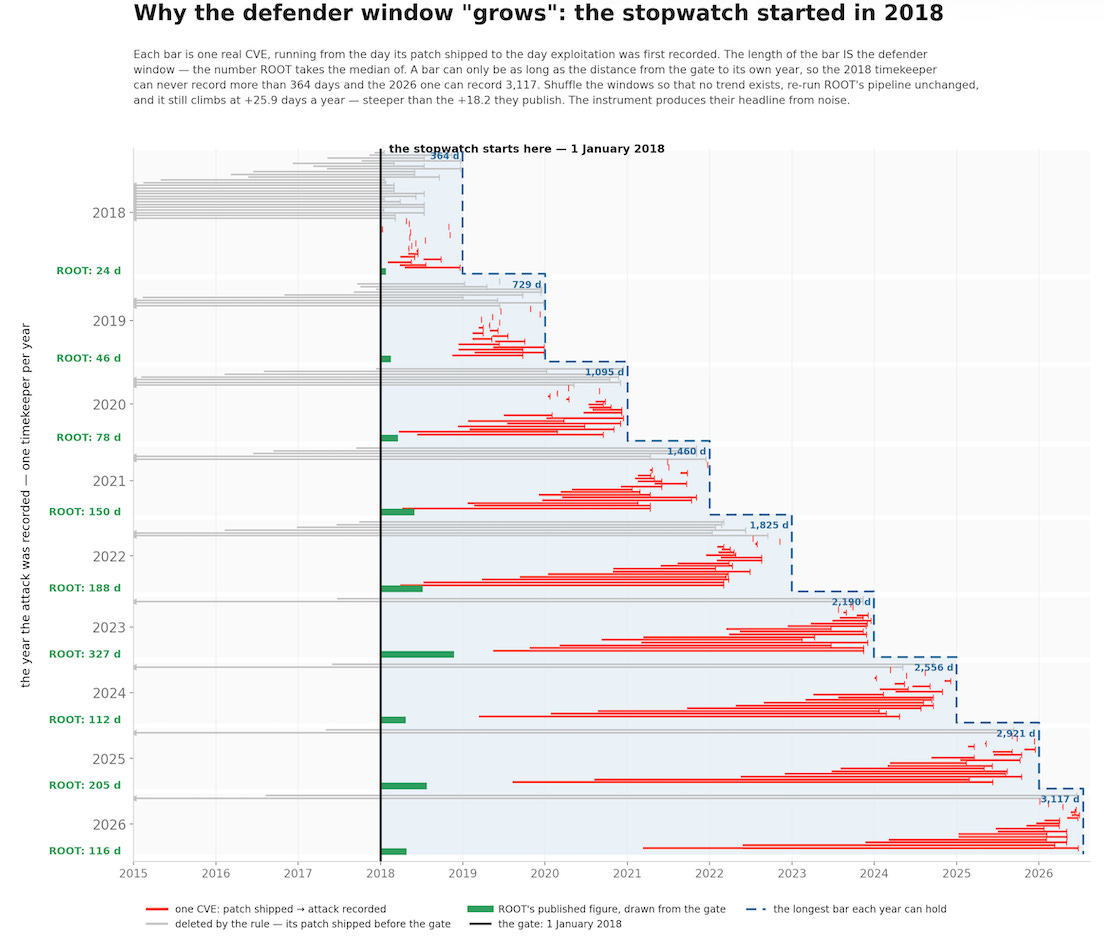
I am not claiming the people who built this did anything dishonest, because right truncation is genuinely easy to introduce, in the same way it appeared in TTE. What I would say is that a report which makes selection bias its central criticism has a particular obligation to check its own replacement for the same defect.

Root Evidence makes patch release dates the foundation of both its zero day classification and its defender window.
“For every exploited CVE in the dataset, we checked whether a fix existed at the moment exploitation was first confirmed..”
Vulnpocalypse Report - Root Evidence
The source table on page 47 tells a different story, because roughly two thirds of the classified records take their patch date from the MITRE CVE API, using the earlier of datePublic and datePublished as a proxy.
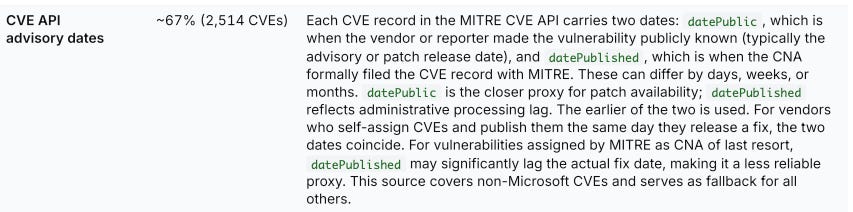
In my own analysis, datePublic is missing for somewhere between 70 - 84 percent of the exploited population in every year since 2019, and where it is missing the rule falls back to datePublished, the CVE record publication date with ZDC uses as well.
That is the part worth sitting with. For most of its own dataset, the report’s patch date is the CVE publication clock that it criticizes ZeroDayClock for using.
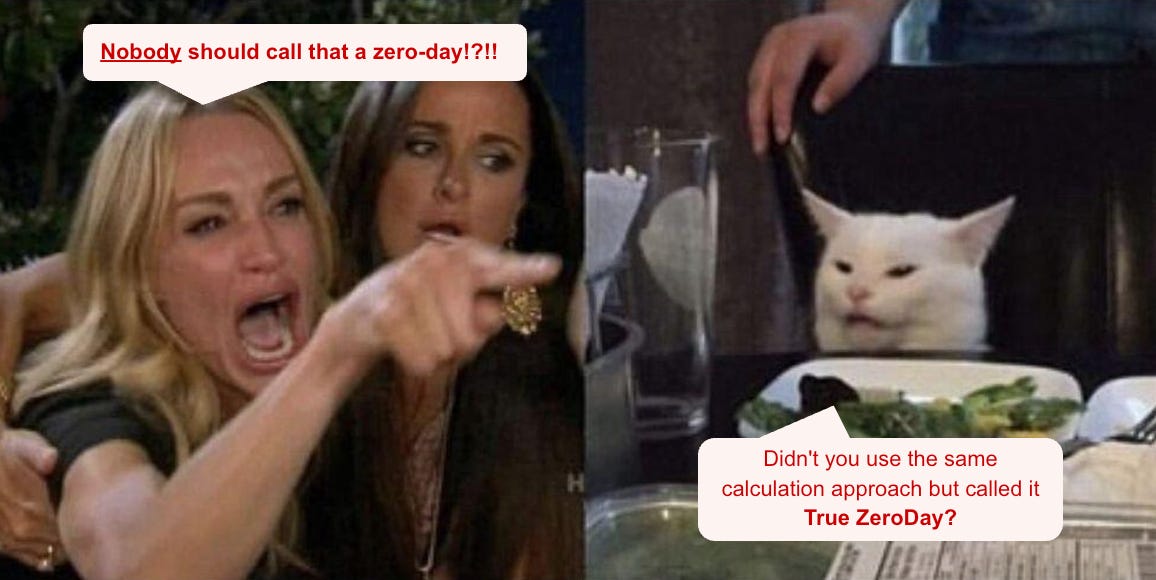
“So under ZDC’s method, a vulnerability an adversary exploited three days after the patch ships still counts as a zero-day...”.
”Our take: Nobody should call that a zero-day.”
Vulnpocalypse Report - Root Evidence
This is a fair definitional preference and I do not object to it in principle. What I would point out is that the alternative they offer rests on the same kind of proxy. If two thirds of the patch dates behind “true zero days” are disclosure and publication dates, then the new definition is measuring a version of the thing it rejects, and it deserves the same scepticism.
The distinction matters also because the two metrics make different claims. ZeroDayClock’s “ZeroDay KEV” category flags vulnerabilities catalogued as exploited on or before CVE publication. For an affected organization, that can create urgent work whether a patch is already available or still missing. Root Evidence’s “defender window,” however, depends on establishing when defenders actually had access to a fix. And disclosure and patch availability can diverge in several ways:
Active exploitation may be disclosed before a patch is available.
Researchers may publish findings before the vendor releases a fix.
Unsupported products may receive a CVE without ever receiving a patch.
Vendors may release patches before publishing the corresponding advisory or CVE.
Using disclosure dates as patch dates can therefore overstate or understate the measured window. It cannot, by itself, establish whether a fix existed when exploitation began.
For what it is worth, ZeroDayClock has never claimed to measure whether a patch existed before exploitation, because I have not found a reliable way to obtain patch dates at scale, and I would rather say so than substitute a field that looks close enough. What we can measure more reliably is the workload a CISO is handed, and a vulnerability catalogud as exploited on the same day its CVE appears, or earlier, means emergency work that nobody planned for, whether or not a fix happens to exist somewhere.
Another critique worth to mentioned from this fifty page report was about NVD:
NVD indexes and enriches CVE records after publication, and lately it has averaged 25 days behind the vendor’s patch... ZeroDayClock measures how quickly NVD publishes records, and when NVD slows down, ZeroDayClock reports that adversaries sped up.
Vulnpocalypse Report
This one is straightforward to check, and it does not hold.
The first version of ZeroDayClock did use NVD publication dates, and NVD did have a well known backlog, but that backlog was in enrichment, meaning CPE strings and CVSS vectors, and not in publication.
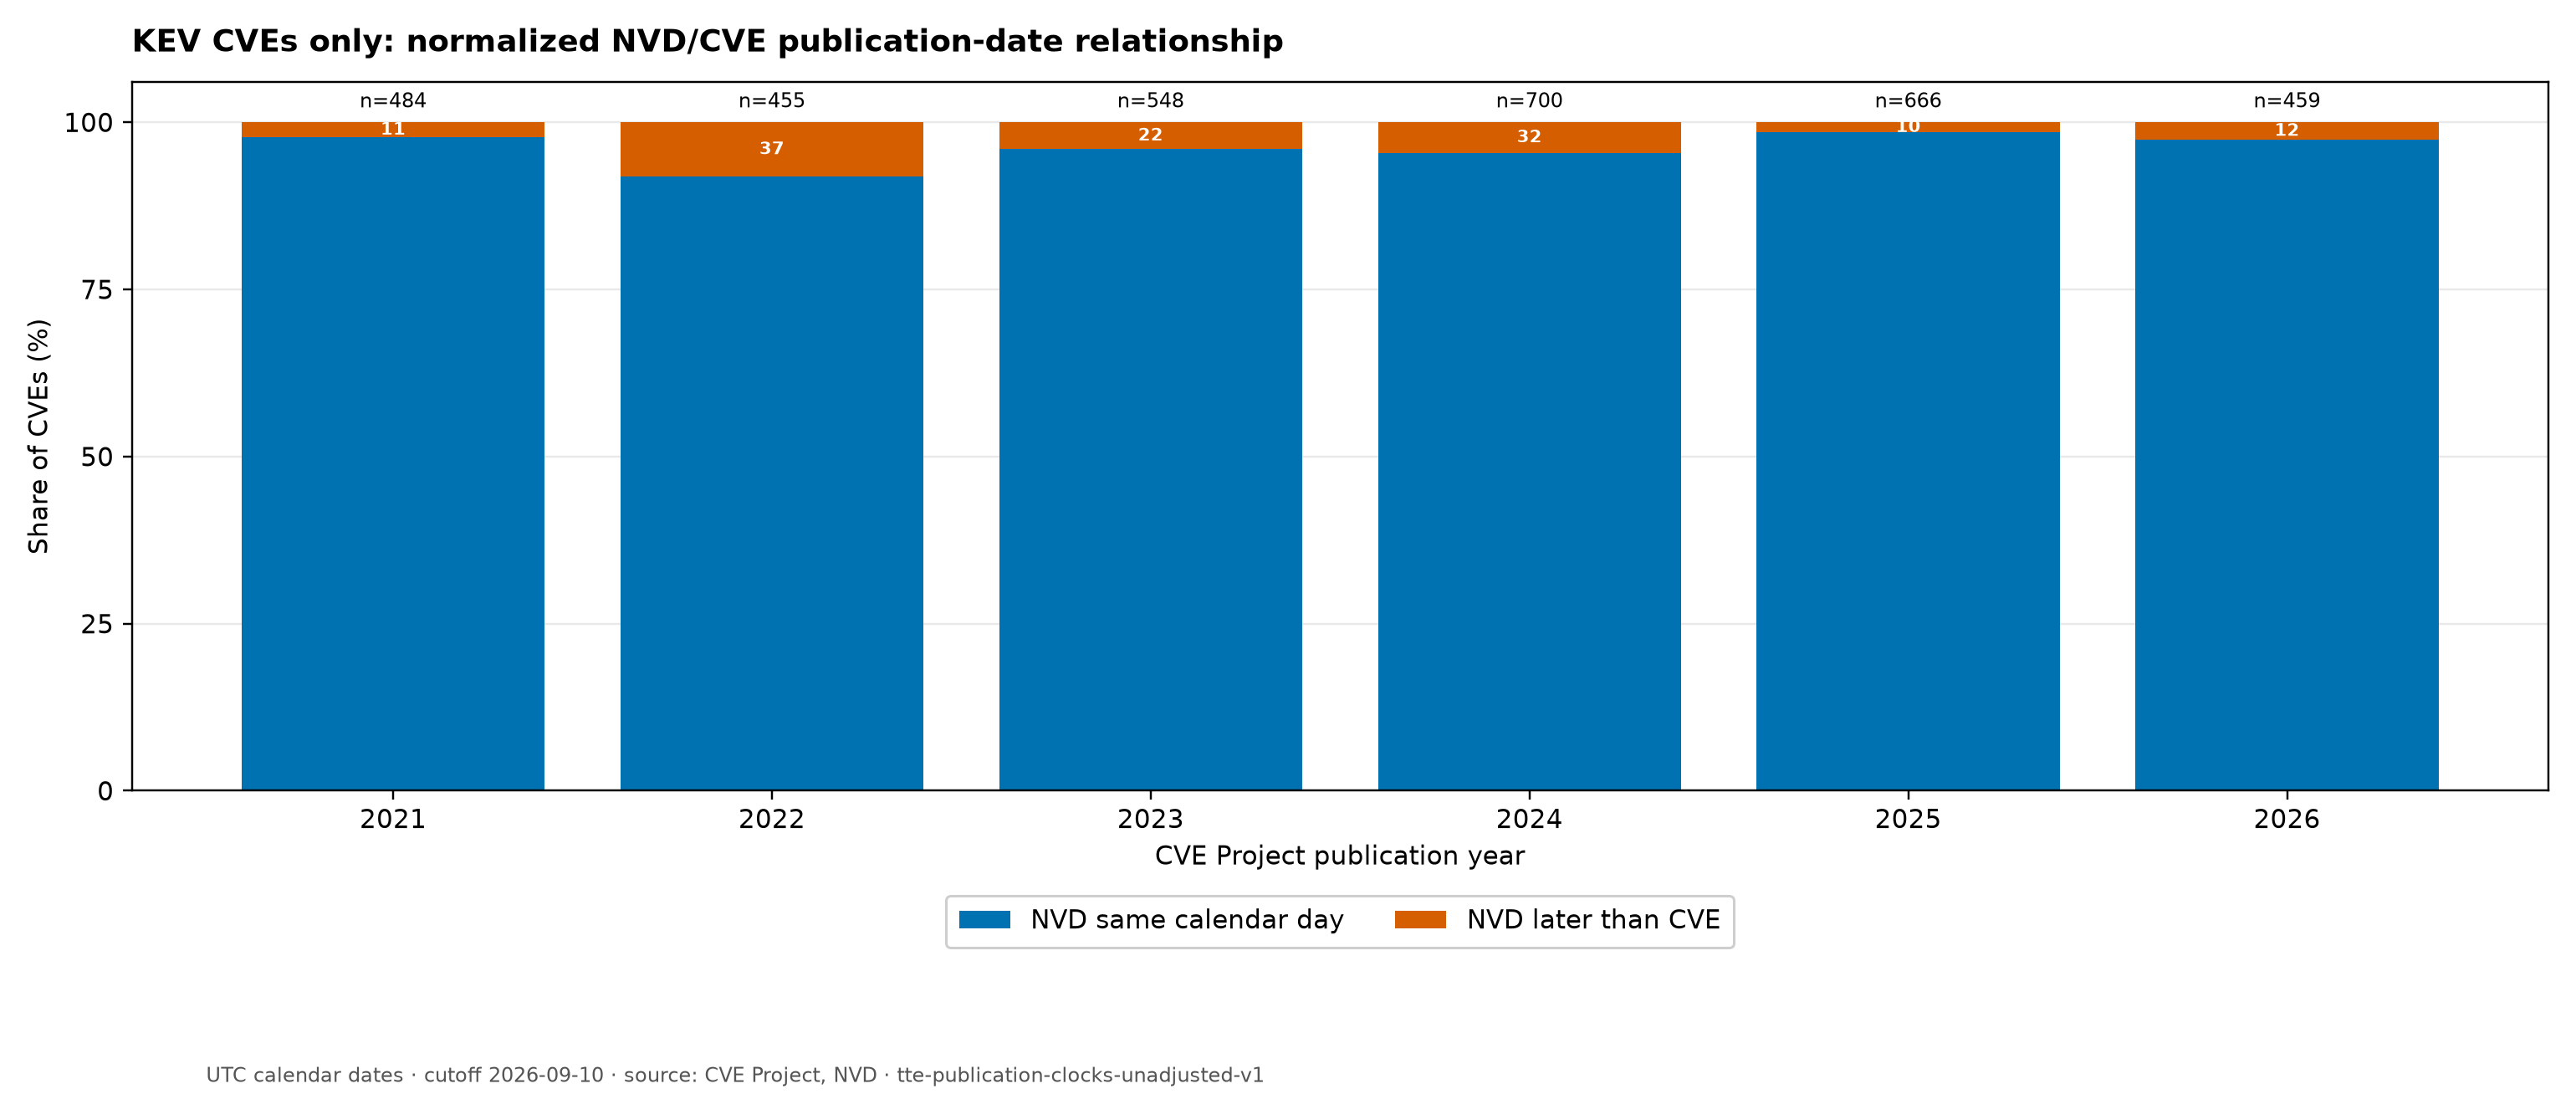
I went further and re-run the TTE test based on CVE publication date. On over three thousands exploited CVEs (Old ZDC count), it reclassifies one (due to publication day). If NVD’s queue were manufacturing zero-days, moving off NVD would fix it. It changed nothing.
This is the claim I would most like to see corrected, because it is the one that does the most work in the report and it is the easiest of all of them to test. Any vulnerability prioritization company can run it against the NVD API in about five minutes.
My worry is not really the number. It is what a number like this does once it lands on a slide. A window that looks generous reads as permission to slow down, and 116 days until somebody recorded an attack does not mean defenders had 116 days before the attack.
A window is not a warning.
Think about a fuel gauge. A broken gauge is far more dangerous than no gauge at all, because a pilot who knows it is broken lands early, and a pilot who trusts it keeps flying. Not knowing is survivable. Being wrongly reassured is not.
That is why our industry is often associated with selling snake oil. Not from publishing uncertain numbers, which is fine as long as you say so, but from turning them into claims that something is safer. Nobody buys a gauge that reads unknown, so the whole market pulls us toward promising safety, when almost nothing in security can be shown to be safer in a way that holds up afterwards. The useful thing to publish is not a promise about the risk you took away. It is a plain description of the risk you are still carrying, and a decision to accept it.
We sell safety because nobody buys uncertainty.
For me there are multiple reasons why a defender patch window cannot carry the weight being put on it.
Catalogue dates arrive after the attack. Somebody has to see the exploitation and write it down, so delay in reporting ends up looking like time for defenders.
Disclosure dates are not patch dates. Two thirds of the records take the patch date from publication fields, and a publication date cannot tell you a fix existed.
A missing entry is not proof of nothing happening. Catalogues only see what their sources see, and CISA also requires a CVE and clear remediation guidance before anything goes in. Finding three submarines with five sensors does not mean there are three submarines.
So if you are a CISO holding a chart like this, the safest way to read it is as the most time you could ever have had, not the time you will get. And when you write it down for your board, write down what you are carrying rather than what you have removed.
I am optimistic about AI’s potential to strengthen cybersecurity in the long term, particularly our ability to find and fix vulnerabilities at scale. Phil Venables makes a strong case for that optimism, alongside the need to prepare for a difficult transition.
Imagination and scenario planning are among our strongest assets in navigating that transition. Jen Easterly’s warning about a failure of imagination captures why we need to test our assumptions about what attackers could do next, without treating every possible scenario as an inevitable outcome. Assuming things will continue as they always have, even when that has been true so far, is dangerous in our domain.
As CISOs, we should be testing whether our defenses hold when exploitation becomes cheaper, faster or more widespread, and deciding which changes to make before those scenarios become our incident reports.
ZeroDayClock is evolving into a more dynamic observatory to support that work, connecting evidence of what is changing with the questions defenders need to answer. I invite researchers, defenders, security companies and Root Evidence to contribute through public, reproducible comparisons using shared CVEs, traceable dates and clear treatment of uncertainty.
Explore the updated ZeroDayClock, challenge an assumption, contribute evidence or tell us which decision you need it to support.
Measure what is changing, and prepare for what comes next.