

惯性聚合 高效追踪和阅读你感兴趣的博客、新闻、科技资讯
阅读原文 在惯性聚合中打开

推荐订阅源

IT之家
IT之家
OSCHINA 社区最新新闻
OSCHINA 社区最新新闻
A
About on SuperTechFans
博客园 - 聂微东
奇客Solidot–传递最新科技情报
奇客Solidot–传递最新科技情报
freeCodeCamp Programming Tutorials: Python, JavaScript, Git & More
B
Blog RSS Feed
U
Unit 42
Stack Overflow Blog
Stack Overflow Blog
Recent Announcements
雷峰网
雷峰网
罗磊的独立博客
Microsoft Security Blog
Hugging Face - Blog
Hugging Face - Blog
L
LangChain Blog
人人都是产品经理
人人都是产品经理
The GitHub Blog
The GitHub Blog
F
Fortinet All Blogs
Cyber Security Advisories - MS-ISAC
H
Help Net Security
P
Proofpoint News Feed
The Cloudflare Blog
D
Docker
大猫的无限游戏
大猫的无限游戏

Utopia

Fluid responsive typography: easy when you know how Utopian project kickstarter: designing a fluid responsive website in a static tool like Figma Generate all pair permutations in Utopia SCSS Figma plugin and kickstarter V2 Readable clamp() with PostCSS Utopia Utopia SCSS library Clamp calculator Utopia Fluid Type + Space Calculator now supports Figma variables Designing a Utopian layout grid: Working with fluid responsive values in a static design tool. Getting started with Utopia Figma Plugins A video introduction to Utopia Painting with a fluid space palette Designing with a fluid space palette Clamp Utopian CSS generator, an iteration Dealing with negativity in fluid type scales Fluid custom properties CSS-only fluid modular type scales Designing with fluid type scales
Type scale graphs
dev@clearlef · 2024-11-26 · via Utopia

Communicating the power and simplicity of fluid typographic scales to Utopia newcomers continues to be a focus for us.

The concepts of fluid modular scales and their systematic benefits can be tricky to articulate. When we first began sharing the concepts of Utopia – long before this website existed – there was one image that reliably got the penny to drop:
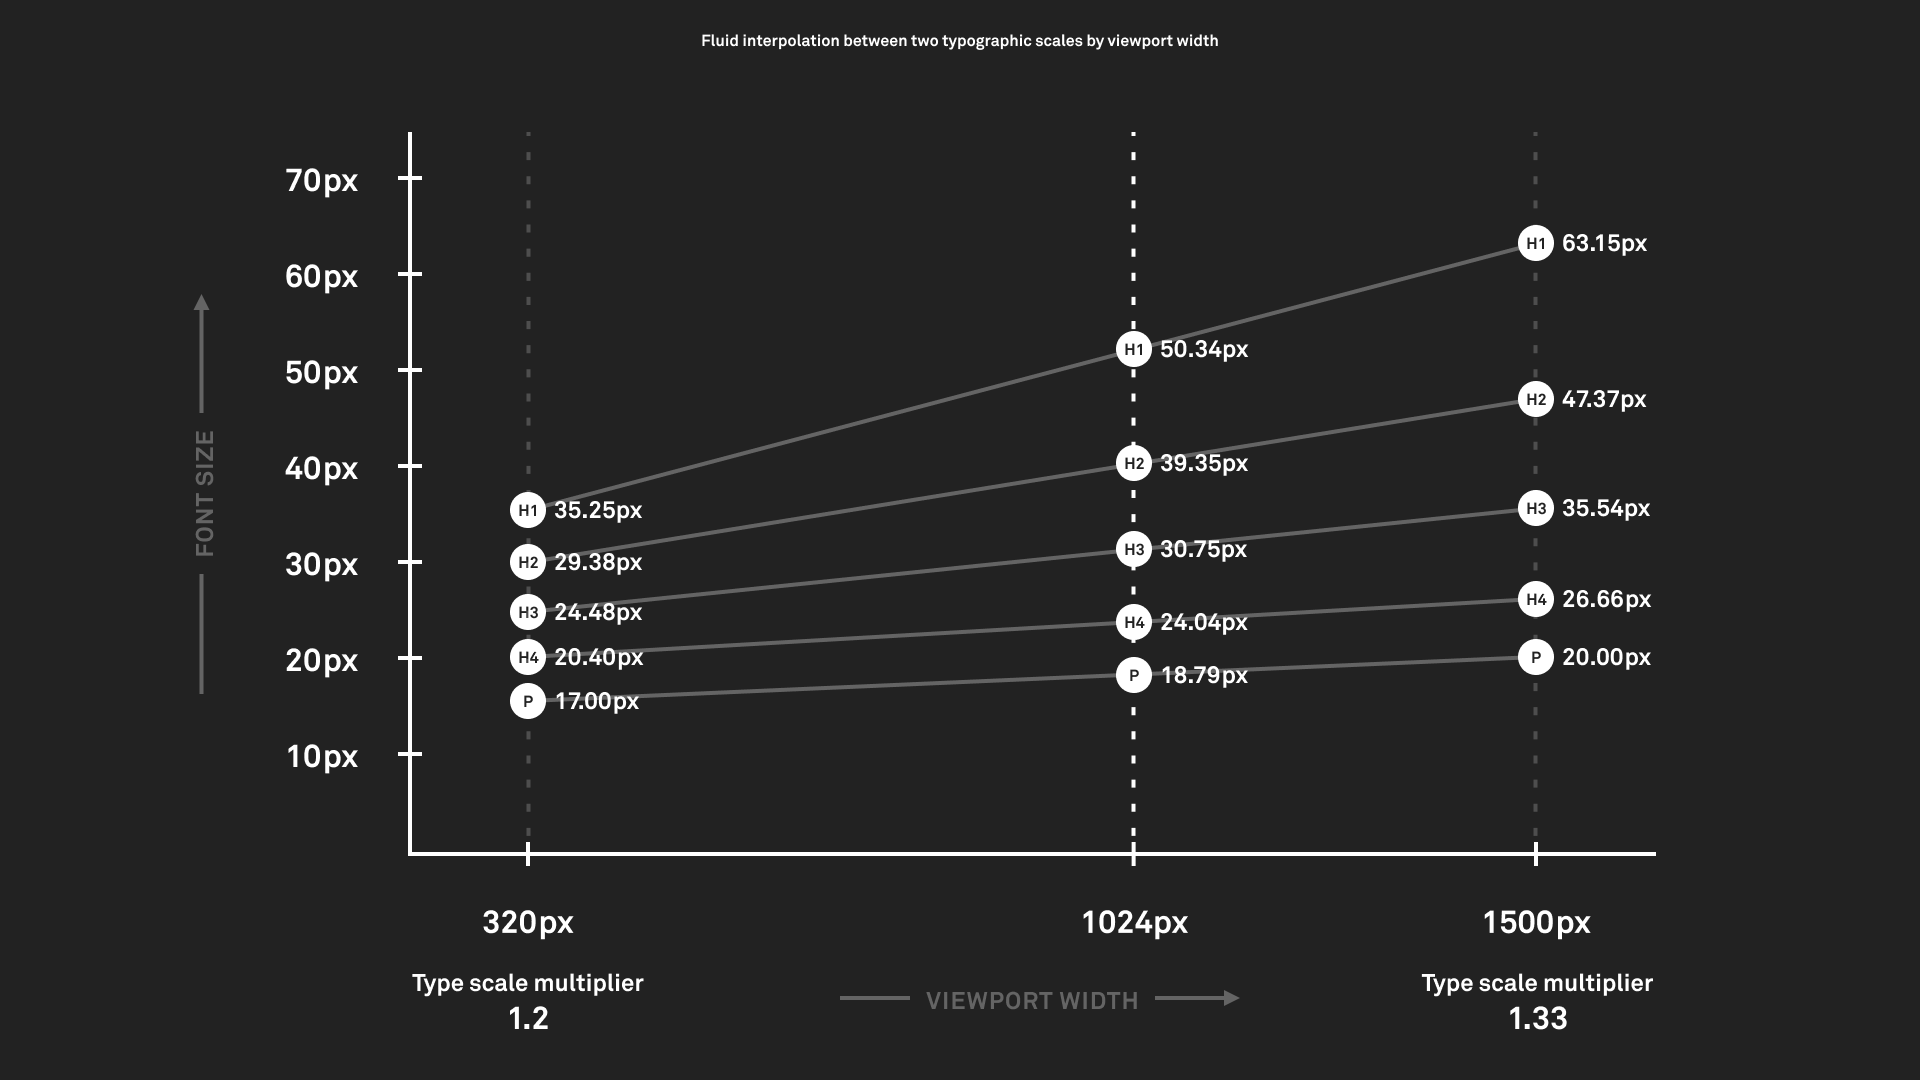
The original graph of fluid typographic scales, plotting each scale step on a line graph, demonstrating the linear steps and modular scales

This graph has gone through a few iterations over the years, and has continued to be a useful deck slide when introducing colleagues and clients to fluid responsive design. For the latest iteration, we’d like to share a small – but hopefully powerful – new feature on our type scale calculator. Your type scale can be viewed in the original font size table, the scale visualiser, and now, the graph view:
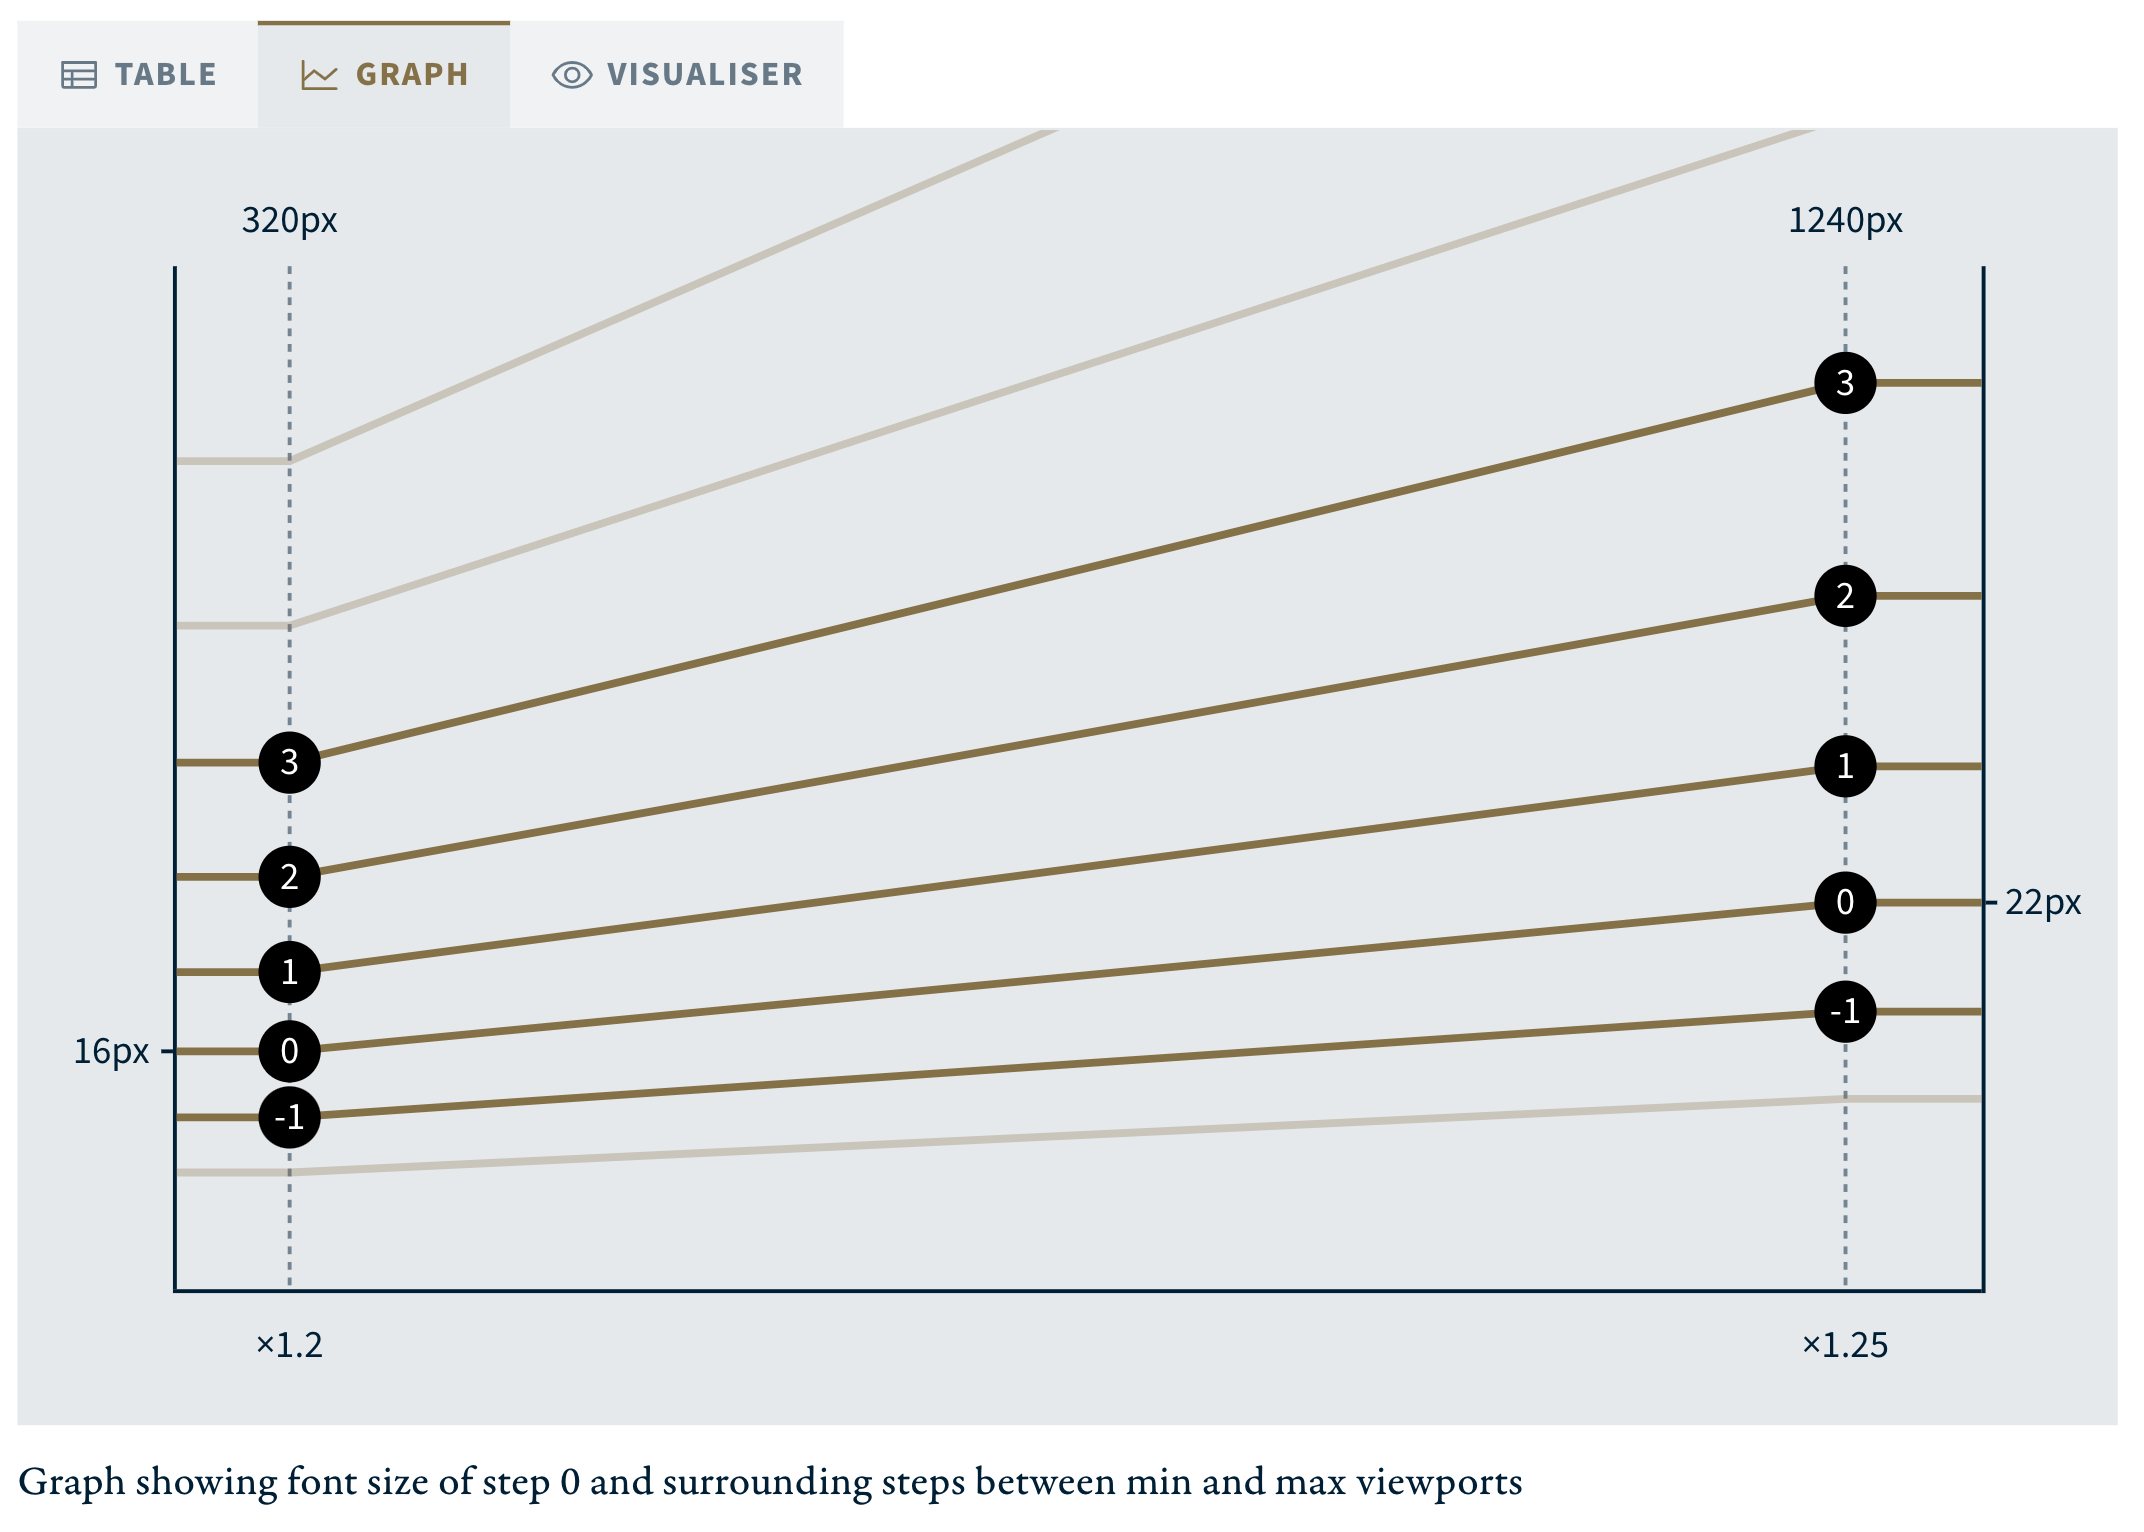
A screenshot of the new graph view on the type scale calculator

The graph plots the font size of step 0, and a few surrounding steps, to help visualise the relationship between your two type scales at your min and max viewports. Rather than plot every step, which could get cramped, we’ve opted to focus on the key steps around the origin. If this doesn’t meet your use-case, we’d love to hear from you.