
惯性聚合 高效追踪和阅读你感兴趣的博客、新闻、科技资讯
阅读原文 在惯性聚合中打开

推荐订阅源

腾讯CDC
T
Threatpost
Threat Intelligence Blog | Flashpoint
cs.CL updates on arXiv.org
T
Tenable Blog
AWS News Blog
AWS News Blog
Know Your Adversary
Know Your Adversary
TaoSecurity Blog
TaoSecurity Blog
P
Palo Alto Networks Blog
Spread Privacy
Spread Privacy
I
Intezer
Security Latest
Security Latest
The Last Watchdog
The Last Watchdog
Google DeepMind News
Help Net Security
Help Net Security
Cyberwarzone
Cyberwarzone
N
News and Events Feed by Topic
O
OpenAI News
A
Arctic Wolf
S
Secure Thoughts
Attack and Defense Labs
N
News and Events Feed by Topic
M
MIT News - Artificial intelligence
F
Full Disclosure
P
Privacy International News Feed
The GitHub Blog
The GitHub Blog
T
Troy Hunt's Blog
C
CXSECURITY Database RSS Feed - CXSecurity.com
H
Hacker News: Front Page
aimingoo的专栏
aimingoo的专栏
S
Security @ Cisco Blogs
H
Hackread – Cybersecurity News, Data Breaches, AI and More
Apple Machine Learning Research
Engineering at Meta
Engineering at Meta
Cloudbric
Cloudbric
大猫的无限游戏
大猫的无限游戏
Google Online Security Blog
Recent Announcements
H
Help Net Security
量子位
V
V2EX
美团技术团队
G
Google Developers Blog
www.infosecurity-magazine.com
S
Schneier on Security
V2EX - 技术
V2EX - 技术
D
Docker
博客园 - 【当耐特】
Project Zero
Project Zero
博客园 - 司徒正美

The Data Drop

The Lives of Great Hotels The Houseplant Atlas A running list of self-hosted apps, and what they replace Player One — Fifty Years of Video Game Heroes Semicolon | The Data Drop No one introduced us The Costume Contest, Re-Voted What we can When we ask how to help Day One with Fable Every Starlink, orbiting now You've Got a Friend in Me: Before Toy Story 5, One Last Goodbye A Day in the Life of ChatGPT World Cup 2026 Roland-Garros highlights, point by point The Boring Truth About Passive Income The Anatomy of 1:59:30 I'm not a robot. (They already know.) Inside Every iPhone Celebrating Doodles Save the Date: Every WWDC Invitation, 1990 to 2026 Ryanair's Roast iPhone ads are a masterclass. Slurp. A Video Museum of Ramen. Station Melodies of Greater Tokyo The London Public Houses Royal Pop Resale Prices: AP × Swatch StockX, eBay, 4-Year Data Every ChatGPT · Seven eras of the chatbot that changed everything Power On · Iconic boot chimes from 1977 to today Every macOS. Every name. Thank You, Tim. A Tribute to Tim Cook, CEO of Apple 2011–2026 How a Small Island Took Over the World Every Shot at The Masters 2026: Rory McIlroy 154 Macs Since 1983 The Border, in Numbers. The Listening Museum — 36 Keyboards, Sound-Mapped A Visual History of Programming Languages The Weasley Clock The Big Bang Theory: 105 Real Science Moments Every Block Ever Added to Minecraft Killed by Google: 299 Retired Google Products, Visualized Every iPhone Ever Made Years Since Each Country Last Went to War Every GPU That Mattered The Stain Index: How to Remove Anything from Anything Every Airline, Alive and Dead We Simulated IPL 2026 Fifty Thousand Times | sheets.works 21 Miles: The Strait of Hormuz, Mapped A Thousand Dots, Breathing Did The Simpsons Really Predict the Future? We Fact-Checked Every One. Pickleball, Explained The Anatomy of a Scam The Bitter Truth About Chocolate The Colors of Wes Anderson 84 Years of Patience — Warren Buffett One Second on Earth The Rom-Com Formula | The Data Drop South Park by the Numbers The Exponential Man · MrBeast by the Numbers The 3-Point Takeover What Is Your Country Reading? Game of Thrones: By the Numbers A Day With Mochi Every Object Humanity Has Sent Beyond Earth Oscars 2026: Every Winner, Every Record, Every Moment 1,025 Pokémon, Sorted The Elo Lie Every LEGO Color, Born and Died 12 Relationships. 96 Songs. One Wedding. Friends: 6 People. 236 Episodes. 1 Coffee Shop. The War in His Words. How Long Until Disney Breaks Your Heart? 170 Years of Burberry The UK Shopping Receipt 1,708 Flights — The Epstein Flight Log, Visualized Why Your $100 Burger Costs $100 Who Runs the Fortune 500? The Pixar Cry Chart – Every Tear, Timed Dhurandhar, Visualized. ₹1,355 Crore Box Office Collection. The Descent of Walter White — Breaking Bad, Visualized 30 Years of Albert Park — Every Australian GP, Visualized Who's Actually in the Room? — The Office, Visualized Chapter 3 — The Complete IND vs ENG T20I Rivalry The Dumbledore Gambit — Every Secret Withheld The Happiness Gap — World Happiness Data, Visualized Every Dog Breed's Personality, in One Chart How to Choose the Right Chart: 24 Types with Live Examples
Indian Railways, 1853–2026: The Full History, Drawn
Akash Wadhwani · 2026-06-12 · via The Data Drop

भारतीय रेल

Indian Railways

1853–2026 · THE FULL HISTORY, DRAWN

Every railway line India has built since 1853, mapped from the original opening records.
It starts with one train out of Bombay.

Then two lines were drawn that carried no trains.

Every other plate in this history adds track. One moment subtracts. Not by lifting a single rail, but by moving two borders across the map. The left map took 94 years to build. The right map is the same track, the morning after.
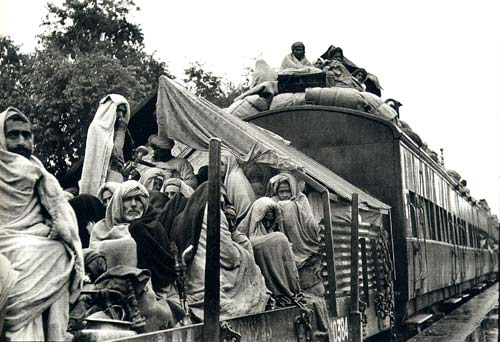
A refugee train, Punjab, 1947
A refugee train, Punjab, 1947 · Public domain

Eighteen decades, one frame.

The same map, drawn eighteen times at identical scale: black for the lines added in that decade, faded ink for everything before. Read it like a contact sheet: the few lines of the 1850s, the rush of the 1890s–1900s, the long pause after 1931, the late push that finally reached Kashmir. Hover any decade for its biggest opening; click it to open it full screen.

When did the rails reach you?

Type your home station. 7,927 of the 11,665 stations on this map carry a date. Yours probably knows exactly when it joined the network.

Methodology, honestly.

The spine of this piece is a section-by-section ledger of 1,527 railway line openings, 1853–1931, compiled by Fenske, Kala and Wei from colonial administrative records: each entry a section ("Chittagong to Feni"), an exact opening date, an operating company, a mileage.

We placed each section's endpoints against a gazetteer of 13,000+ stations across India, Pakistan, Bangladesh and Myanmar (Wikidata, DataMeet), translating colonial spellings along the way: Cawnpore to Kanpur, Tannah to Thane. Each dated section was then routed along today's actual rail alignments (OpenStreetMap) and validated against the ledger's own recorded mileage. Stations inherit the earliest dated line within reach; where Wikidata records an earlier date of its own, the earlier date wins. The modern era (Konkan 1998, the Kashmir line through the Chenab bridge in 2025) comes from Wikidata's dated railway lines and Indian Railways records. Every line running today that we could not yet date is drawn in grey, from OpenStreetMap, so the network you see is the whole network.

Coverage: 850 dated sections in ink · 28,000 km running today in grey, dates pending · 98% of routed mileage follows true alignments · 7,927 / 11,665 stations dated · vanished lines appear as straight, fainter segments

What the grey means: about a third of the historical mileage resists confident dating. Stations renamed beyond recognition, river-ghat termini that no longer exist, lines whose records vanished with the companies that built them. Rather than leave those lines off the map, we draw everything running today in grey and promote a line to ink only when we can prove its date. The network is complete; the dates are earned.

The Data Drop

Made by one person. One interactive data story every week. Last time it was every iPhone ever made; before that, the sound of 130 keyboards.