









1. 简介
Graphviz是贝尔实验室开发的一个开源的绘图工具包。它使用一个特定的DSL(领域特定语言): DOT作为脚本语言。使用布局引擎来解析DOT脚本,完成自动布局。支持丰富的导出格式,例如:PNG、JPG、PostScript、SVG、PDF等。
支持的布局引擎:
- dot 默认布局方式,主要用于有向图
- neato 基于spring-model(又称force-based)算法布局
- twopi 放射状布局
- circo 圆环布局
- fdp 无向图布局
编译命令为:
| |
其中Graphviz 的 cmd 有好几种,每种使用方法都完全相同,差别只在于渲染出来的图片效果不一样。cmd可选项[dot、neato、twopi、circo、fdp],也就是上面的布局引擎。
使用 dot 命令编译,如
| |
2. DOT语法特征
DOT语法相对简单,没有特殊的格式要求,也没有复杂的运算符和结构。Graphviz图形主要由节点、边、标注组成。
2.1 语法关键字
- 注释,使用//注释
- 有向图 - 使用digraph定义有向图
- 有向图 - 使用->表述节点之间的关系
- 无向图 - 使用graph定义无向图
- 无向图 - 使用 – 表述节点之间的关系
- 节点之间的关系 - 有向图:a -> b,a节点指向b节点
- 节点之间的关系 - 无向图:a – b, a节点与b节点连通
- 定义节点属性 - 格式为: node[attribute1=value1, attribute2=value2]
- 子图 - 使用subgraph定义子图
2.2 通用属性
| 属性名称 | 默认值 | 含义 |
|---|---|---|
| color | black | 颜色 |
| colorscheme | X11 | 颜色描述 |
| fontcolor | black | 文字颜色 |
| fontname | Times-Roman | 字体 |
| fontsize | 14 | 文字大小 |
| label | 显示的标签,对于节点默认为节点名称 | |
| penwidth | 1.0 | 线条宽度 |
| style | 样式 | |
| weight | 重要性 |
2.3 图的属性
| 属性名称 | 默认值 | 含义 |
|---|---|---|
| bgcolor | 背景颜色 | |
| concentrate | false | 让多条边有公共部分 |
| nodesep | .25 | 节点之间的间隔(英寸) |
| peripheries | 1 | 边界数 |
| rank | same,min,source, max,sink,设置多个节点顺序 | |
| rankdir | TB | 排序方向 |
| ranksep | .75 | 间隔 |
| size | 图的大小(英寸) |
2.4 节点属性
| 属性名称 | 默认值 | 含义 |
|---|---|---|
| shape | ellipse | 形状 |
| sides | 4 | 当shape=polygon时的边数 |
| fillcolor | lightgrey/black | 填充颜色 |
| fixedsize | false | 标签是否影响节点的大小 |
2.5 边属性
| 属性名称 | 默认值 | 含义 |
|---|---|---|
| arrowhead | normal | 箭头头部形状 |
| arrowsize | 1.0 | 箭头大小 |
| arrowtail | normal | 箭头尾部形状 |
| constraint | true | 是否根据边来影响节点的排序 |
| decorate | 设置之后会用一条线来连接edge和label | |
| dir | forward | 设置方向:forward,back,both,none |
| headclip | true | 是否到边界为止 |
| tailclip | true | 与headclip类似 |
3. 实例
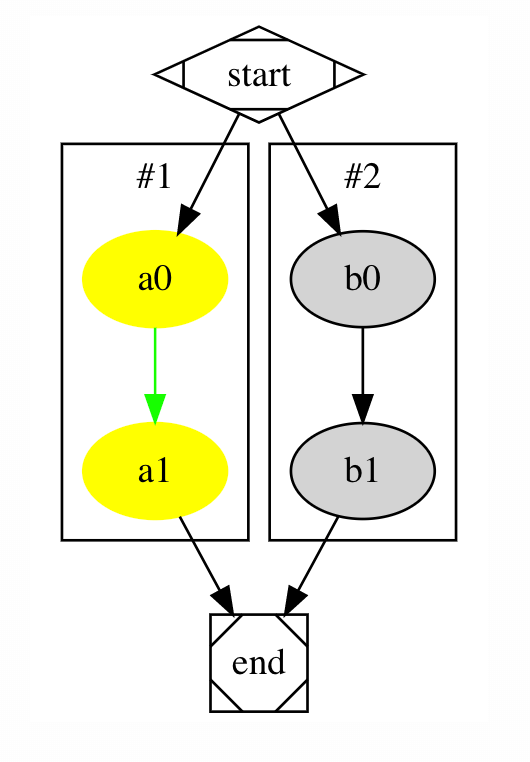
3.1 流程图
- 源代码
digraph G {
	subgraph cluster_0 {
		node [style=filled,color=yellow]; //设置节点属性
                edge [color = "green", decorate = false]; //设置边属性
		a0 -> a1;//连接信息
		label = "#1";//标签
	}
	subgraph cluster_1 {
		node [style=filled];
		b0 -> b1;
		label = "#2";
	}
	start -> {a0,b0};
	{a1,b1} -> end;
	start [shape=Mdiamond];//设置节点图形
	end [shape=Msquare];
}
- 生成的图形
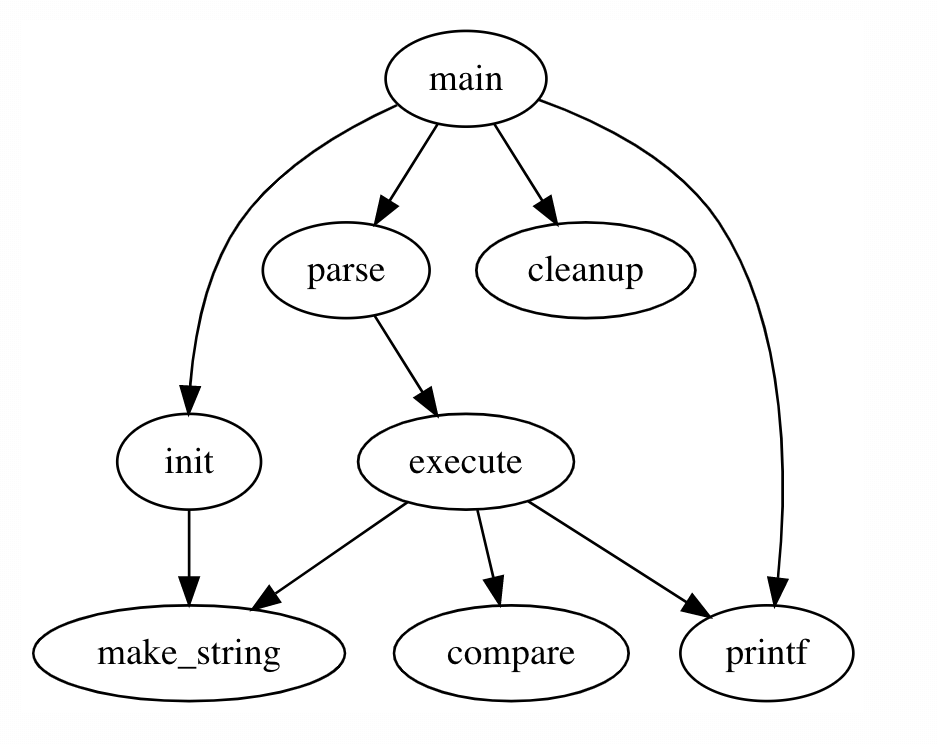
3.2 结构图
- 源代码
digraph G {
    main -> parse -> execute;
    main -> init;
    main -> cleanup;
    execute -> make_string;
    execute -> printf;
    init -> make_string;
    main -> printf;
    execute -> compare;
}
- 生成的图形
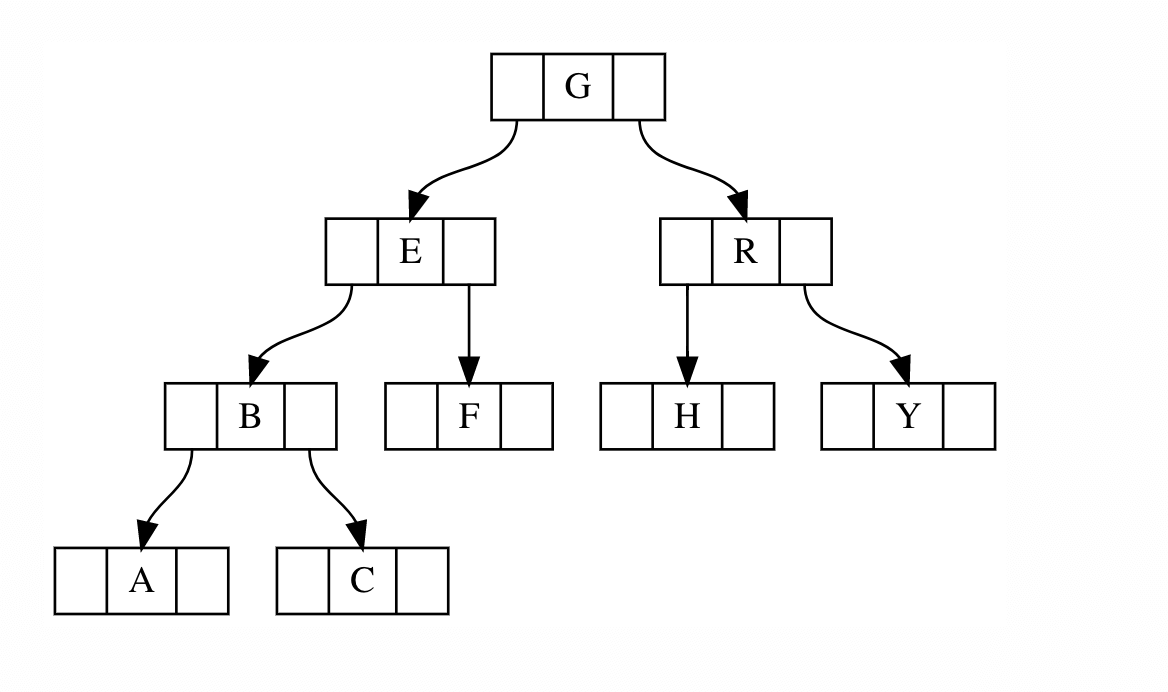
3.3 数据结构图
- 源代码
digraph g {
    node [shape = record,height=.1];
    node0[label = "<f0> |<f1> G|<f2> "];
    node1[label = "<f0> |<f1> E|<f2> "];
    node2[label = "<f0> |<f1> B|<f2> "];
    node3[label = "<f0> |<f1> F|<f2> "];
    node4[label = "<f0> |<f1> R|<f2> "];
    node5[label = "<f0> |<f1> H|<f2> "];
    node6[label = "<f0> |<f1> Y|<f2> "];
    node7[label = "<f0> |<f1> A|<f2> "];
    node8[label = "<f0> |<f1> C|<f2> "];
    "node0":f2 -> "node4":f1;
    "node0":f0 -> "node1":f1;
    "node1":f0 -> "node2":f1;
    "node1":f2 -> "node3":f1;
    "node2":f2 -> "node8":f1;
    "node2":f0 -> "node7":f1;
    "node4":f2 -> "node6":f1;
    "node4":f0 -> "node5":f1;
}
- 生成的图形
4. 前端集成
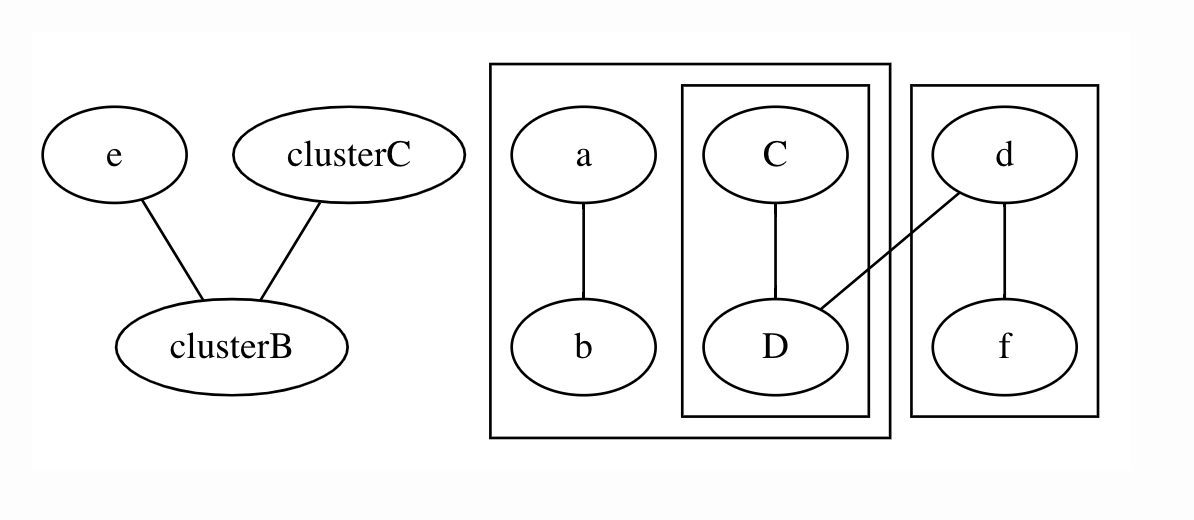
前端整合 Graphviz,主要是通过 Viz.js,将文本内容转化为图片,然后动态添加到页面实现的。这里有一段 JavaScript,获取标签的文本内容,并在标签同一级插入 Viz.js 生成的图片。
- 新增转换脚本
| |
- 利用gcode标签,插入DOT脚本
| |
- 生成的图片内容
5. 参考
- 1.http://www.graphviz.org/Download.php
- 2.https://zh.wikipedia.org/zh-hans/Graphviz
- 3.https://github.com/mdaines/viz.js/
- 4.http://viz-js.com/
