



惯性聚合 高效追踪和阅读你感兴趣的博客、新闻、科技资讯
阅读原文 在惯性聚合中打开

推荐订阅源

Engineering at Meta
Engineering at Meta
Cloudbric
Cloudbric
云风的 BLOG
云风的 BLOG
A
About on SuperTechFans
The GitHub Blog
The GitHub Blog
IT之家
IT之家
F
Full Disclosure
B
Blog RSS Feed
奇客Solidot–传递最新科技情报
奇客Solidot–传递最新科技情报
Hugging Face - Blog
Hugging Face - Blog
B
Blog
H
Help Net Security
The Cloudflare Blog
Recorded Future
Recorded Future
P
Proofpoint News Feed
P
Proofpoint News Feed
C
Cisco Blogs
T
Tailwind CSS Blog
P
Palo Alto Networks Blog
D
Docker
爱范儿
爱范儿
Know Your Adversary
Know Your Adversary
博客园 - 聂微东
D
Darknet – Hacking Tools, Hacker News & Cyber Security
Y
Y Combinator Blog
雷峰网
雷峰网
AWS News Blog
AWS News Blog
D
DataBreaches.Net
博客园 - 司徒正美
Threat Intelligence Blog | Flashpoint
博客园 - Franky
C
Cybersecurity and Infrastructure Security Agency CISA
Blog — PlanetScale
Blog — PlanetScale
cs.CL updates on arXiv.org
Latest news
Latest news
Google DeepMind News
Martin Fowler
Martin Fowler
MongoDB | Blog
MongoDB | Blog
C
CERT Recently Published Vulnerability Notes
阮一峰的网络日志
阮一峰的网络日志
K
KPMG report finds enterprise disconnect between AI and its ROI | CIO
C
CXSECURITY Database RSS Feed - CXSecurity.com
酷 壳 – CoolShell
酷 壳 – CoolShell
C
Cyber Attacks, Cyber Crime and Cyber Security
腾讯CDC
小众软件
小众软件
G
Google Developers Blog
Hacker News - Newest:
Hacker News - Newest: "LLM"
Scott Helme
Scott Helme
O
OpenAI News

博客园 - 会东

EMW 性能优化二之---并发配置 EWM一个仓库号对应ERP多个PLANT的配置 Number Range 管理之并行缓冲 HU 参考错误修正:/SCWM/RCORR_HUREF EWM 强大的数据修复功能 EWM ODO清理功能 发布EWM RF ITS Mobile 相关服务 多个ERP系统连接一个EWM系统 EWM RF 开发常用代码 SAP 函数生成测试数据 SAP EWM 性能优化-性能相关的Related Notes(二) SAP EWM 性能优化(一) 根据IDOC号查询处理日志 RFUI GUI显示技术信息 EWM RF(Radio Frequency Framework) 相关程序及事务 PI Function Library 应用,公共UDF开发 PI 安装升级后:JNLP文件中的JAR资源签名证书不一致 招聘ABAP开发程序员 实现在一个SAP系统中调用其它SAP系统的功能
XI/PI 消息性能统计
会东 · 2012-04-28 · via 博客园 - 会东

PI 消息性能统计

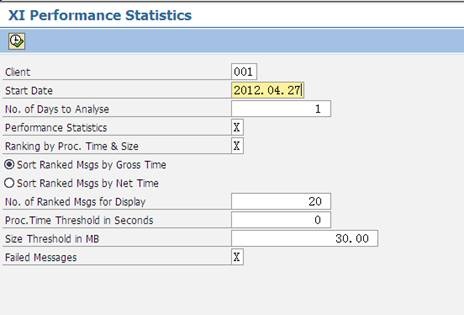
Program:RSXMB_REMOTE_SERVICE

功能:用于统计、评估PI处理message效率,分析性能问题
clip_image002

Start Date:开始时间

No. of Days to Analyse:分析天数

Performance Statistics:是否进行性能统计,处理效率

Ranking by Proc. Time & Size:显示处理日期及消息大小

No. of Ranked Msgs for Display:显示前N条处理时间最长的消息

Proc.Time Threshold in Seconds:处理在N秒之内

Size Threshold in MB:分析N M以内的消息

Failed Messages:错误消息统计
clip_image004

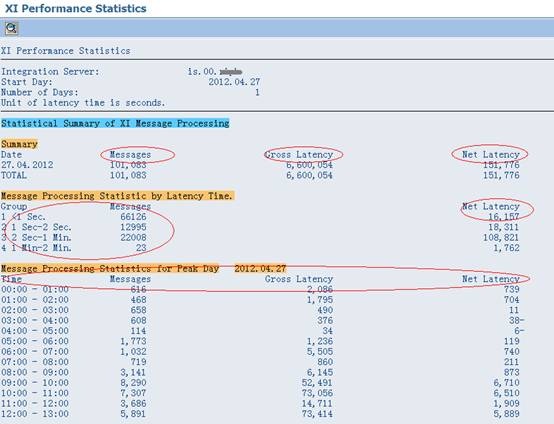
Messages :message 个数

Gross latency:总处理时间,含重发、等待时间

Net latency:净处理时间,实际处理的时间

Message processing statistic by latency time: 1秒内处理的message数量,1-2秒内处理的数量,2-1分处理的数量******

Message Processing Statistics for Peak Day:每小时处理的数量统计

clip_image006

Key Performance Indicators 分析指标

Period Analysed: 处理区间

Total Messages for Period:总消息数

Average Messages/Day:每天平均消息数

Average Latency:平均处理时间

Processing Mode Profile :分析参数

Asynchronous Average Latency:

Synchronous Average Latency:

% of Total Msgs Asynch/Synch:异步和同步比率

Failed XI Messages 错误消息统计

clip_image008

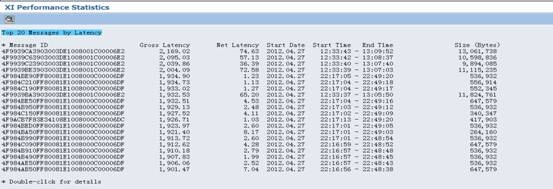
Top Messages by Latency:处理时间最长的前排消息

Top Messages by Size:消息大小排名
clip_image010

双击一行消息

可以查看明细

其它统计方法:

RWB:Performance Monitoring

Tcode: Sxmb_admin

processing statistics

persistence layer analysis