





A deep dive into the error code taxonomy and detection mechanisms that prior research didn't cover.
By: Shen Yuan and Nir Avraham
Introduction
In December 2025, Google's Threat Intelligence Group (GTIG) published extensive research on Intellexa's Predator spyware, documenting its zero-day exploit chains and the PREYHUNTER stager component. Their research identified that the "watcher" module detects developer mode, jailbreak tools, security applications and network interception configurations.
However, while conducting independent reverse engineering of a Predator sample, Jamf Threat Labs discovered several undocumented mechanisms that reveal how sophisticated this spyware's anti-analysis capabilities truly are. This post presents original findings including:
- A complete error code taxonomy (301-311) that enables operators to diagnose exactly why an implant failed
- Implementation details for each detection method that go beyond high-level descriptions
- An undocumented crash reporter monitoring system for anti-forensics
- SpringBoard hooking to hide recording indicators from victims
- Kernel exploitation class names that reveal the internal architecture
These findings demonstrate that Predator's operators have granular visibility into failed deployments — a capability that has significant implications for researchers attempting to analyze these samples.
The CSWatcherSpawner architecture
The implant contains a C++ class named CSWatcherSpawner::CSWatcherSpawner that orchestrates all anti-analysis checks. The class implements a comprehensive set of detection methods with a sophisticated reporting mechanism.
What makes this architecture notable is not just the breadth of checks, but the reporting mechanism that provides operators with precise diagnostic information when deployment fails.
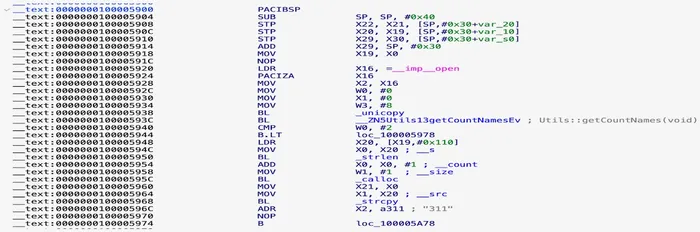
Figure 1: check_perform() entry point showing getCountNames() check and error code 311 dispatch for multiple instance detection
The error code taxonomy
The most significant undocumented finding is Predator's error code system. When any anti-analysis check triggers, the malware doesn't simply terminate — it reports a specific error code to its command-and-control infrastructure before cleaning up and exiting.
The check_perform() function reveals the complete taxonomy:
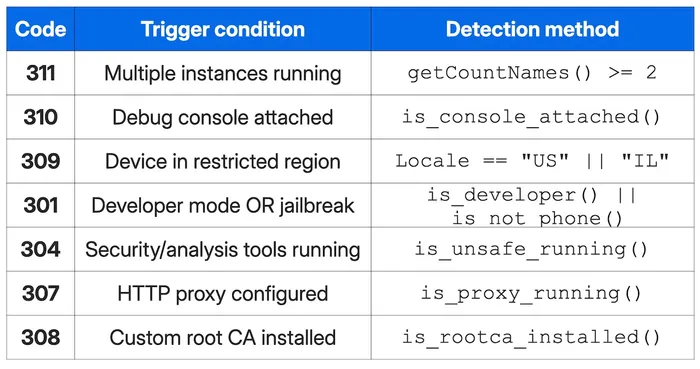
Table 1: Error codes and their conditions
The missing error codes: 302, 303, 305, 306
A careful examination of the binary's string section reveals an interesting gap in the error code taxonomy. The error codes stored in the __cstring section appear sequentially, but with notable gaps:
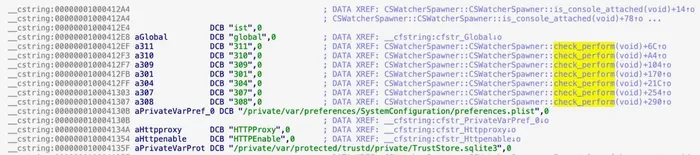
Figure 2: Error code strings in __cstring section — note the sequential addresses but non-sequential codes (301, 304, 307, 308) revealing missing 302, 303, 305, 306
Notably, error codes 302, 303, 305, and 306 are completely absent from this sample. These gaps in the numbering scheme suggest several possibilities:
- Reserved codes: Placeholder codes for future functionality or checks not yet implemented
- Variant-specific: These codes may be used in other Predator variants or versions targeting different platforms
- Deprecated checks: Detection methods that were removed but whose error codes were preserved in the taxonomy
- Shared taxonomy: The error code system shared across multiple Intellexa products, with different products implementing different subsets
The non-sequential numbering (jumping from 301 to 304, and from 304 to 307) indicates this error taxonomy has evolved over time or is designed to accommodate checks that may be conditionally compiled based on the target configuration.
Why this matters
This error code system transforms failed deployments from black boxes into diagnostic events. When an operator deploys Predator against a target and receives error code 304, they know the target is running security tools — not that the exploit failed, not that the device is incompatible, but specifically that active analysis is occurring.
This has direct implications for targeted individuals: if security analysis tools like Frida are running, Predator will abort deployment and report error code 304 to operators, who can then troubleshoot why their deployment failed.
Detection implementation details
While Google's research mentioned that Predator detects "custom HTTP proxies" and "custom root CAs," the actual implementation details were not published. Here's what the binary reveals:
Multiple instance detection (error 311)
The first check in check_perform() calls getCountNames() to detect if multiple Predator instances are running. This prevents researchers from running multiple analysis instances simultaneously:
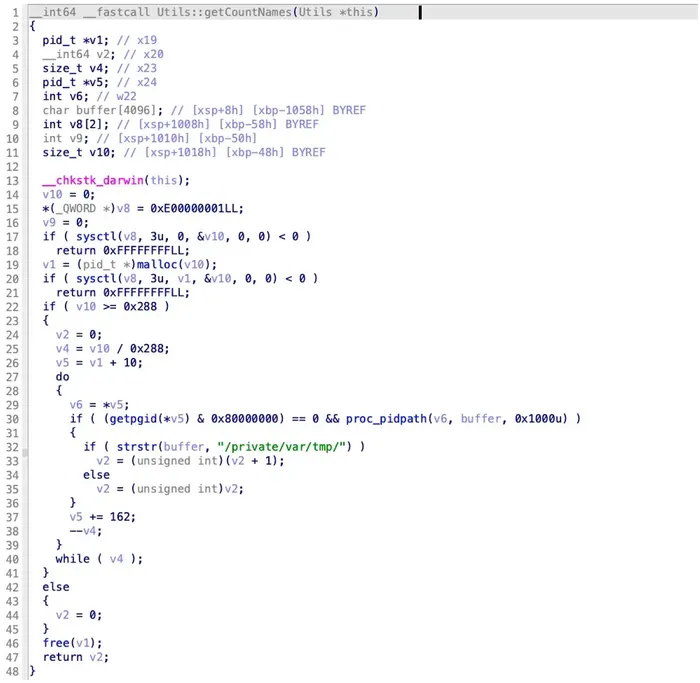
Figure 3: getCountNames() pseudocode — enumerates all processes via sysctl, uses proc_pidpath to get executable paths, counts processes running from /private/var/tmp/
The function iterates through all running processes using sysctl, retrieves each process's executable path via proc_pidpath(), and counts how many are running from /private/var/tmp/ (Predator's staging directory). If the count is two or more, error code 311 is reported.
Developer mode detection: targeting researchers
Building on Google's finding that Predator detects Developer Mode, we reverse engineered how this check works.
The is_developer() function specifically targets iOS Developer Mode using the sysctlbyname API:
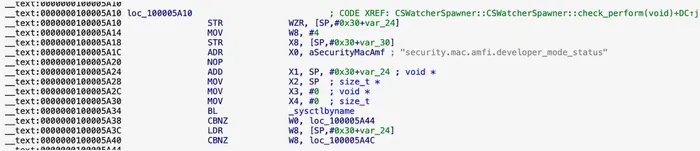
Figure 4: Developer Mode detection implementation showing sysctlbyname("security.mac.amfi.developer_mode_status") call
This is significant because Developer Mode was introduced in iOS 16 specifically for security researchers and developers. By detecting this, Predator effectively says: "If you've enabled developer features, you're probably not a normal target."
Jailbreak detection: is_not_phone()
The is_not_phone() function checks for the presence of jailbreak-related files and directories:
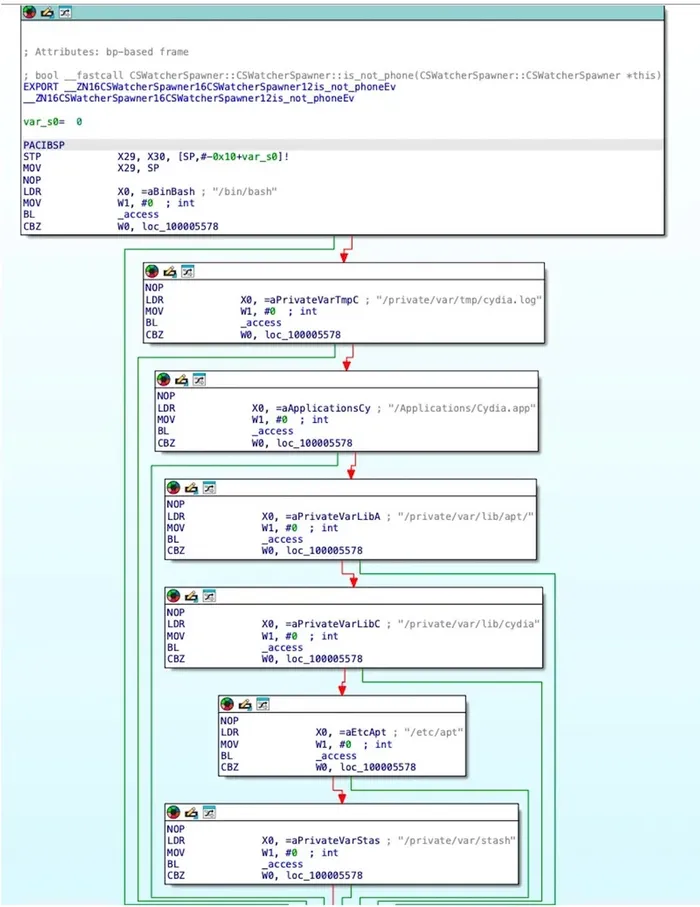
Figure 5: is_not_phone() graph view — cascading file existence checks for jailbreak indicators
The function checks for the following paths using the access() syscall:
/bin/bash— Shell binary (not present on stock iOS)/private/var/tmp/cydia.log— Cydia package manager log/Applications/Cydia.app— Cydia application/private/var/lib/apt/— APT package manager directory/private/var/lib/cydia— Cydia data directory/etc/apt— APT configuration/private/var/stash— Jailbreak stash directory
Additionally, it checks if /bin/ contains more than two entries (stock iOS has minimal binaries in /bin).
Geographic restrictions: avoiding US and Israeli jurisdiction
Google's research identified that Predator checks for US and Israeli locales. Our analysis documented the specific implementation of the geographic check (error code 309), which deserves further attention. Predator refuses to execute on devices with US or Israeli locale settings:
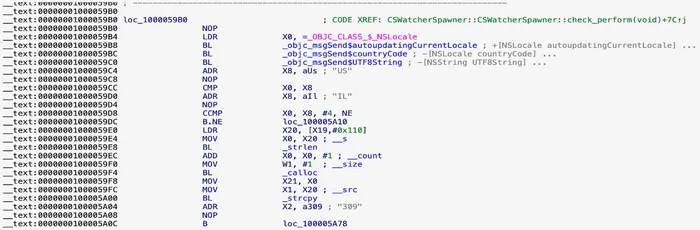
Figure 6: Geographic restriction check using NSLocale — comparing country code against "US" and "IL", triggering error 309
While we cannot confirm, this is likely a deliberate decision to avoid legal exposure in jurisdictions with strong cybercrime laws and active law enforcement cooperation with Intellexa's European base.
Console detection: timing-based analysis
The is_console_attached() function uses a clever timing-based approach:
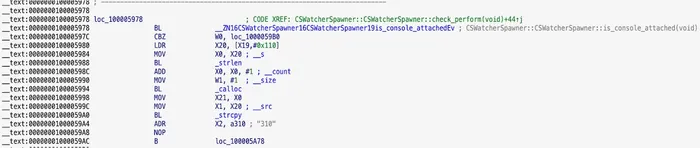
Figure 7: Debug console detection showing is_console_attached() call and error code 310 dispatch
This detection compares the modification time of the diagnosticd filter file against the system boot time. If someone enabled console logging after the device booted (as a researcher would do), the file's mtime will be newer than the boot time.
Security tool detection: the complete list
Google's research mentioned "Bash, tcpdump, frida, sshd, or checkrain" but the actual list in the binary is longer. The is_unsafe_running() function reveals the complete process detection list:
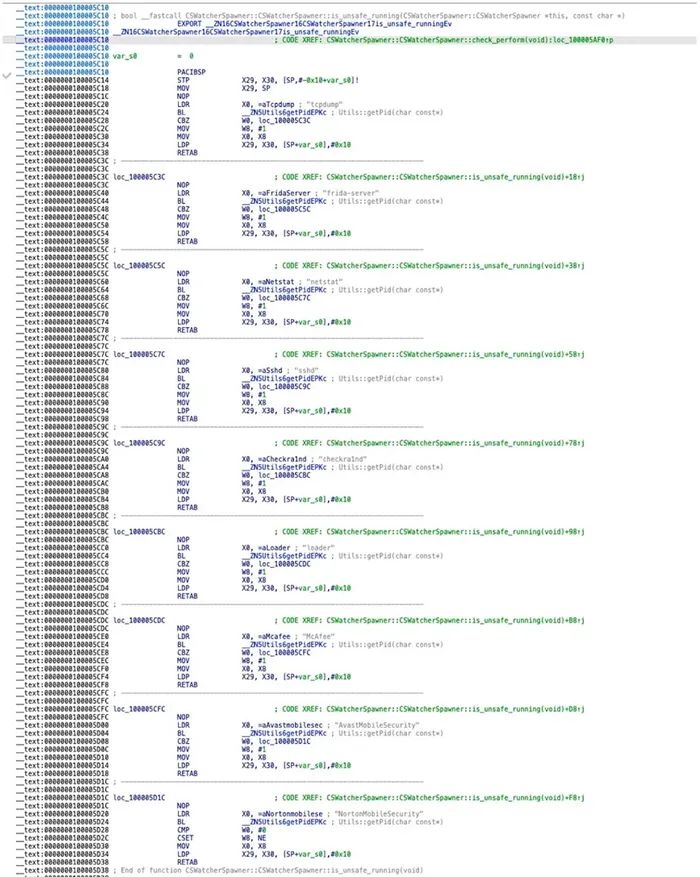
Figure 8: is_unsafe_running() assembly — complete process detection list including tcpdump, frida-server, netstat, sshd, checkra1nd, loader, McAfee, AvastMobileSecurity, NortonMobileSecurity
The complete list of detected processes also includes:
tcpdump— network packet capturefrida-server— dynamic instrumentation frameworknetstat— network statisticssshd— SSH daemoncheckra1nd— checkra1n jailbreakloader— generic loader processMcAfee— McAfee mobile securityAvastMobileSecurity— Avast mobile securityNortonMobileSecurity— Norton mobile security
The inclusion of netstat is noteworthy — it suggests Predator is concerned about targets who might be monitoring their own network connections, not just researchers with specialized tools. A privacy-conscious user simply checking their network connections would trigger this detection.
Self-cleanup after error reporting and shutdown
After reporting an error code to C2, Predator performs self-cleanup by removing its staging directory:

Figure 9: Self-cleanup code calling _remove on /private/var/tmp/ staging directory after error reporting
This cleanup happens after the C2 callback, ensuring operators receive the diagnostic information even if the malware is immediately removed.
Another cleanup mechanism is tied to the device shutdown lifecycle, the implant registers a Darwin notification observer for “com.apple.springboard.deviceWillShutDown”.
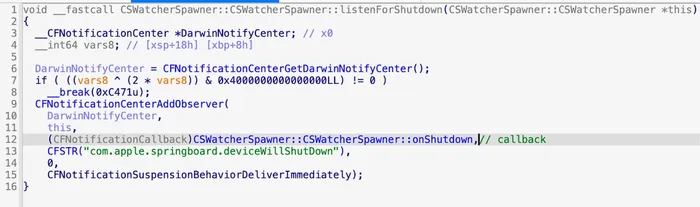
Figure 10: Code to register listener for shutdown signal
When the shutdown notification is received, it transits to a cleanup routine removes specific on-disk evidences if they exist.
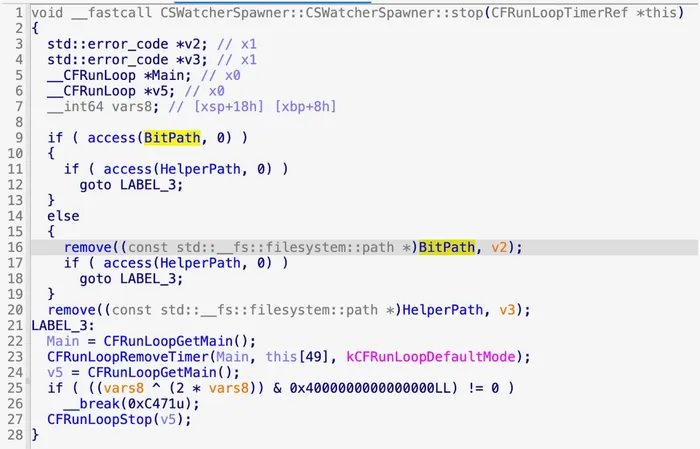
Figure 11: Self-cleanup code on shutdown process
Undocumented anti-forensics: crash reporter monitoring
One capability not mentioned in any public research is the monitoringCrashReporter() function:
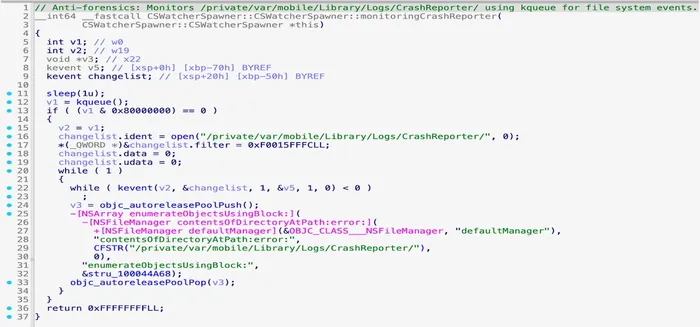
Figure 12: monitoringCrashReporter() — kqueue-based monitoring of /private/var/mobile/Library/Logs/CrashReporter/
This function uses kqueue to monitor the CrashReporter directory for any new files. When a crash occurs that might expose Predator's presence, the handler processes or removes the crash log before it can be synced or examined.
Memory forensics suppression: killing mmaintenanced
The crash handler specifically targets memory forensics evidence:
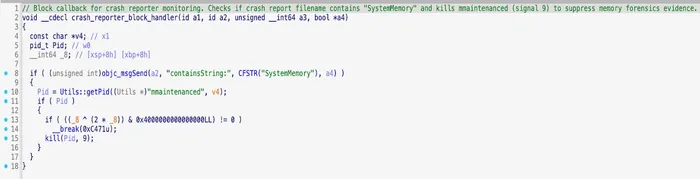
Figure 13: crash_reporter_block_handler — kills mmaintenanced when SystemMemory crash reports are detected
When a crash report filename contains "SystemMemory," the handler immediately locates and kills the mmaintenanced process (memory maintenance daemon) using SIGKILL (signal 9). This prevents investigators from capturing memory dumps.
This is significant for forensics: crash logs are a valuable artifact for detecting exploitation attempts, and Predator actively suppresses them.
Recording indicator hiding
The TestHooker() function reveals how Predator hides the iOS recording indicator from victims:
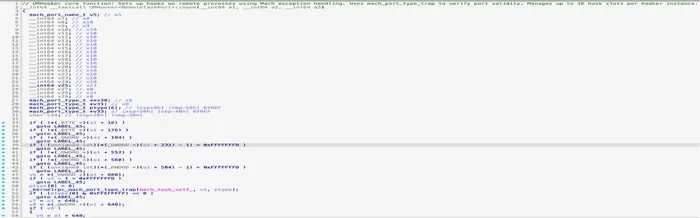
Figure 14: UMHooker using Mach exception handling for cross-process hooking into SpringBoard
This code locates the SpringBoard process, uses kernel exploitation primitives to inject into SpringBoard, and hooks SBRecordingIndicatorManager methods to suppress the recording indicator. When Predator activates the microphone or camera, victims won't see the orange/green indicator dot.
Kernel exploitation class names
The code reveals several internal class names that indicate the exploitation architecture:
Table 2: Class names and their purposes
The NSTaskROP::WithoutDeveloperMode template is particularly interesting — it suggests Intellexa has developed ROP techniques that work even when developer mode is disabled, which is the default state for most users.
Stubbed functionality: is_corellium()
An interesting artifact is the is_corellium() function at address 0x100005bb8:
Corellium is a cloud-based iOS device virtualization platform used by security researchers. The presence of this stubbed function suggests that Intellexa is aware of Corellium as an analysis platform; detection may have been implemented and later disabled, or detection is planned for future versions.
This function is not called from check_perform() in this sample, but its presence indicates awareness of the research community's tools.
Indicators of compromise
File access patterns
/private/var/preferences/SystemConfiguration/preferences.plist(proxy check)/private/var/preferences/Logging/com.apple.diagnosticd.filter.plist(console check)/private/var/protected/trustd/private/TrustStore.sqlite3(root CA check)/private/var/mobile/Library/Logs/CrashReporter/(crash monitoring)
Jailbreak detection paths
Process detection targets
SQL queries (TrustStore)
Conclusion
This analysis reveals that Predator's anti-analysis capabilities are more sophisticated than previously documented. The error code taxonomy demonstrates that Intellexa operators have granular visibility into why deployments fail, enabling them to adapt their approaches for specific targets.
For researchers, these findings highlight the importance of:
- Air-gapped analysis environments: The C2 callback means any network-connected analysis will alert operators.
- Crash log preservation: Enable crash log collection before analysis begins.
- Process name awareness: Even running netstat triggers detection.
- Boot-time considerations: Console logging configured before boot may evade timing-based detection.
For the broader security community, this analysis demonstrates that commercial spyware vendors invest significant engineering effort into detecting researchers — not just evading security products. The presence of the is_corellium() stub shows they're watching our tools as closely as we're watching theirs.
Appendix: function reference
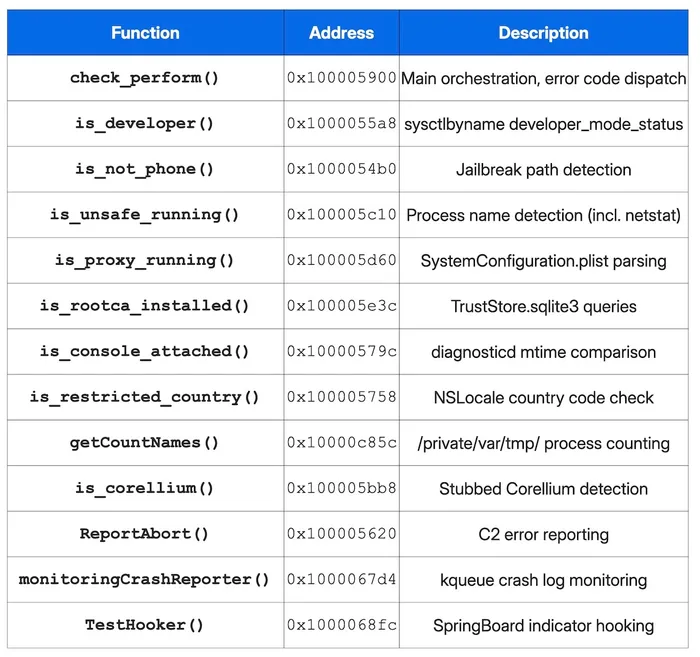
Table 3: List of functions and associated address and descriptions
Dive into more Jamf Threat Labs research on our blog.