







Headline crude prices draw the spotlight, but traders and treasuries have long understood that the real signal lies in the spreads. Two are flashing loudly right now: the Brent-WTI differential, and the gap between spot physical cargoes and the futures curve.
Together, they show how the 2026 Middle East disruption is reshaping a market whose underlying plumbing had spent a decade settling into a comfortable rhythm.
For most of the 2000s, West Texas Intermediate (WTI) and Brent crude prices moved in near lockstep. WTI, the lighter and sweeter grade, even traded at a small premium to Brent as late as 2009. At that time, the US was a net importer, Cushing, Oklahoma, was merely a pipeline crossroads, and the two benchmarks served as essentially two windows onto the same global price.
Shale fracking broke that symmetry. Starting around 2010, tight-oil production from the Bakken, Eagle Ford, and Permian surged into Cushing faster than pipelines could move those barrels south to Gulf Coast refineries. By late 2011, Brent was trading roughly $25 above WTI — the widest dislocation most modern traders had ever seen.
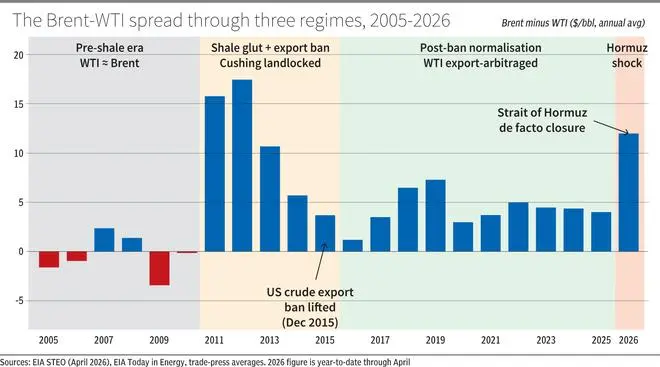
The cause was not demand or geopolitics but geography: WTI had effectively become landlocked crude priced at a mid-continent storage hub, while Brent remained a seaborne benchmark connected to the rest of the world.
In December 2015, the US Congress ended the 40-year ban on oil exports, and the market gradually rebalanced. New pipelines to Corpus Christi and Houston, expanded dock capacity, and a steady stream of WTI cargoes to Asia and Europe pushed the Brent-WTI spread into a narrower $3-$7 range for most of the past decade. From there, the differential largely reflected a freight-and-quality relationship: Brent minus WTI approximated the cost of shipping a Gulf Coast barrel to a European refiner, with an adjustment for its quality premium.
Components of the spread
Strip away the noise and a few clear forces drive the Brent-WTI spread. Location and transport set a structural floor: Cushing is inland, and pipeline capacity to the Gulf determines how easily surplus US crude can reach seaborne buyers.
Layered on top are cyclical drivers — US production growth, Cushing inventories, available export capacity, and the geopolitical risk premium, which almost always hits Brent first because the Middle East sits at the other end of the supply chain. WTI’s slight quality advantage pulls in the opposite direction, narrowing the spread.
The spread is so actively traded because it offers the cleanest way to express a view on US infrastructure relative to global risk. When the spread widens, it typically reflects one of two forces: either a US supply surge, or a global shock from which the US is comparatively insulated. In April 2026, the evidence points emphatically to the second scenario.
Following the late-February military action in the Gulf and the effective closure of the Strait of Hormuz, Brent crude surged from about $61 at the start of the year to $118 by the end of March — the largest inflation-adjusted quarterly move the EIA has recorded since 1988. WTI also rose, but far less, as high US inventories and the prospect of a Strategic Petroleum Reserve release capped its gains.
The Brent-WTI spread, which started the year near $4, averaged $11 in March, peaked at $25 on March 31, and is expected by the EIA to average $15 in April. The message from the market is clear: this disruption is primarily a Brent problem, not a WTI one.
Overlaid on that is a second, even more striking distortion: spot physical barrels are trading far above the futures curve. Dated Brent hit a record $144 on April 7 while the Brent futures contract traded near $109 — a gap of about $35.
The WTI curve is also in steep backwardation, with prompt contracts at a double-digit premium to the following month and the back end of the curve priced in the high $50s through the mid-2030s. The message is unambiguous: the long end says the market expects this to pass; the front end says the pain is far from over. Refiners are paying whatever it takes for a barrel they can load onto a tanker today.
Impact on India
India imports about 89 per cent of its crude oil, and the Indian Basket is its main real-time import price benchmark. Until February, the formula gave Dubai and Oman sour grades a 79 per cent weight and Brent just 21 per cent, even though Russian barrels (35-45 per cent) of India’s imports are priced off Brent.
In March, the Petroleum Planning and Analysis Cell unusually changed the formula mid-year, lifting Brent’s weight to 69 per cent and cutting Dubai-Oman to 31 per cent. Brent now makes up more than two-thirds of the basket for the first time since before 2006.
The rebalancing is crucial: the basket jumped from about $63 in January to around $146 by mid-March — a larger move than Brent’s own rally — because Dubai and Oman are priced mainly off spot assessments, not a deep futures market, and thus fully absorb the Hormuz premium. Of the three grades in the basket, only Brent has a liquid, hedgeable futures contract.
With Dubai and Oman priced mostly on the spot, Indian refiners — and therefore the sovereign — cannot effectively hedge most of their actual purchases. When the spot-futures dislocation widens, as it has now, the basket bears costs that paper markets consistently understate.
Raising the Brent weighting is a double-edged move. It better matches India’s crude sourcing and expands hedgeable exposure, but also brings the global risk premium directly into the benchmark for fuel prices, subsidies, and the current account.
If a ceasefire holds and Hormuz normalises, both spreads should narrow by year-end. Otherwise, India will be paying full spot Gulf prices on much of its basket, with little room to hedge.
Headlines will keep highlighting $100 oil, but the spreads tell a more important story.
The writer is Partner Consulting, MCQube
Published on April 24, 2026