



惯性聚合 高效追踪和阅读你感兴趣的博客、新闻、科技资讯
阅读原文 在惯性聚合中打开

推荐订阅源

V
Visual Studio Blog
阮一峰的网络日志
阮一峰的网络日志
博客园_首页
奇客Solidot–传递最新科技情报
奇客Solidot–传递最新科技情报
Last Week in AI
Last Week in AI
罗磊的独立博客
freeCodeCamp Programming Tutorials: Python, JavaScript, Git & More
博客园 - 【当耐特】
T
Tailwind CSS Blog
美团技术团队
Y
Y Combinator Blog
I
InfoQ
C
Check Point Blog
Microsoft Security Blog
G
Google Developers Blog
Google DeepMind News
博客园 - Franky
Cyber Security Advisories - MS-ISAC
G
GRAHAM CLULEY
爱范儿
爱范儿
CTFtime.org: upcoming CTF events
Google DeepMind News
F
Fortinet All Blogs
A
Arctic Wolf
Hugging Face - Blog
Hugging Face - Blog
S
Security Affairs
cs.CV updates on arXiv.org
钛媒体:引领未来商业与生活新知
钛媒体:引领未来商业与生活新知
小众软件
小众软件
云风的 BLOG
云风的 BLOG
酷 壳 – CoolShell
酷 壳 – CoolShell
Recent Announcements
H
Heimdal Security Blog
博客园 - 司徒正美
Latest news
Latest news
H
Hacker News: Front Page
H
Help Net Security
Know Your Adversary
Know Your Adversary
让小产品的独立变现更简单 - ezindie.com
S
Secure Thoughts
AWS News Blog
AWS News Blog
V
Vulnerabilities – Threatpost
NISL@THU
NISL@THU
C
Cyber Attacks, Cyber Crime and Cyber Security
L
LangChain Blog
The GitHub Blog
The GitHub Blog
有赞技术团队
有赞技术团队
The Cloudflare Blog
I
Intezer
N
News and Events Feed by Topic

Databricks

How lakebase architecture delivers 5x faster Postgres writes Why Talent Transformation Is the Missing Focus of Enterprise AI Public Health Intelligence Shouldn't Require a Data Scientist Mean Time to Detect Is a Data Access Problem First-party audience data is the ad sales relationship now Rethinking Distributed Systems for Serverless Performance and Reliability The AI Scaling Gap Hiding in Digital Native Companies AI success starts with clean data, not just better models How nOps Rebuilt Their Cloud Optimization Platform on Databricks Lakebase, and Why Other ISVs Should Too Peril Predicts: Precision Payouts for a Volatile World The foundation of AI scalability: one team, one platform, one operating model The Federal Data Paradox: Rich in Data, Poor in Access Driving Budapest Forward: How BKK Uses Databricks to Transform City Mobility LLM Vs AI: A Practical Guide to Differences, Use Cases, and Tools Model Risk Governance Is Not the Same as Risk Intelligence Generative AI for Business: A Complete Strategy and Implementation Guide Data Science vs Data Engineering: Choosing Analysis or Infrastructure AI Applications: Tools, Use Cases, and Platforms MLOps vs DevOps: A Practical Guide for Data Scientists and IT Teams Top Data Warehouse Tools For Modern Data Analytics Unlocking SAP Business Context in Databricks with Semantic Metadata Delta Sharing The marketing activation gap has a fix: Databricks and Stitch partner to turn data infrastructure into marketing performance Alert Fatigue Is a Business Risk Backstage with Lakebase Shipping Faster isn’t Learning Faster Why Your OEE Dashboard Is Lying to You The Turbine That Tried to Tell You It Was Failing Predicting Readmissions Isn't Enough. Acting in Time Is. Clinical Trials Run Longer Than They Have To. That's a Patient Problem Network Quality Is a Revenue Problem, Not a Technical One Shelf Availability Starts with Better Demand Visibility When Predicting the Next Hit Requires More Than Intuition Approximate Answers, Exact Decisions: New Sketch Functions for Analytics Companies Winning with AI Built the Data Layer First Rethinking SQL ETL for modern data platforms Stripe data now available on Databricks via Databricks Marketplace Databricks and Stripe Projects: Infrastructure Built for Agents Agents are ready but your architecture probably isn't Interoperability Between Unity Catalog and Google BigQuery via Catalog Federation Built In, Not Bolted On: What AI-Native Actually Means in Cybersecurity Operationalizing AI for public sector fraud prevention From months to minutes: Building real-time clinical data pipelines with natural language Agentic Data Engineering with Genie Code and Lakeflow Securely send first-party conversion signals with Snapchat Conversions API on Databricks Marketplace How leading tech companies are killing the builder’s tax with Lakebase Inside one of the first production deployments of Lakebase: LangGuard's agentic workflow governance engine The next generation of Databricks Genie Model Risk Management in 2026: A Banker’s Guide to the Revised Interagency Guidance OpenAI GPT-5.5 now available on Databricks, fully-governed through Unity AI Gateway Operational databases: How they work and when to use them Databricks partners with OpenAI on GPT-5.5 Announcing the Public Preview of Lakeflow Designer Are LLM agents good at join order optimization? How conversational analytics removes the BI bottleneck How to transform document activation workflows with Genie and Agent Bricks Beyond the spreadsheet: how Databricks is delivering the modern CFO in Financial Services AI App Development: Guide To Building AI-Powered Apps IoT in Manufacturing: Strategy, Components, Use Cases, and Challenges Stop Hand-Coding Change Data Capture Pipelines Multimodal Data Integration: Production Architectures for Healthcare AI Personalization Strategies for Media Companies A Modern AI Risk Management Framework Introducing the Databricks Excel Add-in for Business Users Real-Time Decisioning for AI Agents: Why you Need a Customer Context Layer First A Practical Guide to LLM Fine Tuning AI Data Transformation Guide for Data Engineers and Data Scientists Concurrency Control in DBMS: How Locking, MVCC and Optimistic Strategies Keep Data Consistent Bridging data science and marketing: Databricks unveils Delta Sharing integration for Adobe Experience Platform and agentic marketing workflows Take Control: Customer-Managed Keys for Lakebase Postgres Get hands on with agents, vibe coding and more at Data+ AI Summit Mercedes-Benz Builds a Cross-Cloud Data Mesh with Delta Sharing and Intelligent Replication, Cutting Costs by 66% What Is a Transactional Database? Introducing Genie Agent Mode Governing coding agent sprawl with Unity AI Gateway Governing Coding Agent Sprawl with Unity AI Gateway What is pgvector? Banks Don’t Have an AI Problem – They Have a Data Platform Problem Open Platform, Unified Pipelines: Why dbt on Databricks is Accelerating Why Your Agents Can’t Read Enterprise Documents — and How to Fix It Building with Databricks Document Intelligence and Lakeflow Databricks on Google Cloud: Innovate Faster. Smarter. Together. Introducing the Databricks Connector for Google Sheets: Real-Time, Governed Lakehouse Data in the Sheets Users Love Unity AI Gateway: How to connect agents to external MCPs securely Expanding agent governance with Unity AI Gateway Agentic reasoning in practice: Making sense of structured and unstructured data Agent Bricks: The Governed Enterprise Agent Platform 8 AI and data trends shaping financial services in 2026 Building real-time product search on Databricks Lovable + Databricks: Build Data-Driven Apps at the Speed of Thought Memory scaling for AI agents Powering clinical research innovation: How TriNetX uses Databricks to accelerate drug development Database Branching in Postgres: Git-Style Workflows with Databricks Lakebase How Zalando built a unified data foundation for AI and analytics on Databricks The next era of the open lakehouse: Apache Iceberg™ v3 in Public Preview on Databricks How FSIs eliminate silos between clients, operations, and finance How MakeMyTrip achieved millisecond personalization at scale with Databricks A multi-agent approach to audience intelligence AiChemy: Next-generation agent with MCP, skills and custom data for drug discovery Accelerate business insights with Lakeflow Connect, now with a Free Tier Unlocking Next-Gen Customer Experiences with Data Intelligence for Marketing
10 trillion samples a day: Scaling beyond traditional monitoring infra at Databricks
2026-05-06 · via Databricks

Databricks’ monitoring infrastructure has more than tripled in size over the last year, now tracking 5 billion active timeseries in real-time and ingesting over 10 trillion samples per day. At this massive scale, we found that off-the-shelf solutions were inefficient or difficult to tailor to our requirements. This post shares what we built instead: a scalable platform that leverages the best of the open-source monitoring ecosystem while baking in customizations for our unique needs.

Engineers across Databricks depend on monitoring systems that quickly alert us to issues, automate scaling and rollbacks, and enable intelligent troubleshooting. These systems need to be highly reliable so that we can be confident we won’t fly blind during a potential incident. However, it proved no easy feat to develop this infrastructure for Databricks scale:

  • Besides requirements for scalability, reliability, and efficiency, we run our systems globally in roughly 70 cloud regions across each of the 3 major clouds. We need to support equivalent performance despite differences in clouds, and even individual regions.
  • In the face of this breadth and variety, operating large-scale infrastructure can quickly become unsustainable. The system needs to be as “hands off” as possible – self-healing and self-scaling, rather than our oncalls directly managing each regional stack – and still provide simple interfaces for users.
  • With the growth of serverless and AI workloads at Databricks, churn across our infrastructure has skyrocketed, causing rapid increases in the cardinality of metrics. We could no longer process and store high-cardinality monitoring data as we always had, but we still aimed to maintain the debugging workflows relied on by engineers.

Up against these challenges, Databricks’ old monitoring stack was beset with reliability issues. We set out to develop a new, dependable platform that would meet our engineers’ expectations. We have since tackled 3 key problems:

  1. Architecting a reliable and efficient timeseries database (TSDB)
  2. Introducing metric aggregation to shield TSDBs from cardinality
  3. Enabling highly dimensional troubleshooting with the Databricks lakehouse

Thanos timeseries databases

What are TSDBs?

TSDBs are a core component of traditional monitoring system architectures. These specialized databases are designed to ingest large amounts of timeseries metrics data and serve high-QPS, low-latency, real-time reads. They are especially optimal for monitoring query patterns such as alerts and dashboard refreshes, which require issuing the same set of queries repeatedly and getting lightning-fast results based on the newest data.

Databricks’ old TSDBs had been built for an order of magnitude lower scale, and became a major bottleneck for us in recent years. In fact, the #1 reliability problem for the entire monitoring infrastructure was the difficulty of scaling up our TSDBs. This is an infrequent operation for many other companies, but something we needed to do almost daily given Databricks’ exponential growth.

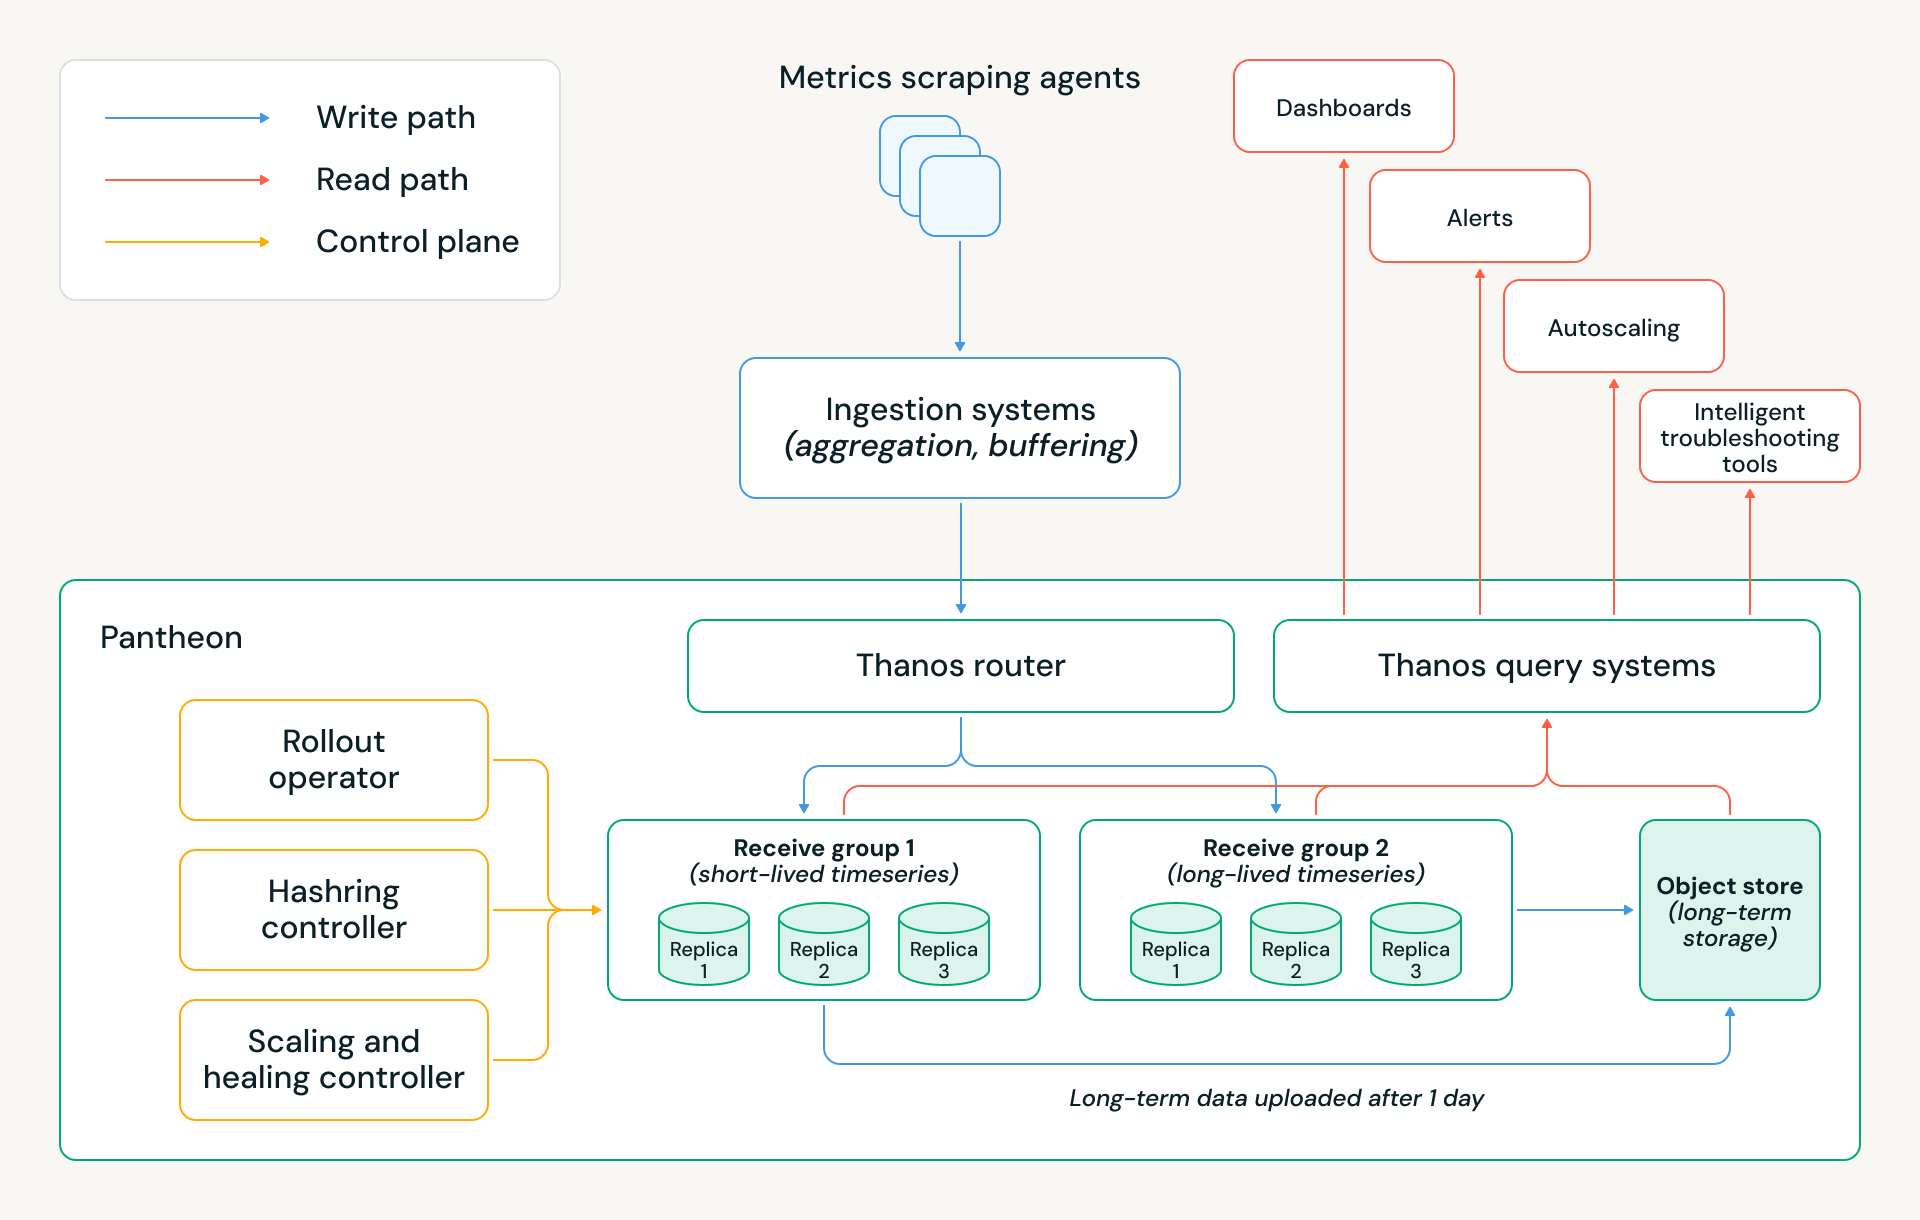
So we developed a new TSDB codenamed Pantheon, which is a fork of the open-source CNCF Thanos project. We’ve successfully scaled to over 160 instances of Thanos across all regions in three cloud providers, with a total of around 5 billion in-memory active timeseries and over 10 trillion samples ingested daily. Our largest instance hosts about 300 million in-memory timeseries and supports nearly 1,000 PromQL queries per second; we also run small 3-node deployments and everything in between. Because of the breadth, scale, and variety of our deployments, we often uncover Thanos edge cases and performance optimizations and contribute these back to the open-source community.

Migrating to Pantheon has allowed us to save millions of dollars in annual cloud costs, while reducing monitoring infrastructure downtime by ~5x and eliminating many sources of manual toil. The Pantheon architecture is shown below, and the following sections explain several key design decisions that made these achievements possible.
Thanos timeseries databases

Storage architecture

A key element of Thanos is its tiered storage architecture. The most recent timeseries are kept in-memory, the last 24 hours’ timeseries are kept on-disk, and all older data is kept on object storage. This means alerts and other real-time queries can meet strict performance requirements, as they typically depend on the newest data. At the same time, leveraging object storage allows the system to essentially decouple compute from storage; a cluster can scale up without needing to rebalance all its historical data across database nodes.

This architecture addressed our key bottleneck (scaleups) and laid the foundation for Pantheon’s cost savings. We’ve applied several other optimizations:

  • Memory retention: We deploy two Receive groups with distinct memory-retention policies: one optimized for long-lived timeseries from persistent services, keeping two hours of samples in memory, and another optimized for short-lived timeseries from Databricks’ ephemeral workloads, keeping only 30 minutes’ worth in memory. This split reflects the lifespan we observed for serverless workloads at Databricks, and significantly reduces memory footprint and cloud cost while preserving correctness.
  • Receive group structure: Each group is intentionally implemented as three isolated Kubernetes StatefulSets, corresponding to three replicas, instead of a single large hash ring. This design preserves three-way replication with quorum writes, while providing stronger operational and data isolation. This setup allows us to roll or restart an entire StatefulSet in parallel during releases or node rotations without violating quorum or impacting write availability, which materially simplifies day-to-day operations.
  • Multitenancy: Pantheon uses Thanos multitenancy to host disjoint sets of tenants across Receive groups. At the router layer, we apply rule-based tenant attribution, inferring the tenant for each data sample by inspecting the metric name and selected labels. This enables samples within the same write batch to be routed to different tenants — and therefore different Receive groups — without requiring upstream client changes.
  • At-least-once uploads: To further optimize cost while preserving correctness, only two of the three StatefulSets upload blocks to object storage. This reduces redundant upload traffic and cloud storage costs while maintaining data durability and consistency guarantees through replication and quorum semantics.

Pantheon control plane

At our global scale, manual operations, best-effort Kubernetes automation, or vanilla Thanos behaviors are insufficient. Every release, scale event, or host failure must be handled safely, automatically, and with minimal human intervention, while preserving quorum and data availability. To achieve this, Pantheon introduces a purpose-built control plane responsible for orchestrating Thanos components’ lifecycle and capacity decisions. It consists of three key controllers:

  • Rollout Operator: Coordinates releases and scaling across three isolated Receive StatefulSets, guaranteeing quorum for both reads and writes. It enables faster releases through parallel StatefulSet updates, ensuring that at most one replica is unavailable at any time.
  • Hashring Controller: Manages which Receive endpoints are visible to the router. Only healthy, fully ready pods are added to the hashring, and removals are staged during scale-down or maintenance. This decouples traffic management from pod lifecycle and prevents accidental quorum violations or partial routing during dynamic cluster changes.
  • Autoscaling and Self-Healing Controller: Scales clusters based on Pantheon-specific ingestion and resource pressure rather than generic Kubernetes signals. A built-in healer system continuously detects and remediates common failure modes — such as bad hosts, overloaded pods, or a corrupted WAL — allowing the system to self-recover without operator intervention. At our scale, these automations kick in dozens of times per week.

Cardinality and aggregation

What is cardinality and why is it important?

Metric owners often add labels such as node ID or pod ID to help them debug issues on specific dimensions and mitigate incidents faster. However, this leads to a classic observability challenge: managing cardinality. A metric’s cardinality is the number of unique combinations of its labels. If the number of pods you are monitoring increases 10x, so does the cardinality of any metric with a pod ID label. Cardinality is the primary scaling factor for a TSDB, and growth in the cardinality of existing metrics increases costs and scaling pressure on Pantheon.

Rapid infra growth is a challenge we are blessed with at Databricks. At the same time as our customer base and product usage have grown significantly, many customers have recently adopted our serverless computing architecture, and our serverless compute platform launches tens of millions of VMs daily. As more workloads move over to serverless, the infra we’re monitoring becomes higher-churn, and the lifetime of these identifier labels keeps getting shorter.

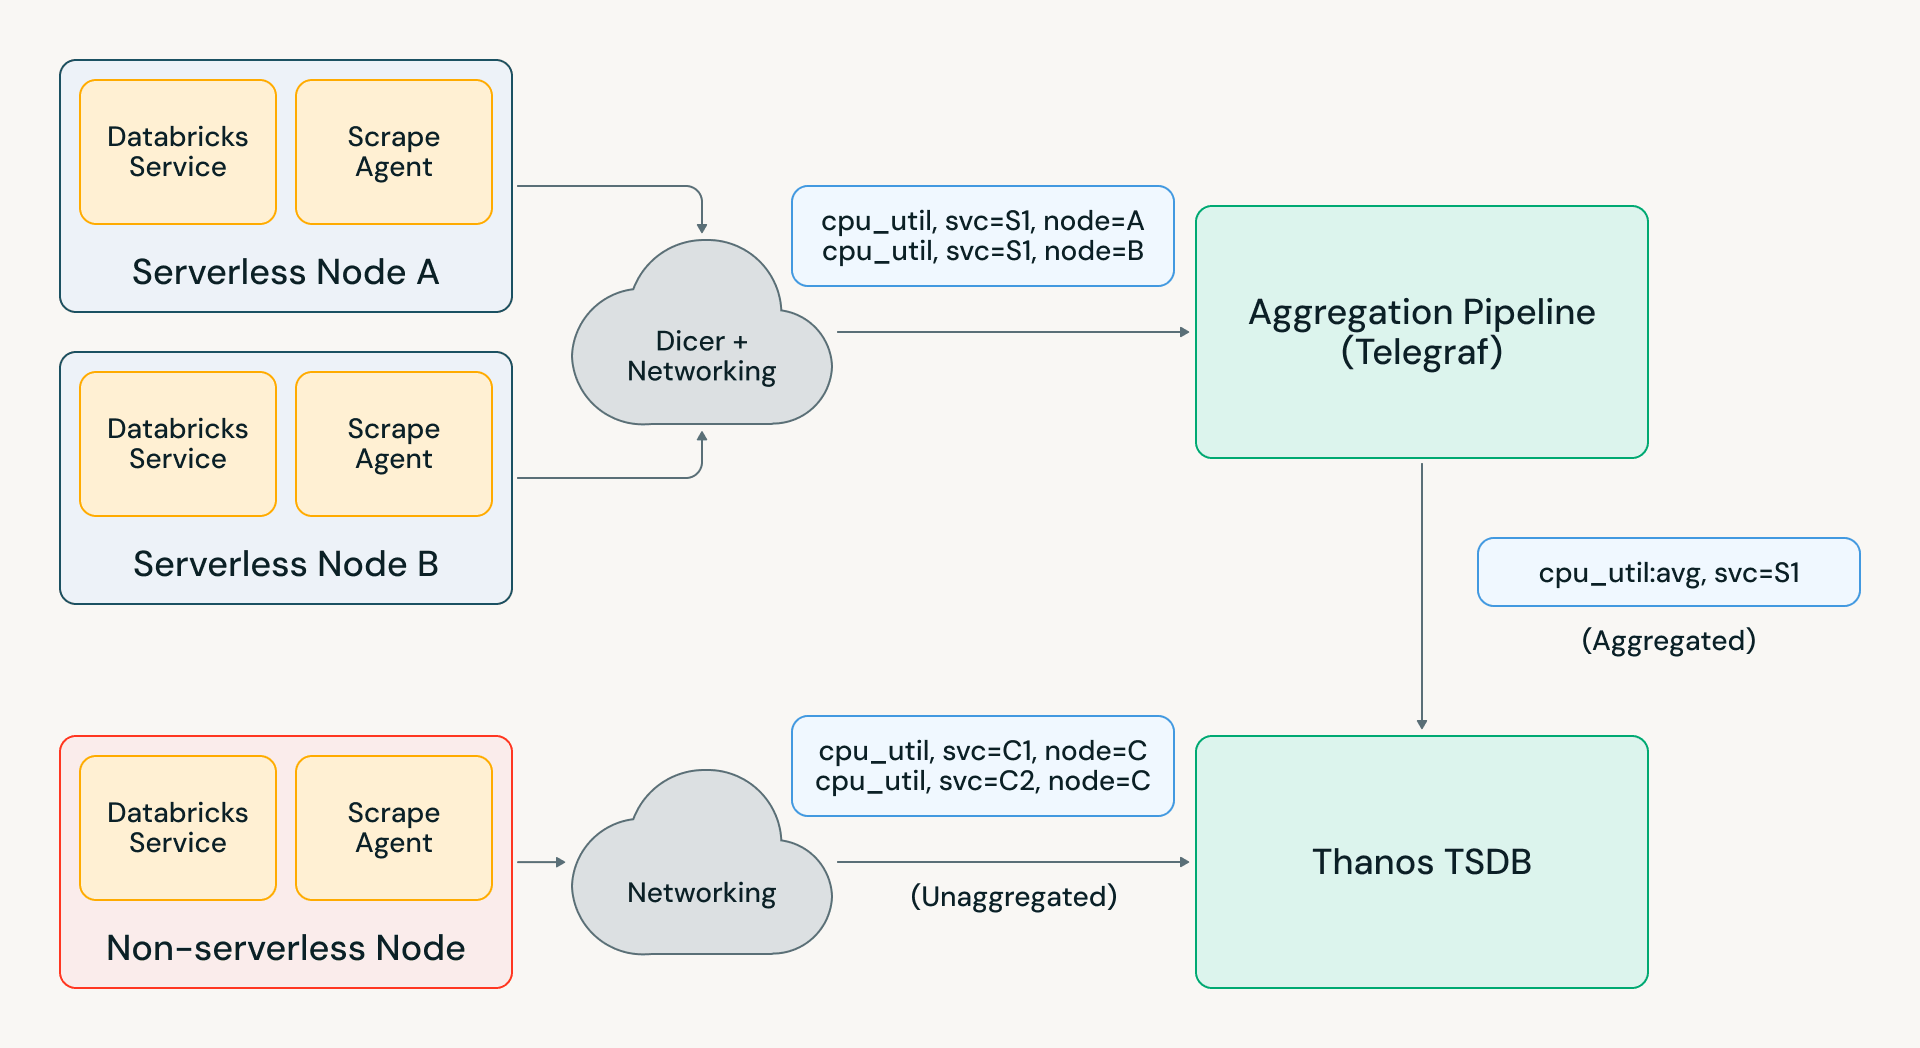
This has caused cardinality to balloon, eating into the scalability and cost wins from Pantheon. Thus, we had to get a lot smarter about what metrics data we stored. This is where “aggregation” came in: dropping expensive labels from serverless systems during ingestion, while still providing an aggregated fleetwide view to service owners. An automated aggregation strategy for metrics has allowed us to “bend the curve” of cardinality growth, ensuring the monitoring infra doesn’t need to scale faster than the rest of Databricks.

Aggregation architecture

Building reliable aggregation infra at scale is hard because it is stateful. Aggregators managing millions of input counters must be able to handle resets correctly – if an input timeseries disappears, the aggregated output value should continue to increase monotonically rather than dip. With metrics partitioned across aggregators, you also must handle scenarios such as pod restarts and load imbalance.

These problems are often solved by using a messaging system like Kafka for partitioning assignments and maintaining previous data; this is costly at our scale and adds ingestion delay that impacts real-time usecases. The alternative approach is to store in-memory state in aggregators and reroute metrics between aggregators to honor assignment. However, this leads to data loss when an aggregator is redeployed; in an initial version of our aggregation infrastructure, this behavior made aggregated metrics almost unintelligible to our users.

To make this work seamlessly, we instead developed our own aggregation system using Telegraf and Databricks’ “auto-sharder” service Dicer. This architecture uses intelligent sticky routing instead of rerouting metrics across aggregators, which addressed the redeployment failure modes. With other optimizations we’ve added on top of Telegraf, we’ve been able to scale the pipeline to over 1GB/s in our largest region and thousands of aggregation rules.
Aggregation Architecture

This new aggregation pipeline effectively became the shield protecting our TSDBs from long-term cardinality growth as well as unexpected metric surges. For example, a recent Databricks infrastructure incident resulted in a 2-5x surge in metrics load across various regions. Telegraf absorbed most of this load, and Pantheon only saw a 20% surge, allowing engineers across the company to run debugging and alerting queries without any impact.

High-cardinality data on the lakehouse

The problem with aggregation

Our aggregation infrastructure allows us to shield Pantheon from exponential cardinality growth, but this comes at a cost — it removes the exact dimensions engineers need during incidents. Consider a global fleet with:

  • Millions of active nodes in the last 2 hours
  • Multiple tenants per node
  • Short-lived workloads
  • Rapid autoscaling

Aggregated metrics tell you:

  • Region-level CPU usage is elevated
  • Service-level latency is spiking

But they don’t tell you:

  • Which tenant is causing swap pressure
  • Which node crashed
  • Which shard is isolated
  • Which workload is noisy

Databricks engineers still needed a solution for troubleshooting workflows that relied on these high-cardinality labels. These “needle in the haystack” scenarios required efficiently storing and processing massive amounts of raw data, which Pantheon couldn’t. To support these usecases, we sought out a different storage architecture that would not be limited by cardinality growth.

Enter the lakehouse!

Our key insight: the Databricks lakehouse is a perfect fit! It decouples storage (cheap object storage + Delta Lake) from compute (streaming + query clusters) and is massively scalable on both dimensions.

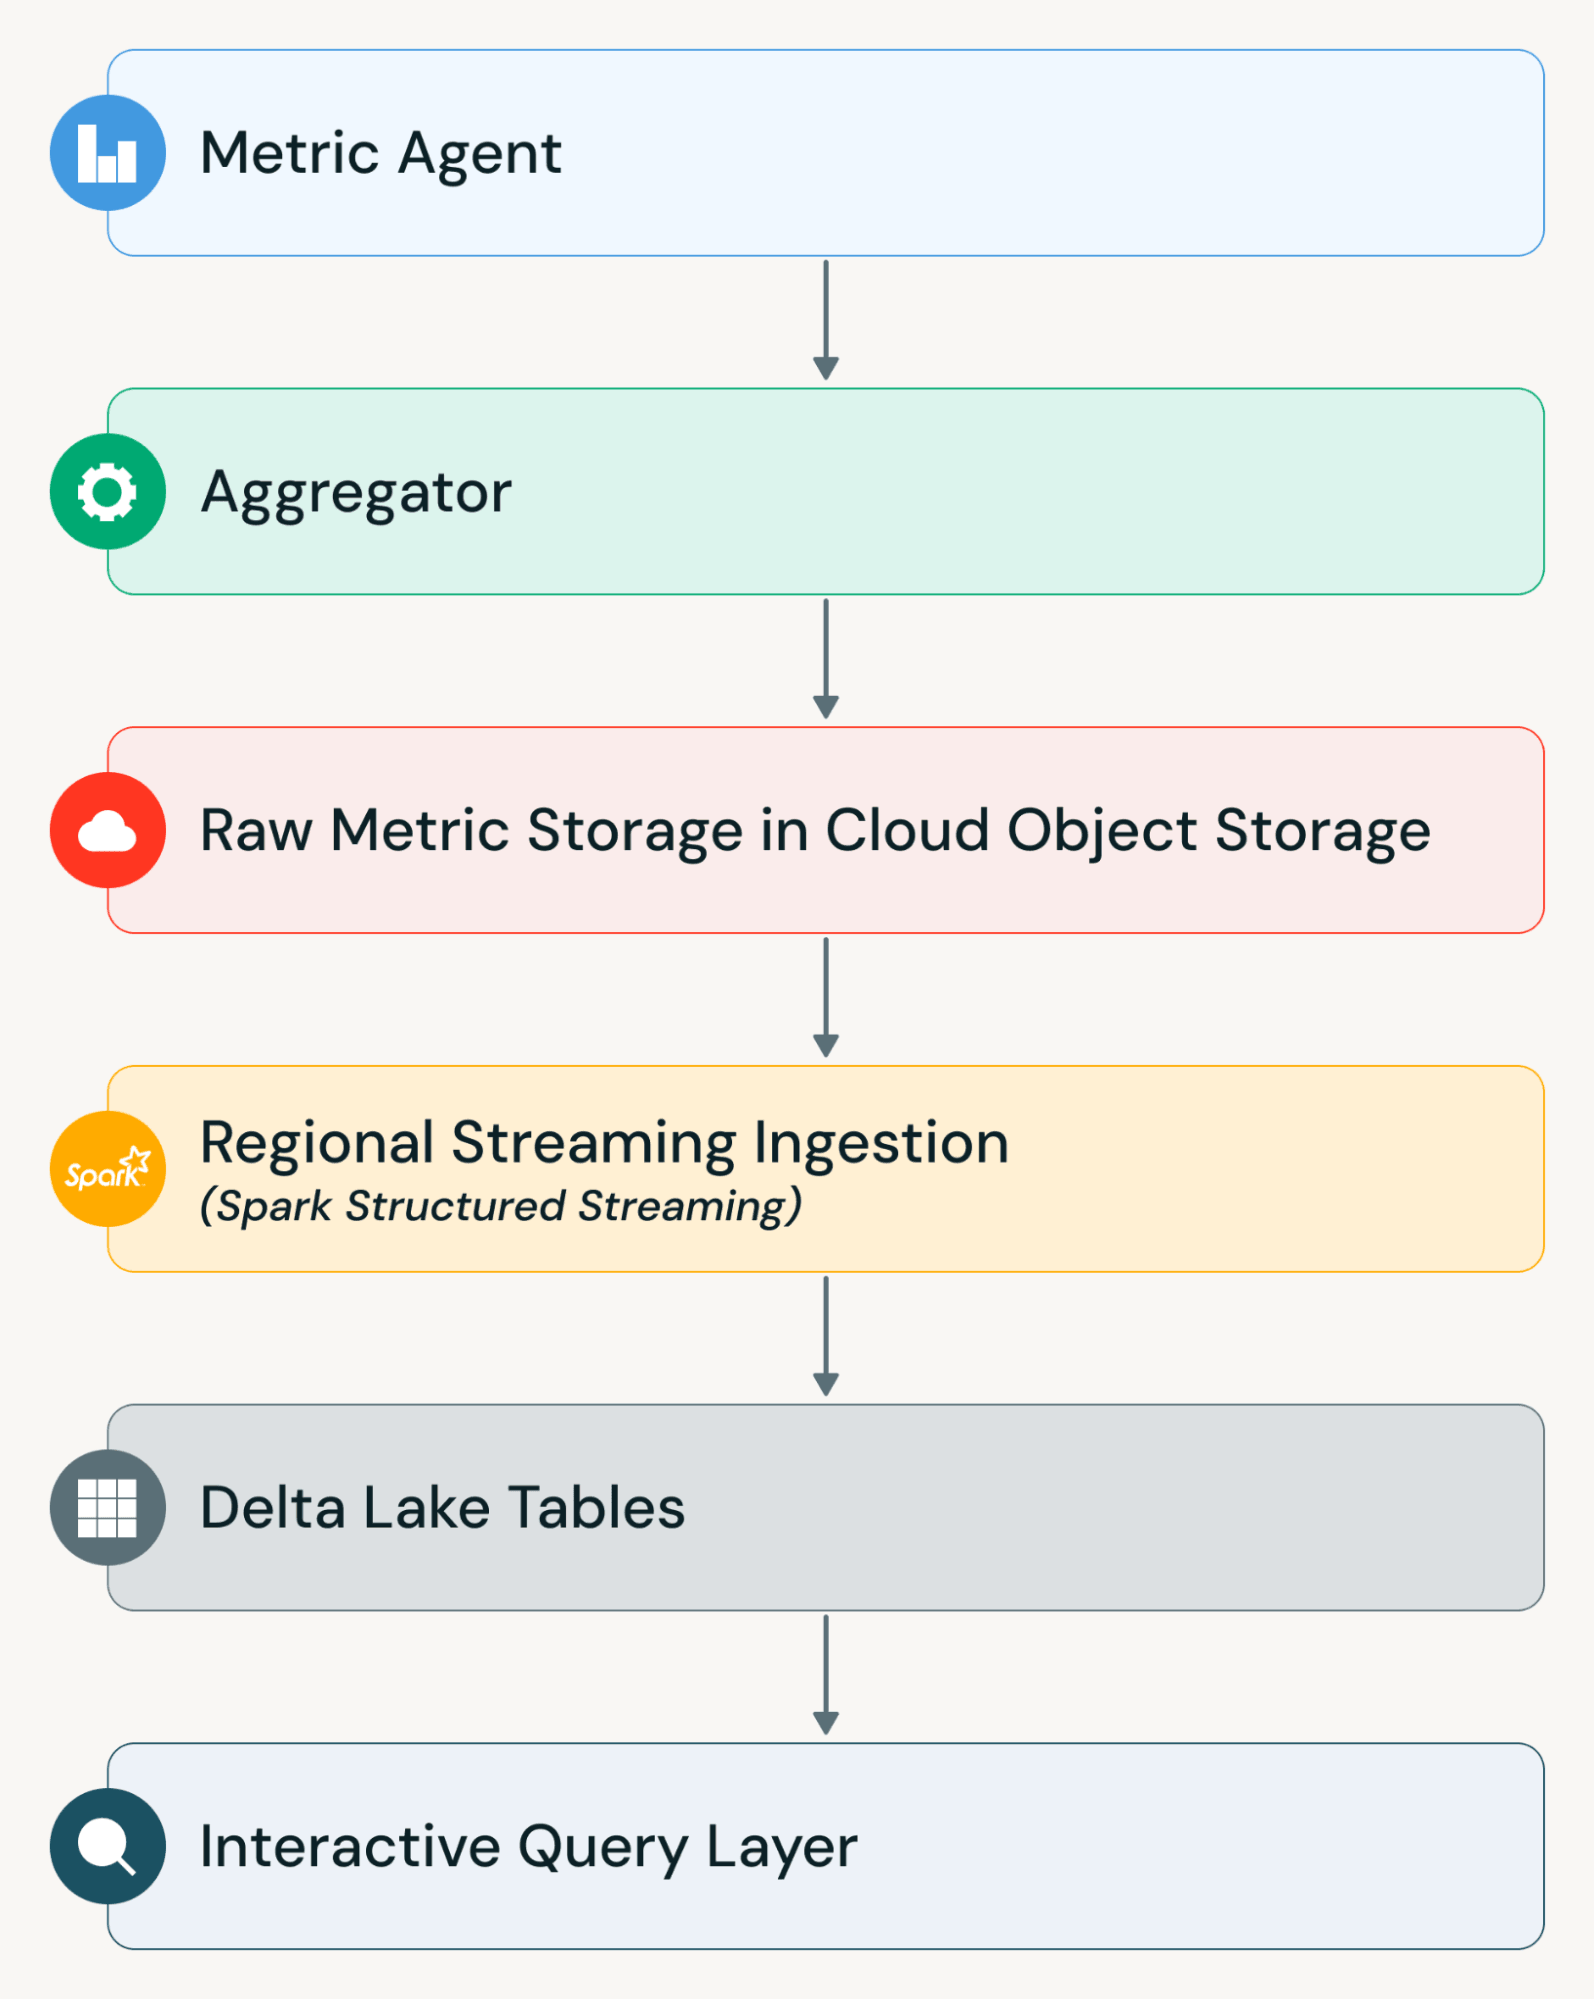
Using the best of Databricks’ capabilities, we developed a new platform for raw troubleshooting data called Hydra, which has made high-cardinality debugging practical at massive scale. Hydra ingests 20 billion unaggregated, active timeseries from millions of nodes worldwide, while achieving 5 minutes end-to-end data freshness and 50x cheaper data storage than Thanos.

These wins were enabled by Hydra’s lakehouse-native design:
Hydras Lakehouse Native Design

  • We use Apache Spark™ Structured Streaming on Databricks to run continuous ingestion jobs that incrementally process metric data as it arrives, writing it in Delta Lake. Structured Streaming lets you express streaming computations the same way you write batch jobs, but with continuous, incremental processing and exactly-once semantics for reliable ingestion.
  • To efficiently discover and ingest millions of object storage files, we leverage Databricks Auto Loader, a high-throughput Structured Streaming source that tracks and incrementally processes new files without requiring manual listing or state management. Auto Loader automatically persists metadata about discovered files and scales to handle near-real-time arrival patterns.
  • We also partition ingestion by region, deploying independent streaming jobs across geographies. This enables each pipeline to autoscale independently, minimizes cross-region latency, and reduces blast radius in case of failures. Together, these design choices allow raw metric data to be queryable within minutes of emission, even at multi-billion series volume, while keeping dashboard systems performant.

Unifying interfaces

Building Hydra was not just an infrastructure challenge; it was an interface design challenge. From the beginning, we designed Hydra around Critical User Journeys (CUJs) for our engineers rather than around storage layers or ingestion pipelines. Our goal was simple: engineers should be able to work with high-cardinality metrics using the same interfaces they already rely on.

Querying Through Grafana

Most engineers begin their debugging workflow in Grafana. They expect to write PromQL, use existing dashboards, drill into labels, and pivot quickly during incidents.

To preserve this workflow, Hydra integrates directly with Grafana by enabling PromQL queries to run against data stored in Databricks. We built a PromQL-to-SQL conversion layer that translates PromQL expressions into SQL queries executed on Delta tables in the Lakehouse. This approach allows engineers to continue using familiar PromQL syntax and dashboards without modification. At the same time, the underlying queries are executed against large-scale Delta tables rather than an in-memory TSDB.

Direct SQL Access in Databricks

While Grafana is ideal for live debugging, some investigations require deeper analysis. Engineers may need to join metrics with deployment metadata, correlate metrics with logs, run wide time-range scans, perform anomaly detection, or export datasets for advanced analytics.

Hydra also exposes the underlying Delta tables directly within Databricks. Engineers can query these tables using Databricks SQL or notebooks, enabling flexible analysis that goes beyond traditional monitoring workflows.

Because the data resides in the Lakehouse, it becomes joinable with other enterprise datasets and governed under the same security and access controls. This turns observability data into a first-class analytical asset rather than an isolated monitoring silo.

Unified Metric Semantics

A key design principle of Hydra is that engineers should not need to understand our ingestion architecture. Whether a metric is accessed through the TSDB-backed aggregated path, or the Lakehouse-backed raw metric path, the interface remains consistent.

Metric names, label semantics, and metadata dimensions are unified across environments. Service teams emit metrics once using a standardized interface. The platform handles aggregation, raw preservation, ingestion, storage, and query routing. This unified model reduces cognitive overhead and eliminates the need for teams to manage separate configurations for different observability backends.

Going forward, we are looking into improving the performance of Hydra so it achieves similar data freshness to Pantheon and the two experiences converge even further.

Takeaways

To scale the Databricks monitoring infrastructure, we’ve needed to optimize for reliability, efficiency, operability, and developer journeys. “Scaling” for us has meant more than just upsizing our deployments. It has meant:

  • Baking in resilience and automation to our foundational architecture, to achieve “hands-off” operations for these global and ever-changing systems
  • Rethinking from first principles the sort of systems that were necessary for various monitoring usecases, from alerting to troubleshooting to analysis across data sources
  • Evolving our architecture as the rest of Databricks’ infra has transformed alongside us

These will be never-ending journeys for us, and they are illustrative of why infrastructure engineering is such a dynamic space at Databricks. If you like solving tough engineering problems and would like to join us for the ride, check out databricks.com/careers!