


惯性聚合 高效追踪和阅读你感兴趣的博客、新闻、科技资讯
阅读原文 在惯性聚合中打开

推荐订阅源

aimingoo的专栏
aimingoo的专栏
TaoSecurity Blog
TaoSecurity Blog
P
Palo Alto Networks Blog
S
Securelist
C
CXSECURITY Database RSS Feed - CXSecurity.com
Cisco Talos Blog
Cisco Talos Blog
WordPress大学
WordPress大学
S
Schneier on Security
奇客Solidot–传递最新科技情报
奇客Solidot–传递最新科技情报
AWS News Blog
AWS News Blog
酷 壳 – CoolShell
酷 壳 – CoolShell
OSCHINA 社区最新新闻
OSCHINA 社区最新新闻
P
Privacy International News Feed
Security Latest
Security Latest
NISL@THU
NISL@THU
Cyberwarzone
Cyberwarzone
I
Intezer
Hugging Face - Blog
Hugging Face - Blog
Threat Intelligence Blog | Flashpoint
P
Privacy & Cybersecurity Law Blog
博客园_首页
Know Your Adversary
Know Your Adversary
K
KPMG report finds enterprise disconnect between AI and its ROI | CIO
人人都是产品经理
人人都是产品经理
Y
Y Combinator Blog
博客园 - Franky
月光博客
月光博客
GbyAI
GbyAI
G
Google Developers Blog
V2EX - 技术
V2EX - 技术
W
WeLiveSecurity
Google Online Security Blog
S
Security Affairs
K
Kaspersky official blog
Apple Machine Learning Research
美团技术团队
T
Troy Hunt's Blog
阮一峰的网络日志
阮一峰的网络日志
大猫的无限游戏
大猫的无限游戏
The GitHub Blog
The GitHub Blog
T
Threat Research - Cisco Blogs
Exploit-DB.com RSS Feed
博客园 - 司徒正美
Cloudbric
Cloudbric
Blog — PlanetScale
Blog — PlanetScale
博客园 - 叶小钗
U
Unit 42
H
Hackread – Cybersecurity News, Data Breaches, AI and More
C
Check Point Blog
G
GRAHAM CLULEY

Databricks

Why Talent Transformation Is the Missing Focus of Enterprise AI Public Health Intelligence Shouldn't Require a Data Scientist Mean Time to Detect Is a Data Access Problem First-party audience data is the ad sales relationship now Rethinking Distributed Systems for Serverless Performance and Reliability The AI Scaling Gap Hiding in Digital Native Companies 10 trillion samples a day: Scaling beyond traditional monitoring infra at Databricks AI success starts with clean data, not just better models How nOps Rebuilt Their Cloud Optimization Platform on Databricks Lakebase, and Why Other ISVs Should Too Peril Predicts: Precision Payouts for a Volatile World The foundation of AI scalability: one team, one platform, one operating model The Federal Data Paradox: Rich in Data, Poor in Access Driving Budapest Forward: How BKK Uses Databricks to Transform City Mobility LLM Vs AI: A Practical Guide to Differences, Use Cases, and Tools Model Risk Governance Is Not the Same as Risk Intelligence Generative AI for Business: A Complete Strategy and Implementation Guide Data Science vs Data Engineering: Choosing Analysis or Infrastructure AI Applications: Tools, Use Cases, and Platforms MLOps vs DevOps: A Practical Guide for Data Scientists and IT Teams Top Data Warehouse Tools For Modern Data Analytics Unlocking SAP Business Context in Databricks with Semantic Metadata Delta Sharing The marketing activation gap has a fix: Databricks and Stitch partner to turn data infrastructure into marketing performance Alert Fatigue Is a Business Risk Backstage with Lakebase Shipping Faster isn’t Learning Faster Why Your OEE Dashboard Is Lying to You The Turbine That Tried to Tell You It Was Failing Predicting Readmissions Isn't Enough. Acting in Time Is. Clinical Trials Run Longer Than They Have To. That's a Patient Problem Network Quality Is a Revenue Problem, Not a Technical One Shelf Availability Starts with Better Demand Visibility When Predicting the Next Hit Requires More Than Intuition Approximate Answers, Exact Decisions: New Sketch Functions for Analytics Companies Winning with AI Built the Data Layer First Rethinking SQL ETL for modern data platforms Stripe data now available on Databricks via Databricks Marketplace Databricks and Stripe Projects: Infrastructure Built for Agents Agents are ready but your architecture probably isn't Interoperability Between Unity Catalog and Google BigQuery via Catalog Federation Built In, Not Bolted On: What AI-Native Actually Means in Cybersecurity Operationalizing AI for public sector fraud prevention From months to minutes: Building real-time clinical data pipelines with natural language Agentic Data Engineering with Genie Code and Lakeflow Securely send first-party conversion signals with Snapchat Conversions API on Databricks Marketplace How leading tech companies are killing the builder’s tax with Lakebase Inside one of the first production deployments of Lakebase: LangGuard's agentic workflow governance engine The next generation of Databricks Genie Model Risk Management in 2026: A Banker’s Guide to the Revised Interagency Guidance OpenAI GPT-5.5 now available on Databricks, fully-governed through Unity AI Gateway Operational databases: How they work and when to use them Databricks partners with OpenAI on GPT-5.5 Announcing the Public Preview of Lakeflow Designer Are LLM agents good at join order optimization? How conversational analytics removes the BI bottleneck How to transform document activation workflows with Genie and Agent Bricks Beyond the spreadsheet: how Databricks is delivering the modern CFO in Financial Services AI App Development: Guide To Building AI-Powered Apps IoT in Manufacturing: Strategy, Components, Use Cases, and Challenges Stop Hand-Coding Change Data Capture Pipelines Multimodal Data Integration: Production Architectures for Healthcare AI Personalization Strategies for Media Companies A Modern AI Risk Management Framework Introducing the Databricks Excel Add-in for Business Users Real-Time Decisioning for AI Agents: Why you Need a Customer Context Layer First A Practical Guide to LLM Fine Tuning AI Data Transformation Guide for Data Engineers and Data Scientists Concurrency Control in DBMS: How Locking, MVCC and Optimistic Strategies Keep Data Consistent Bridging data science and marketing: Databricks unveils Delta Sharing integration for Adobe Experience Platform and agentic marketing workflows Take Control: Customer-Managed Keys for Lakebase Postgres Get hands on with agents, vibe coding and more at Data+ AI Summit Mercedes-Benz Builds a Cross-Cloud Data Mesh with Delta Sharing and Intelligent Replication, Cutting Costs by 66% What Is a Transactional Database? Introducing Genie Agent Mode Governing coding agent sprawl with Unity AI Gateway Governing Coding Agent Sprawl with Unity AI Gateway What is pgvector? Banks Don’t Have an AI Problem – They Have a Data Platform Problem Open Platform, Unified Pipelines: Why dbt on Databricks is Accelerating Why Your Agents Can’t Read Enterprise Documents — and How to Fix It Building with Databricks Document Intelligence and Lakeflow Databricks on Google Cloud: Innovate Faster. Smarter. Together. Introducing the Databricks Connector for Google Sheets: Real-Time, Governed Lakehouse Data in the Sheets Users Love Unity AI Gateway: How to connect agents to external MCPs securely Expanding agent governance with Unity AI Gateway Agentic reasoning in practice: Making sense of structured and unstructured data Agent Bricks: The Governed Enterprise Agent Platform 8 AI and data trends shaping financial services in 2026 Building real-time product search on Databricks Lovable + Databricks: Build Data-Driven Apps at the Speed of Thought Memory scaling for AI agents Powering clinical research innovation: How TriNetX uses Databricks to accelerate drug development Database Branching in Postgres: Git-Style Workflows with Databricks Lakebase How Zalando built a unified data foundation for AI and analytics on Databricks The next era of the open lakehouse: Apache Iceberg™ v3 in Public Preview on Databricks How FSIs eliminate silos between clients, operations, and finance How MakeMyTrip achieved millisecond personalization at scale with Databricks A multi-agent approach to audience intelligence AiChemy: Next-generation agent with MCP, skills and custom data for drug discovery Accelerate business insights with Lakeflow Connect, now with a Free Tier Unlocking Next-Gen Customer Experiences with Data Intelligence for Marketing
Automate Data & KPI Monitoring with SQL Alerts
2026-05-20 · via Databricks

In many organizations, data monitoring is still a manual, repetitive routine: open the same dashboard every morning, rerun the same queries, scan for anomalies. By the time anyone asks "Why is this metric down?", it has often been wrong for hours or even days, usually flagged by a stakeholder, or a downstream report that already shipped bad numbers. The fix is another manual ritual. This works until it doesn't: it can’t scale across teams, environments, or production workloads, and the cost of monitoring keeps climbing.

Today we're announcing that Databricks SQL Alerts is Generally Available (GA), with more than 4,000 customers already using Alerts in production. SQL Alerts turns that manual routine into reliable, automated monitoring: define a metric or condition once in SQL, evaluate it on a schedule (or inline with the Jobs pipeline that produces the data), and notify the right owners when it crosses your guardrails. Whether you're tracking business KPIs like revenue, or operational health like pipeline freshness, or data quality issues, SQL Alerts helps you catch issues early, reduce manual spot-checks, and keep monitoring consistent as usage grows.

“The implementation of SQL Alerts for our anomaly detection services has made observability a lot simpler. Instead of maintaining monitoring infrastructure, we can now rely on Alerts to scan for issues and notify users. Its simplified interface and customizable experience has reduced manual effort for our team and helped us identify problems faster.” —Enrique Olivares, Big Data Software Development Engineer, Zillow 

Overview of SQL Alerts 

What are SQL Alerts?

A SQL Alert bundles a SQL query, an evaluation condition, a schedule, and a set of notification destinations. When the query result crosses the condition on its scheduled run, Databricks notifies the right owners through the channels you configure.

What teams can do with SQL Alerts:

  • Catch business-metric drift early. Alert when revenue drops more than 5% week-over-week, when daily conversion rate falls below a target, or when daily active users drop in a key region.
  • Keep pipelines trustworthy. Alert when a table hasn't been refreshed in the last hour, when row counts fall below the expected baseline, or when a job loads partial data.
  • Detect custom data quality issues before dashboards break. Alert when null rates exceed a threshold, when duplicate keys appear, or when a distribution shifts outside of expected bounds.
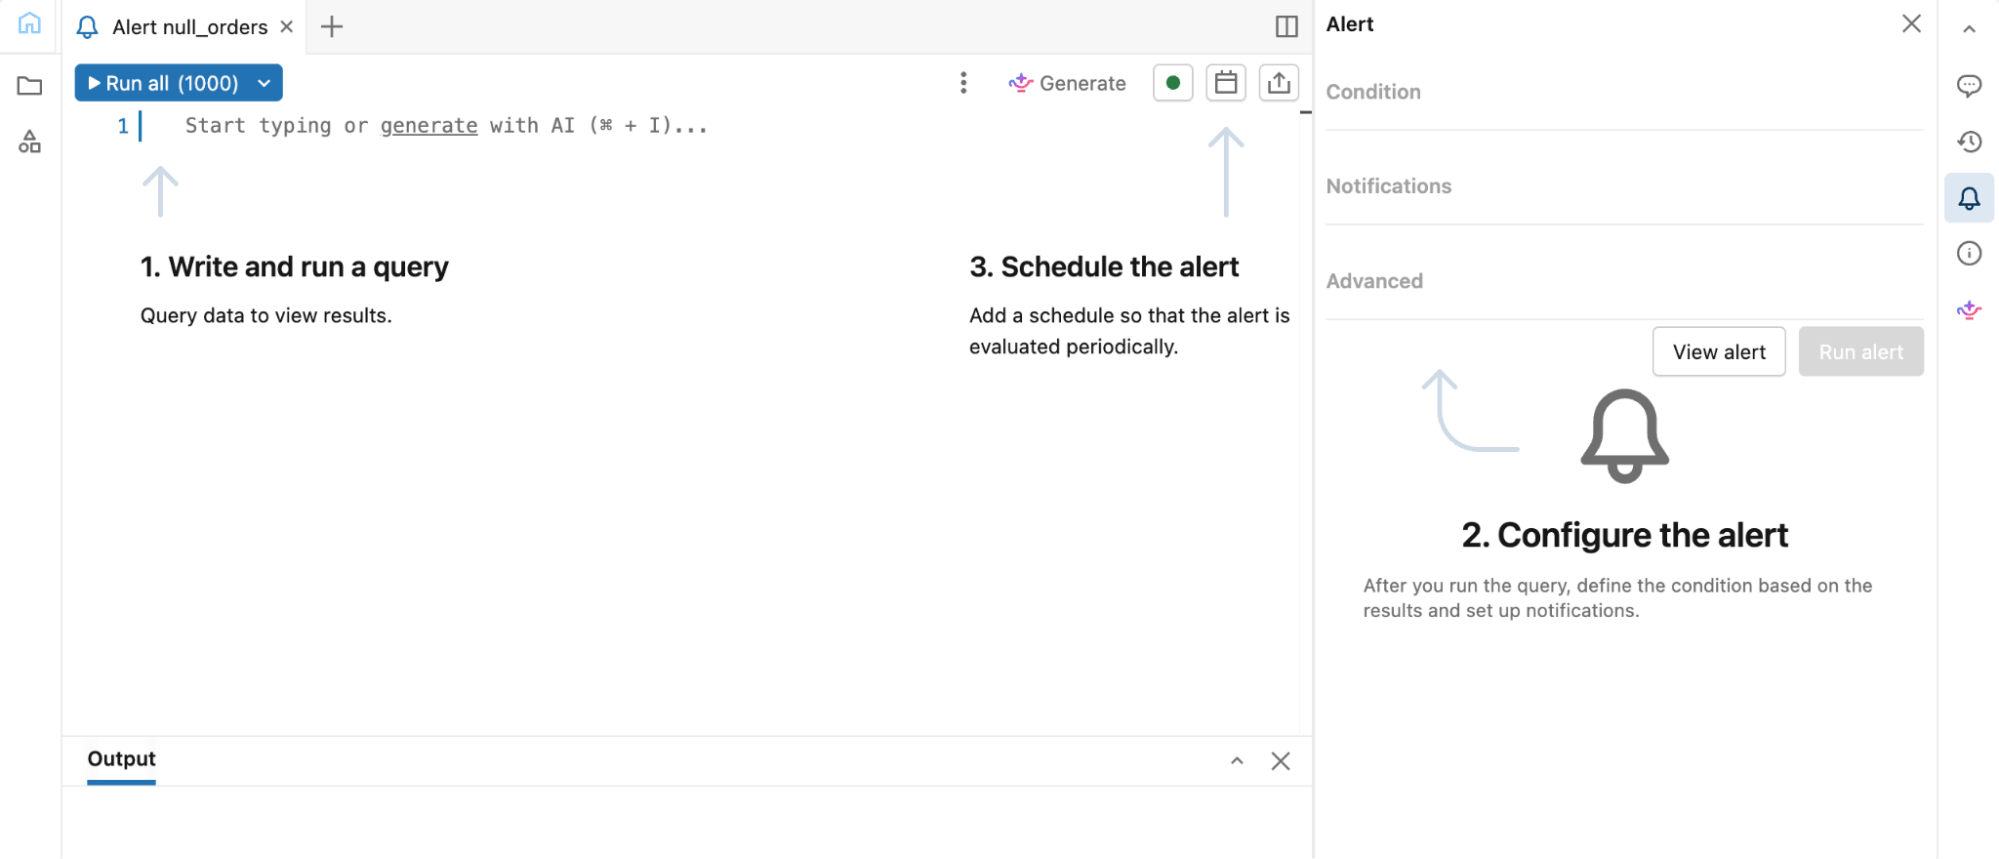
    Schedule and configure an alert

What’s available in GA?

SQL Alerts GA includes everything you need to author, operate, and scale alerts in production:

  • Author alerts in the SQL editor. Define the query, evaluation condition, schedule, and notifications in one flow. You get the full power of Databricks SQL with Genie Code to help you write queries.
  • Run alerts where you need them. Use standalone SQL Alerts to run on their own schedule, or add a SQL Alert task to a Lakeflow Job to evaluate conditions inline with the pipeline that produces the data.
  • Reach the right people the right way. Send notifications to email, Slack, PagerDuty, Microsoft Teams, or webhooks, with rich templates that include Alert evaluation history so recipients can triage faster.
  • Manage alerts as production code. Version alert definitions in Git, deploy them through Declarative Automation Bundles, and automate creation and updates through APIsTerraform, and SDKs.
  • Observe alerts at scale. New Alerts System Tables (in Private Preview) – `system.alert.alerts` and `system.alert.alert_evaluation_history` – surface configuration and evaluation data across your workspace, so teams can audit alerts, analyze trends, and manage workloads at scale.
“The native Databricks integration makes Alerts simple to define and reliable to operate. Having Alert logic, scheduling, and notifications managed in one place - and versioned through Git - helped us standardize monitoring and catch issues quicker, with much less manual effort.” —Tom Potash, Software Engineering Manager at DoubleVerify

Example of using SQL Alerts 

Now let's walk through an example to demonstrate the value of SQL Alerts. A common business-monitoring need is detecting unexpected drops in revenue against recent baselines. This example shows how to create an alert that compares yesterday's revenue against the seven-day average and notifies the right people when the drop exceeds 5%.

Step 1: Write the query in the SQL editor

This query computes yesterday's revenue and compares it to the seven-day average.

Output: A single column, `revenue_pct_change`, that the alert evaluates. This alert would get triggered because the revenue drop exceeds 5%.

Step 2: Configure the condition and notifications

In the editor, set the condition to revenue_pct_change < -5 and add notification recipients. You can also customize the notification template using the rich markdown editor to add more context or next steps in your notification.
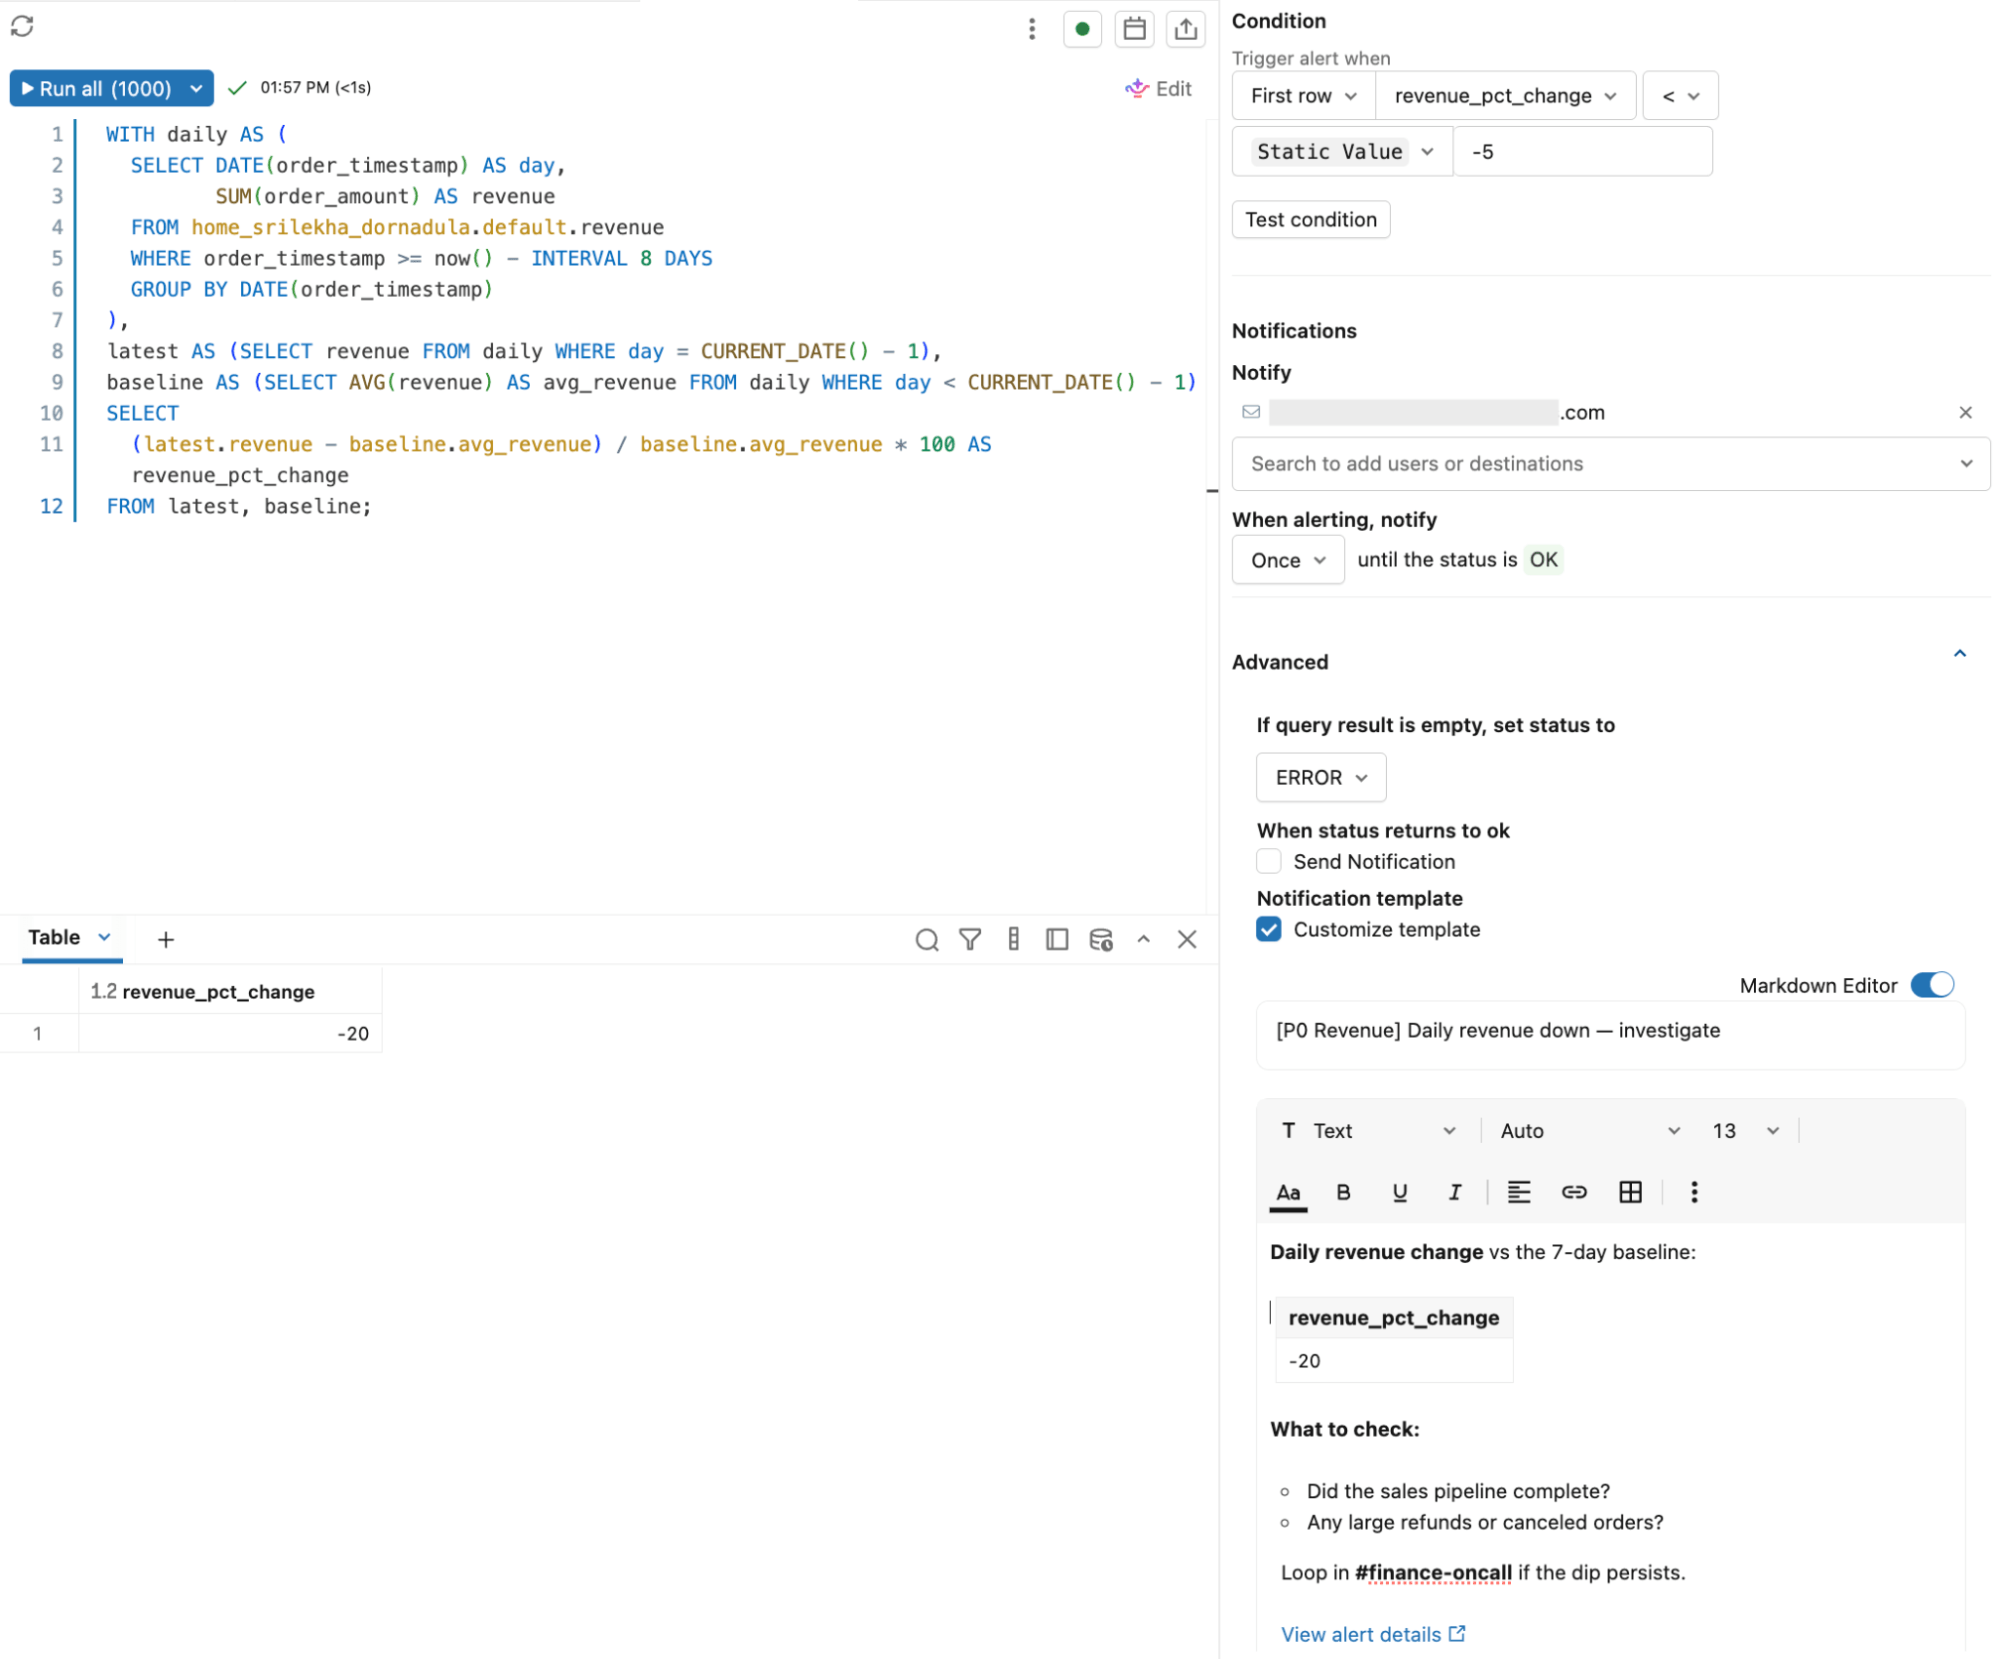
Configure the condition

Step 3: Schedule it

Pick a cadence for evaluation. For example, for a business-critical KPI, daily evaluation ensures changes are caught within 24 hours.

When the alert triggers, recipients get a notification with the alert evaluation status, the result, link to the alert, and recent run history. You can start investigating right away.
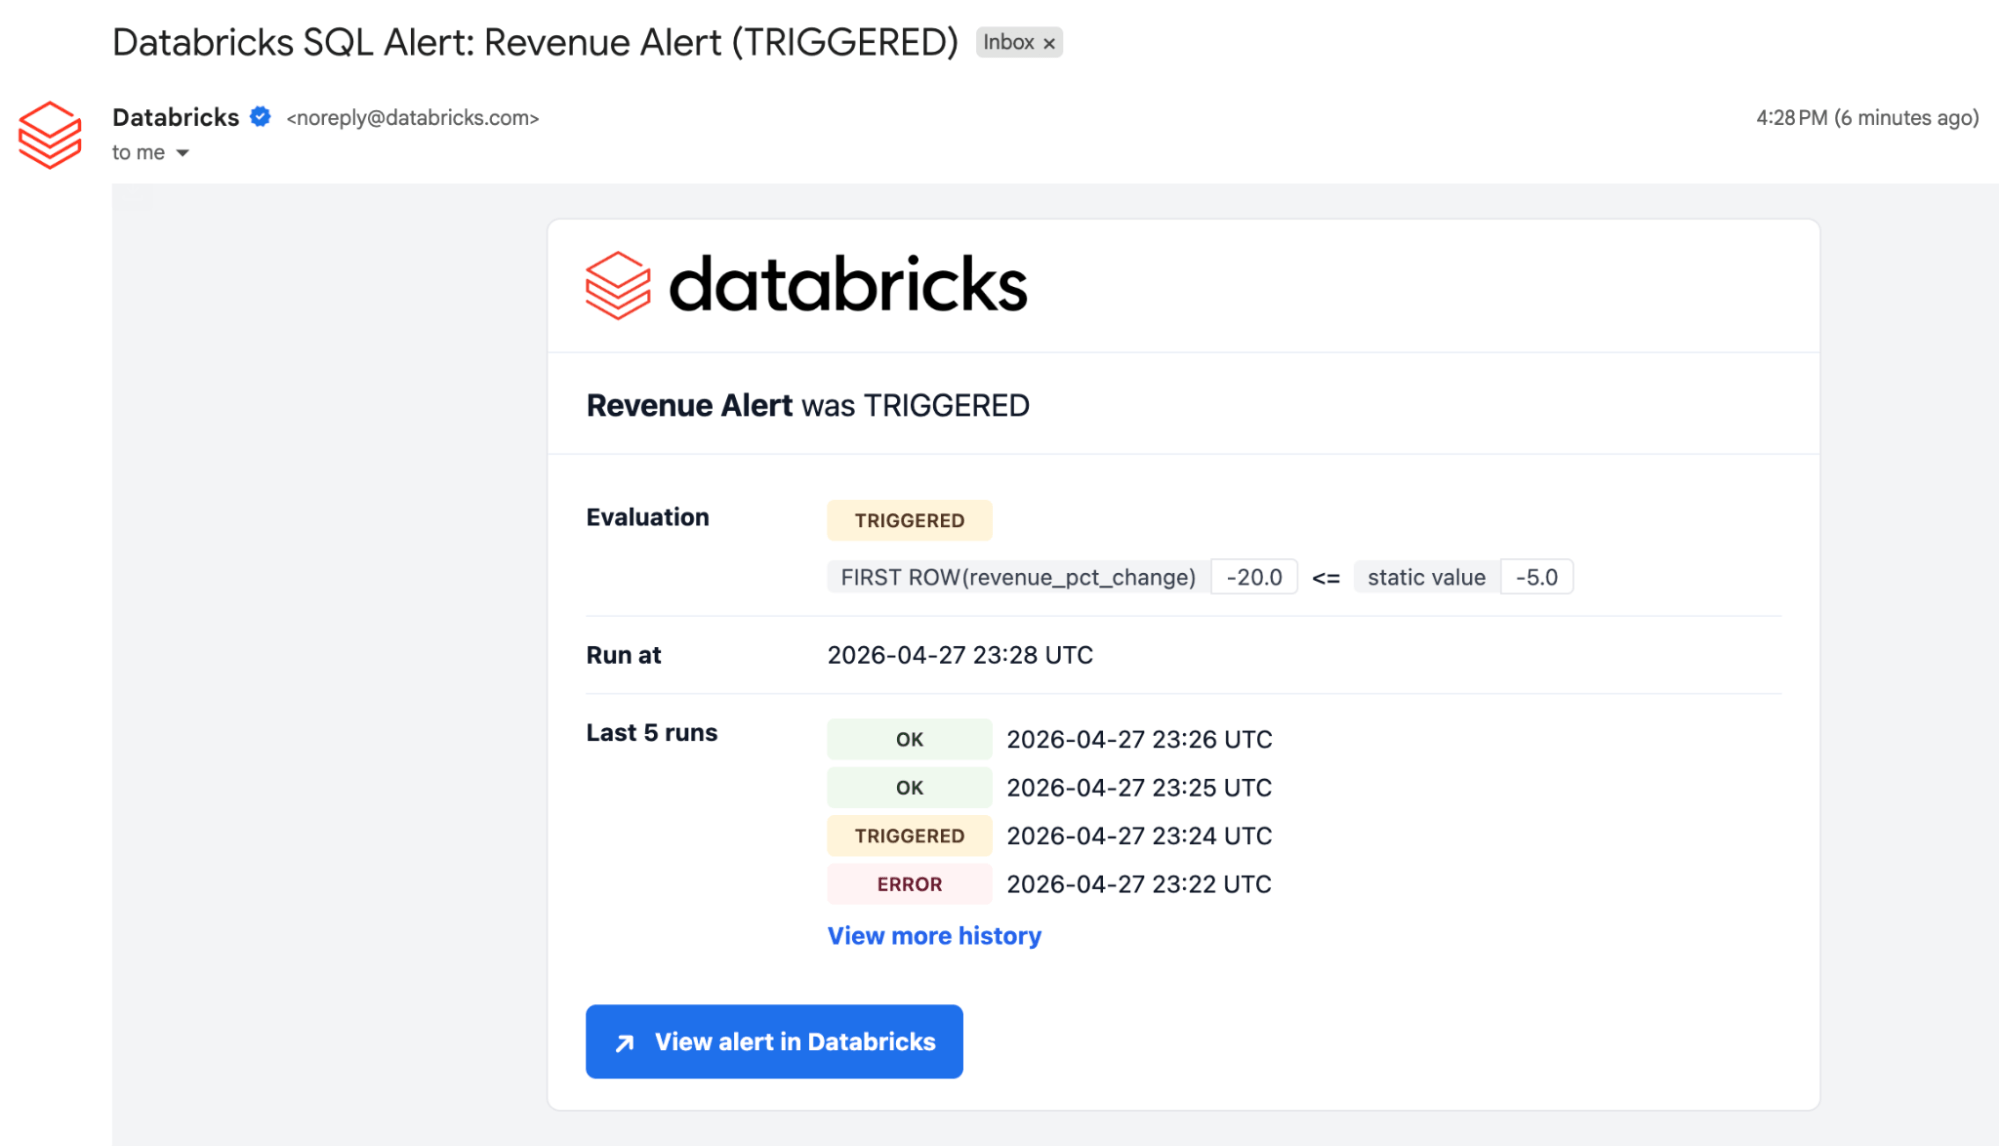
Trigger alert email example

SQL Alerts also includes a comprehensive alert details page with full run history, showing when each evaluation ran, whether the alert was triggered, and notified destinations. This helps teams confirm monitoring is running as expected and triage faster by showing when the alert began triggering. 
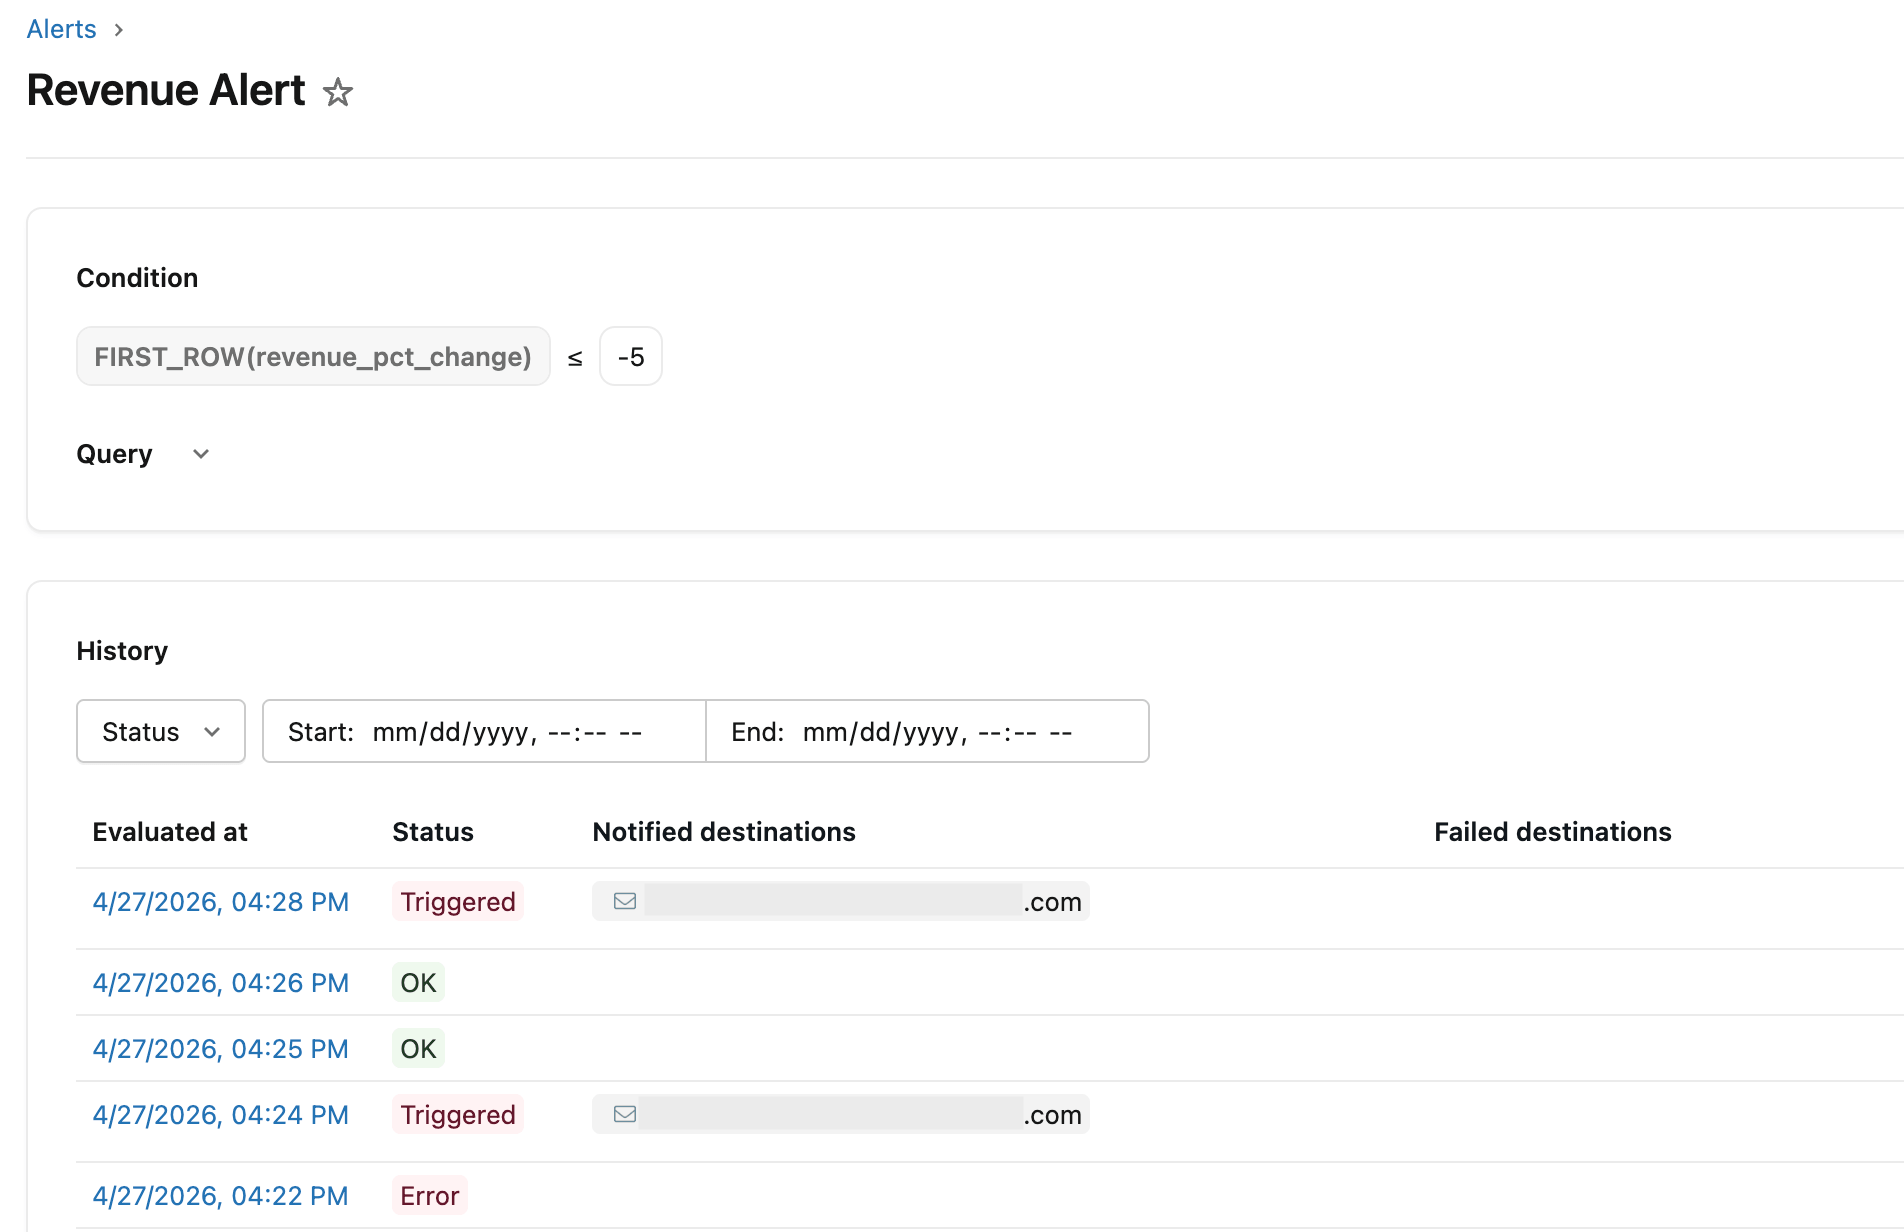
Revenue alert example

Create Alerts with Genie Code (Coming Soon) 

With Genie Code, the walkthrough above becomes a one-prompt experience. Describe the alert you want in natural language ("alert me when daily revenue drops more than 5% week-over-week"), and Genie Code builds an Alert for you end-to-end. You can always ask Genie to make edits, or open the Alerts UI to edit directly.
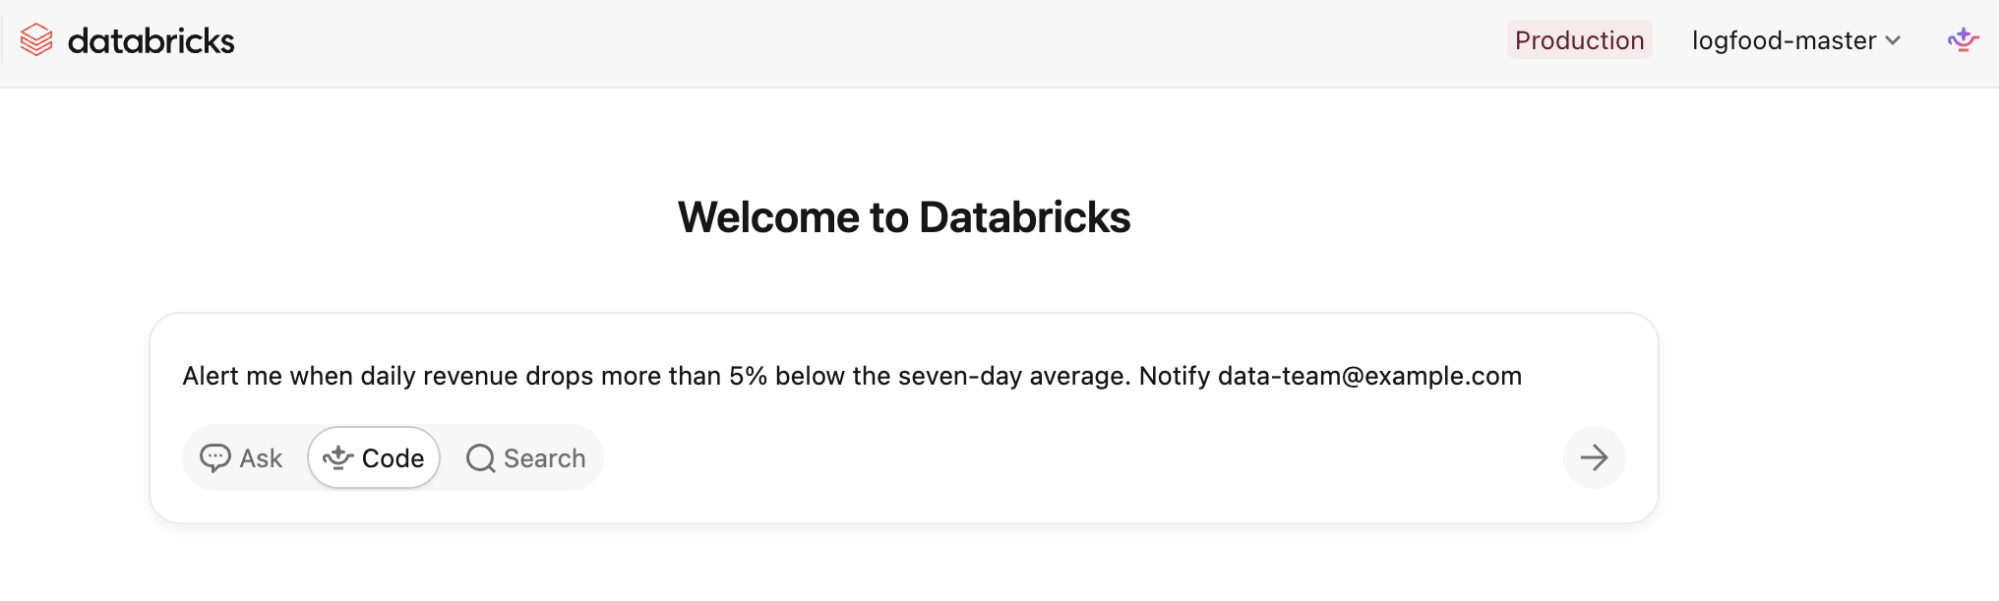
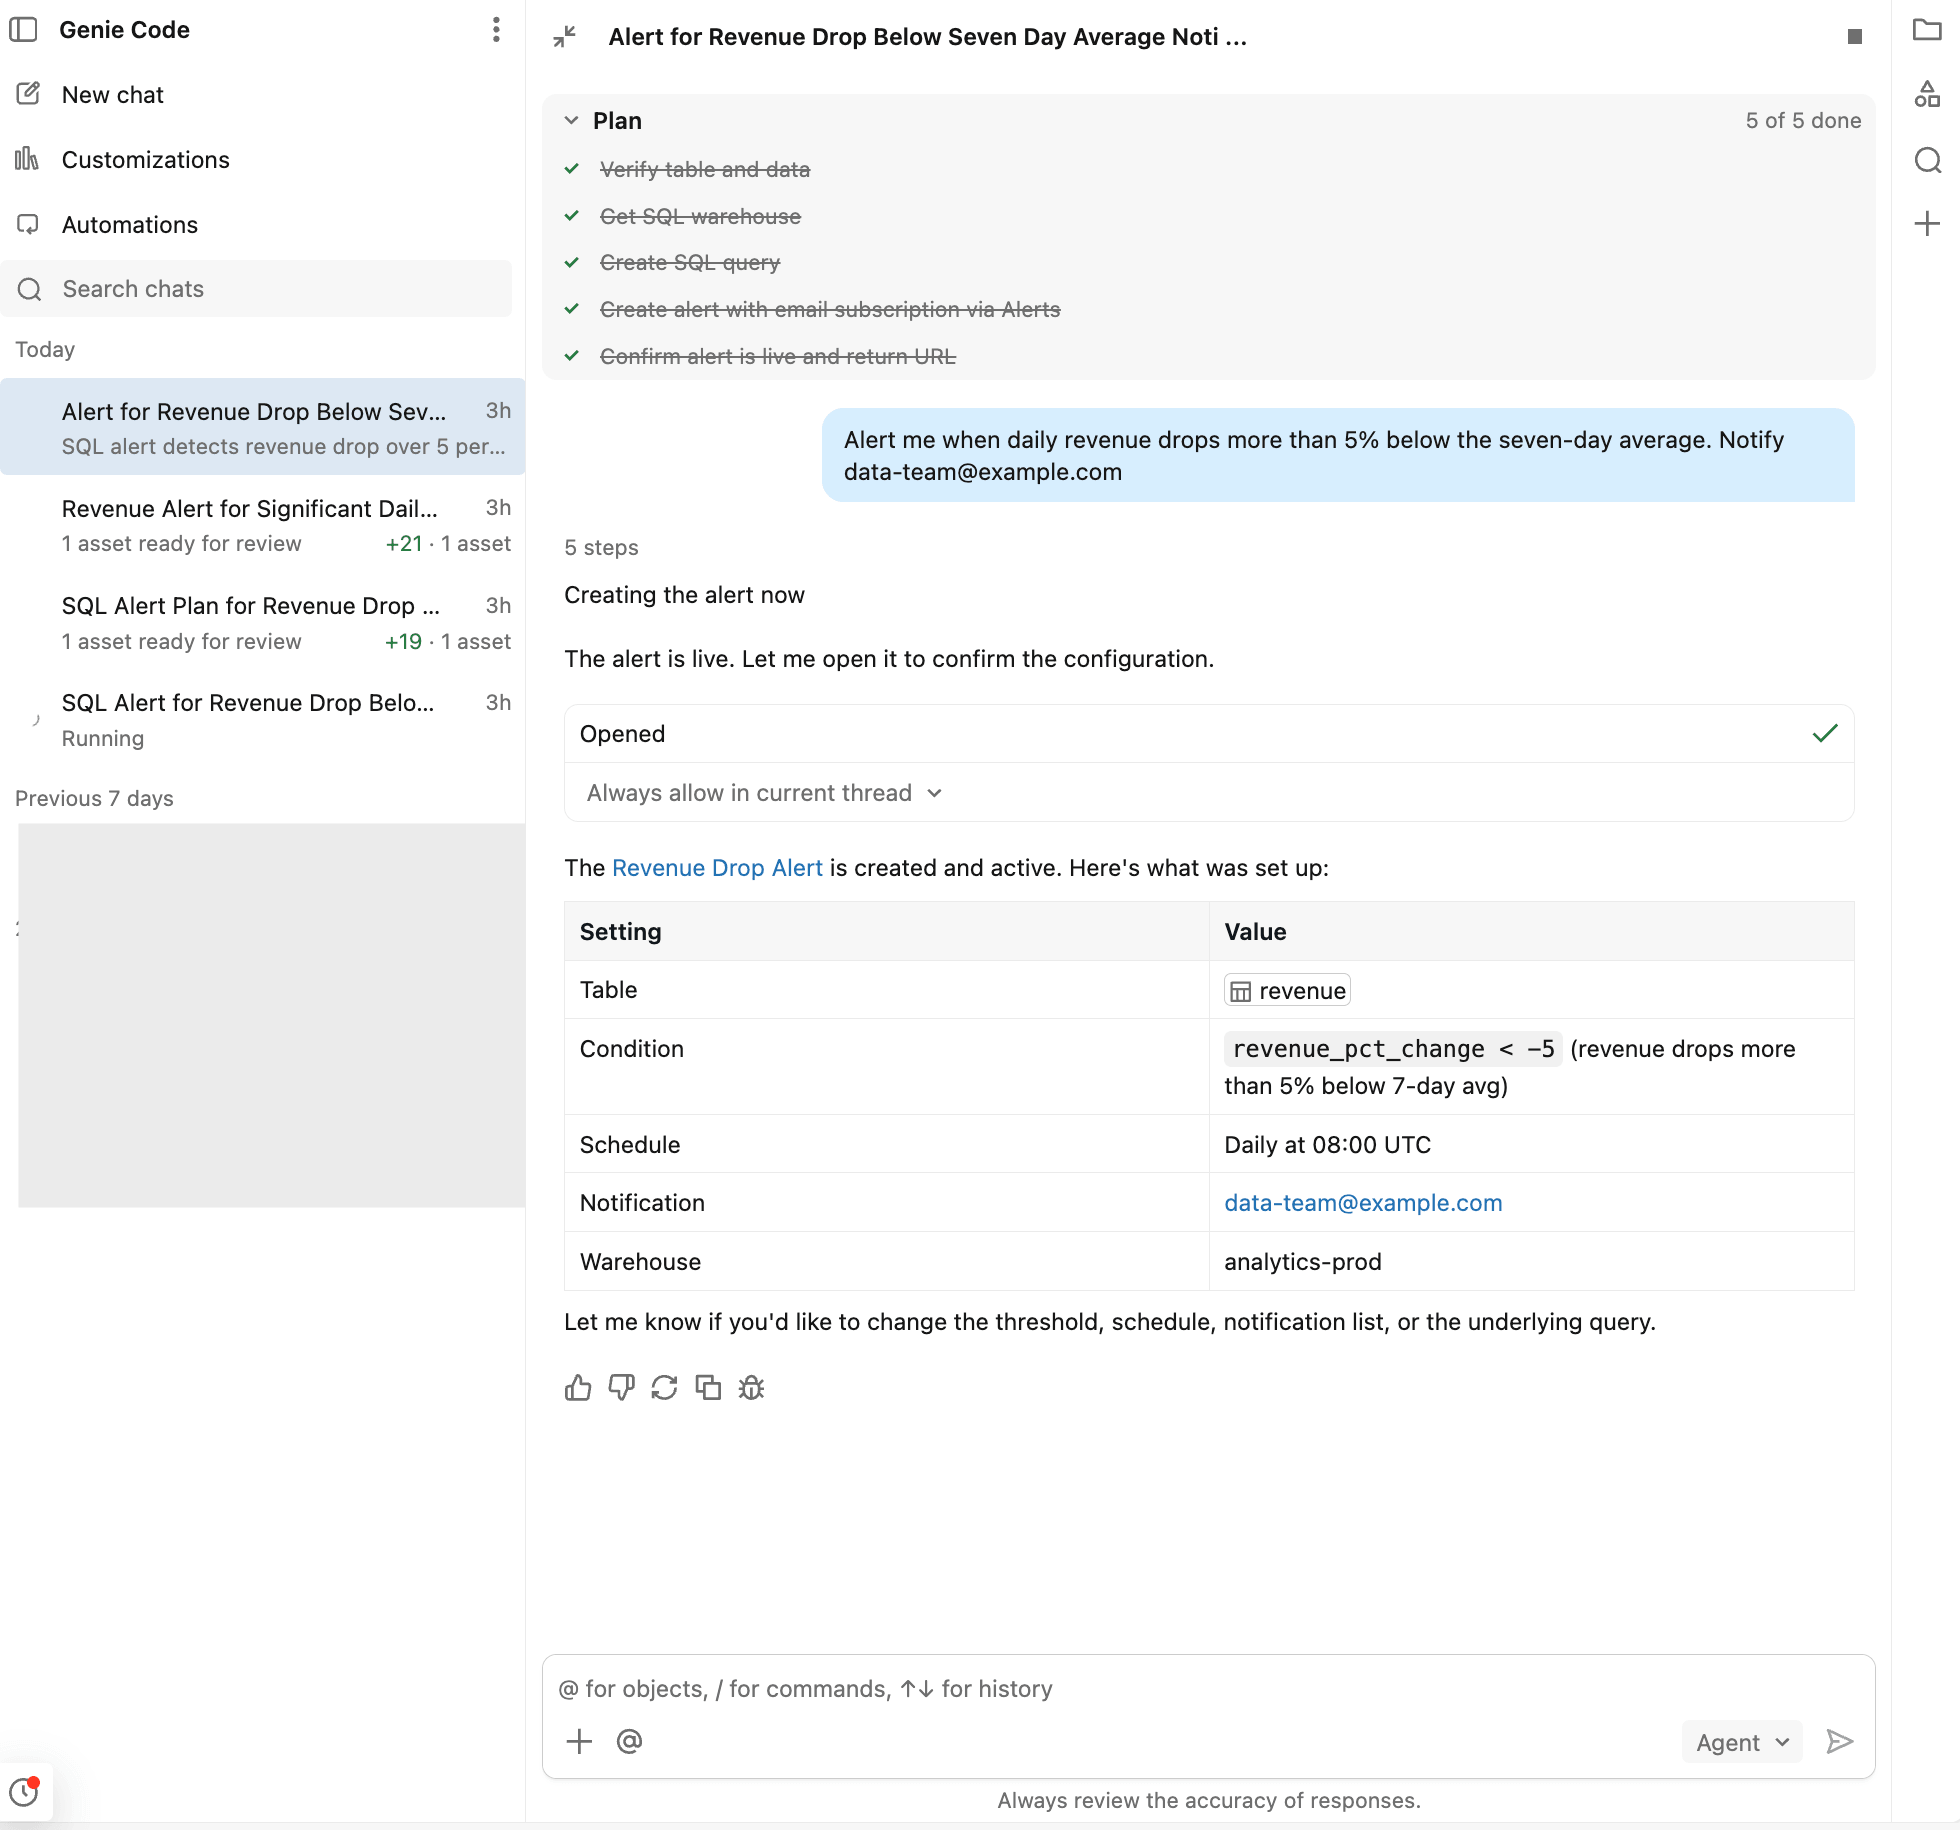
Writing alerts with Genie CodeGenie Code support for alerts

Run Alerts inside Lakeflow Jobs 

Standalone SQL Alerts run on their own schedule, independent of any pipeline. That fits a lot of monitoring use cases: anything that doesn't care when upstream data lands.

But some checks belong inside the pipeline that produces the data: Did this load land complete data? Is this metric sane before we publish it? Should the next step even run? Running those as standalone scheduled alerts means the alert runs on its own schedule, separate from the pipeline that produces the data, and its result can't influence what happens next in the pipeline.

With the new SQL Alert task in Lakeflow Jobs (in Public Preview), you can do exactly that. The same alert object can now run inside your pipelines as a task. It also exposes the evaluation state (OK, TRIGGERED, or ERROR) as a task output value you can reference downstream.
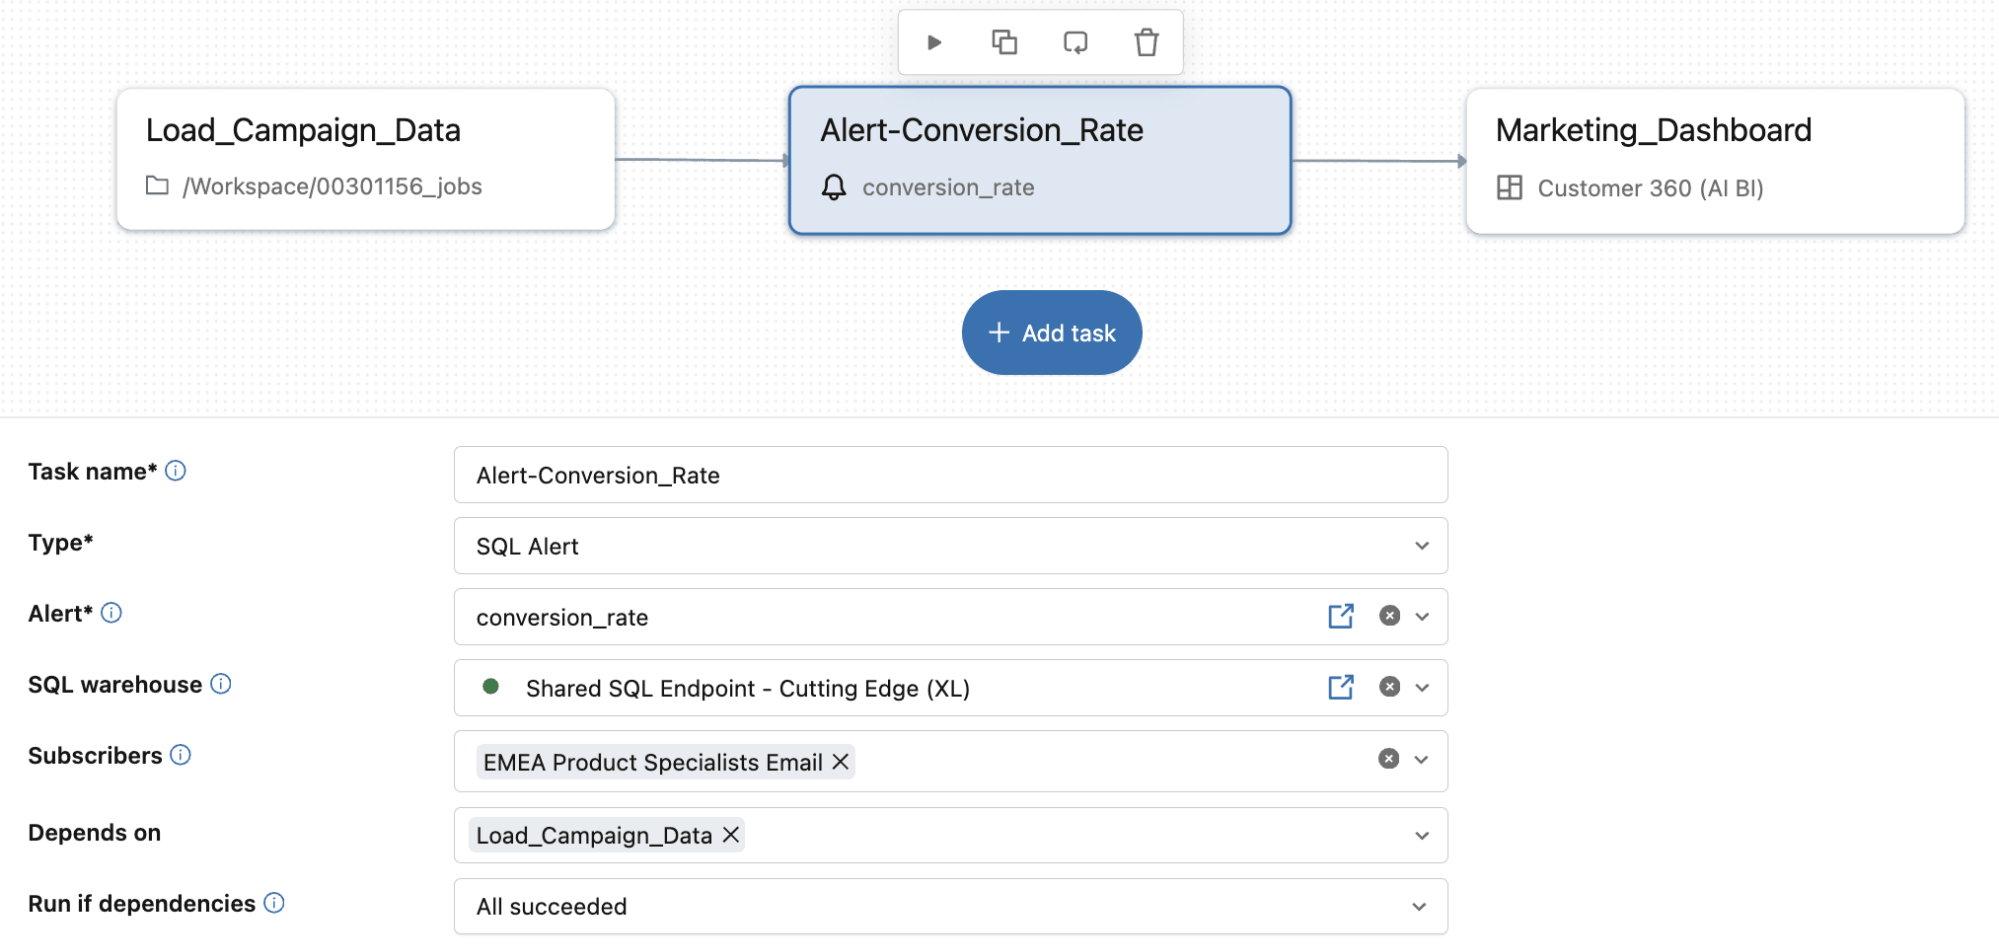
Alerts in Lakeflow Jobs

Example: Detect fraud spikes the moment transaction data lands

A pipeline loads credit card transactions every hour. If the fraud rate spikes after a load, the fraud ops team needs to know immediately to investigate the spike.

Add a SQL Alert task right after the load step to check whether the fraud-flag rate exceeds your threshold. Then add an If/Else task with the condition {{tasks.Alert-FraudRateCheck.output.alert_state}} == "TRIGGERED". If the alert returns OK, the pipeline continues to regular BI reporting. If TRIGGERED, it routes to a diagnostic notebook that generates a breakdown by merchant category and region, and emails the fraud ops team. The same alert object can drive your pipeline flow!
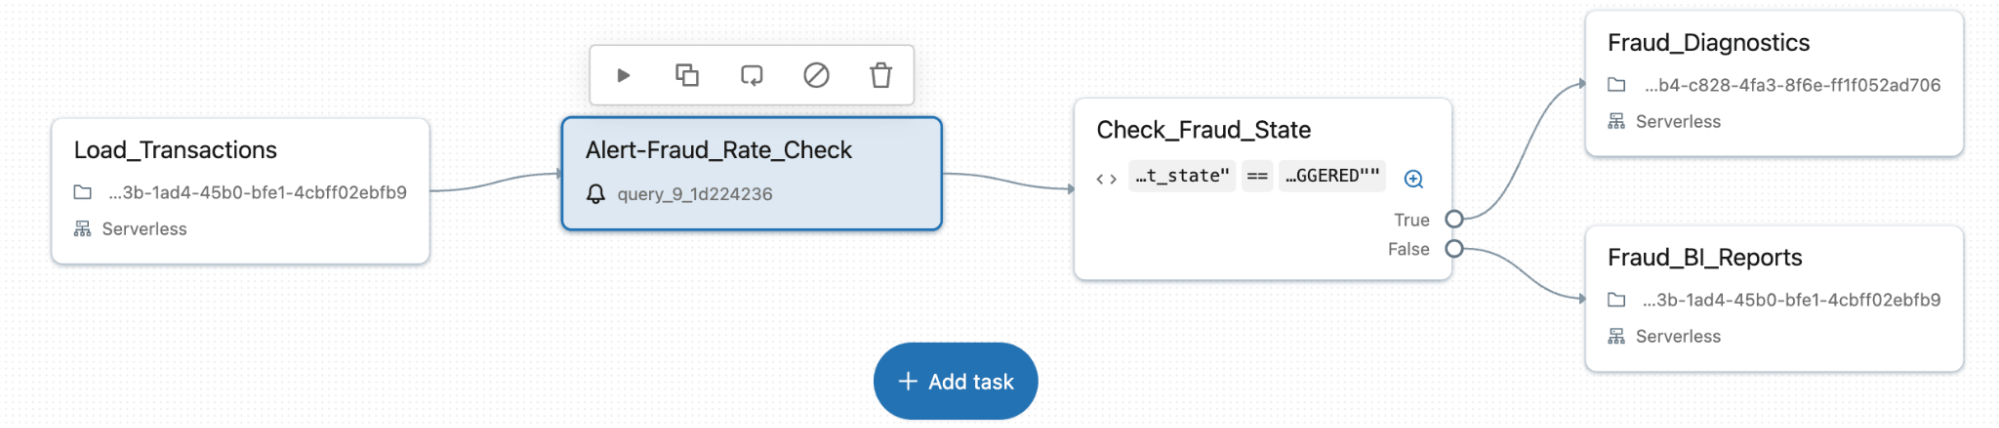
Fraud spike alert example

Operate Alerts reliably in production

As alerting scales across teams and environments, the challenge shifts from creating alerts to managing them reliably over time. SQL Alerts is built to handle production workflows through:

  • Git integration: Alert definitions live in Git, versioned and reviewed alongside the rest of your production code.
  • Declarative Automation Bundles: Provide a structured way to define and deploy alerts alongside other workspace resources, supporting repeatable promotion from development to production.
  • APIsTerraform, and SDKs: Create and manage alerts programmatically through APIs and the Databricks SDK.

Join the 4,000+ customers already using SQL Alerts. Your first alert just takes five minutes to set up. Read through the SQL Alerts documentation and start with a monitoring query you already periodically check manually!