


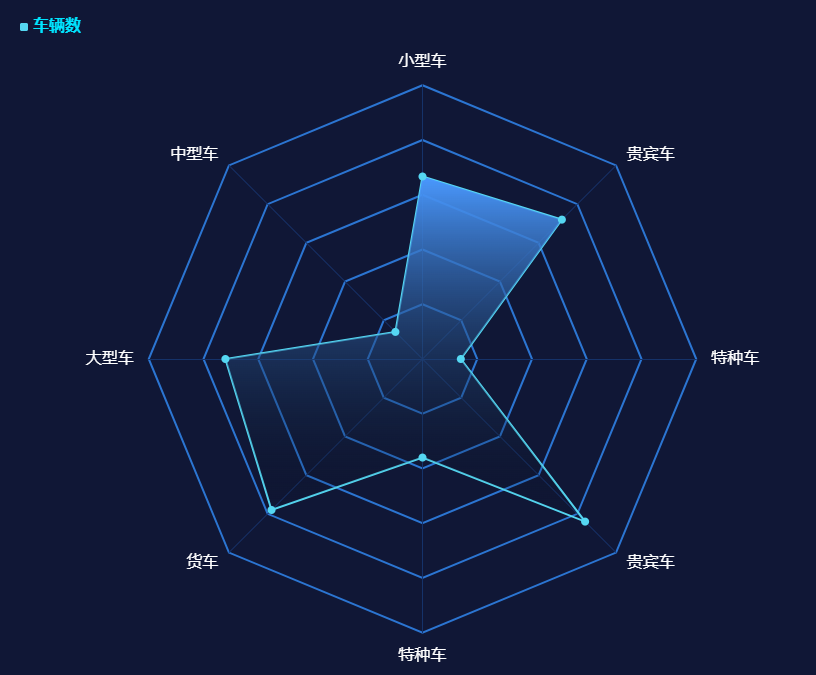
var legendData = ["车辆数"]; //图例
var indicator = [
  {
    text: "小型车",
    max: 6000,
  },
  {
    text: "中型车",
    max: 5000,
  },
  {
    text: "大型车",
    max: 5000,
  },
  {
    text: "货车",
    max: 5000,
  },
  {
    text: "特种车",
    max: 5000,
  },
  {
    text: "贵宾车",
    max: 5000,
  },
  {
    text: "特种车",
    max: 5000,
  },
  {
    text: "贵宾车",
    max: 5000,
  },
];
var dataArr = [
  {
    value: [4000, 700, 3600, 3900, 1800, 4200, 700, 3600],
    name: legendData[0],
    itemStyle: {
      normal: {
        lineStyle: {
          color: "#55d7f2",
        },
        // shadowColor: '#4A99FF',
        // shadowBlur: 10,
      },
    },
    areaStyle: {
      normal: {
        // 单项区域填充样式
        color: {
          type: "linear",
          x: 1, //右
          y: 0, //下
          x2: 1, //左
          y2: 1, //上
          colorStops: [
            {
              offset: 0,
              color: "#4A99FF",
            },
            {
              offset: 1,
              color: "rgba(0,0,0,0)",
            },
          ],
          globalCoord: false,
        },
        opacity: 1, // 区域透明度
      },
    },
  },
];
var colorArr = ["#55d7f2", "#4BFFFC"]; //颜色
option = {
  backgroundColor: "#101736",
  color: colorArr,
  legend: {
    orient: "vertical",
    // icon: 'circle', //图例形状
    data: legendData,
    top: 20,
    left: 20,
    itemWidth: 8, // 图例标记的图形宽度。[ default: 25 ]
    itemHeight: 8, // 图例标记的图形高度。[ default: 14 ]
    itemGap: 22, // 图例每项之间的间隔。[ default: 10 ]横向布局时为水平间隔,纵向布局时为纵向间隔。
    textStyle: {
      fontSize: 16,
      fontWeight: "bold",
      color: "#00E4FF",
    },
  },
  radar: {
    // shape: 'circle',
    name: {
      textStyle: {
        color: "#fff",
        fontSize: 16,
      },
    },
    indicator: indicator,
    splitArea: {
      // 坐标轴在 grid 区域中的分隔区域,默认不显示。
      show: true,
      areaStyle: {
        // 分隔区域的样式设置。
        color: ["rgba(255,255,255,0)", "rgba(255,255,255,0)"], // 分隔区域颜色。分隔区域会按数组中颜色的顺序依次循环设置颜色。默认是一个深浅的间隔色。
      },
    },
    axisLine: {
      //指向外圈文本的分隔线样式
      lineStyle: {
        color: "#153269",
      },
    },
    splitLine: {
      lineStyle: {
        color: "#2b75d2", // 分隔线颜色
        width: 2, // 分隔线线宽
      },
    },
  },
  series: [
    {
      type: "radar",
      symbolSize: 8,
      symbol: "circle",
      data: dataArr,
    },
  ],
};
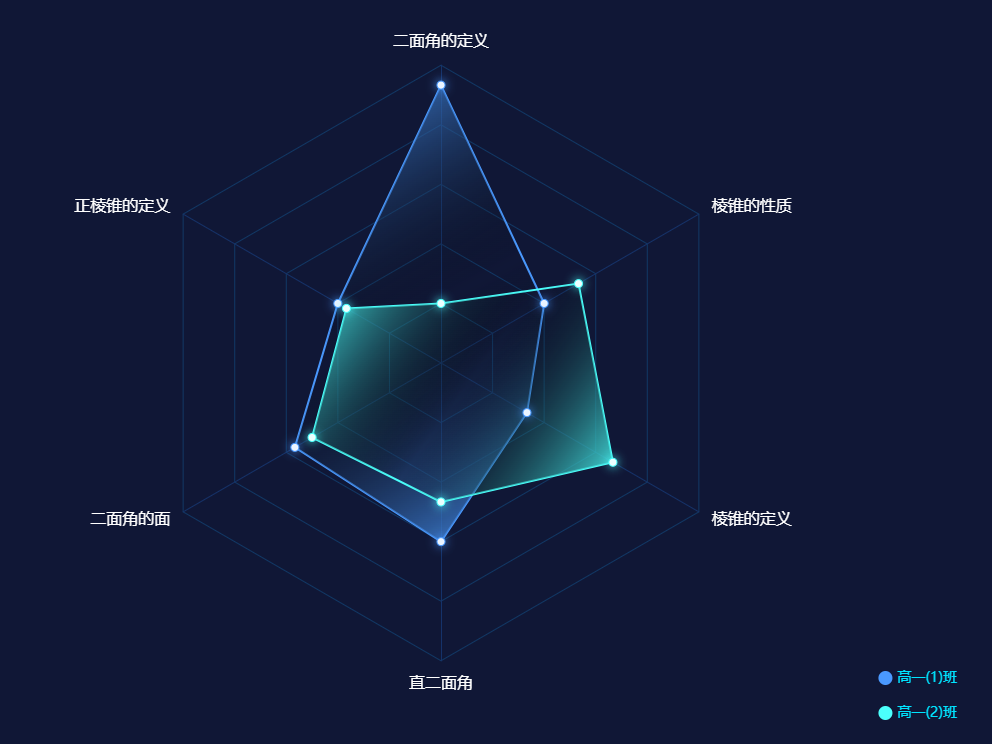
var legendData = ['高一(1)班', '高一(2)班']; //图例

var indicator = [{
        text: '二面角的定义',
        max: 30,
    },
    {
        text: '正棱锥的定义',
        max: 30
    },
    {
        text: '二面角的面',
        max: 30
    },
    {
        text: '直二面角',
        max: 30,
        //  axisLabel: {show: true, textStyle: {fontSize: 18, color: '#333'}}
    },
    {
        text: '棱锥的定义',
        max: 30
    },
    {
        text: '棱锥的性质',
        max: 30
    }

];
var dataArr = [{
        value: [28, 12, 17 ,18, 10, 12],
        name: legendData[0],
        itemStyle: {
            normal: {
                lineStyle: {
                    color: '#4A99FF',
                    // shadowColor: '#4A99FF',
                    // shadowBlur: 10,
                },
                shadowColor: '#4A99FF',
                shadowBlur: 10,
            },
        },
        areaStyle: {
                normal: { // 单项区域填充样式
                    color: {
                        type: 'linear',
                        x: 0, //右
                        y: 0, //下
                        x2: 1, //左
                        y2: 1, //上
                        colorStops: [{
                            offset: 0,
                            color: '#4A99FF'
                        }, {
                            offset: 0.5,
                            color: 'rgba(0,0,0,0)'
                        }, {
                            offset: 1,
                            color: '#4A99FF'
                        }],
                        globalCoord: false
                    },
                    opacity: 1 // 区域透明度
                }
            }
    },
    {
        value: [6, 11, 15, 14, 20, 16],
        name: legendData[1],
        itemStyle: {
            normal: {
                lineStyle: {
                    color: '#4BFFFC',
                    // shadowColor: '#4BFFFC',
                    // shadowBlur: 10,
                },
                shadowColor: '#4BFFFC',
                shadowBlur: 10,
            },
        },
         areaStyle: {
                normal: { // 单项区域填充样式
                    color: {
                        type: 'linear',
                        x: 0, //右
                        y: 0, //下
                        x2: 1, //左
                        y2: 1, //上
                        colorStops: [{
                            offset: 0,
                            color: '#4BFFFC'
                        }, {
                            offset: 0.5,
                            color: 'rgba(0,0,0,0)'
                        }, {
                            offset: 1,
                            color: '#4BFFFC'
                        }],
                        globalCoord: false
                    },
                    opacity: 1 // 区域透明度
                }
            }
    }
];
var colorArr = ['#4A99FF', '#4BFFFC']; //颜色
option = {
    backgroundColor: '#101736',
    title: {
        show: false,
        text: "数学薄弱知识点分析",
        x: "4%",

        textStyle: {
            color: '#fff',
            fontSize: '22'
        },
        subtextStyle: {
            color: '#90979c',
            fontSize: '16',

        },
    },
    color: colorArr,
    legend: {
        orient:'vertical',
        icon: 'circle', //图例形状
        data: legendData,
        bottom:35,
        right:40,
        itemWidth: 14, // 图例标记的图形宽度。[ default: 25 ]
        itemHeight: 14, // 图例标记的图形高度。[ default: 14 ]
        itemGap: 21, // 图例每项之间的间隔。[ default: 10 ]横向布局时为水平间隔,纵向布局时为纵向间隔。
        textStyle: {
            fontSize: 14,
            color: '#00E4FF',
        },
    },
    radar: {
        // shape: 'circle',
        name: {
            textStyle: {
                color: '#fff',
                fontSize: 16
            },
        },
        indicator: indicator,
        splitArea: { // 坐标轴在 grid 区域中的分隔区域,默认不显示。
            show: true,
            areaStyle: { // 分隔区域的样式设置。
                color: ['rgba(255,255,255,0)', 'rgba(255,255,255,0)'], // 分隔区域颜色。分隔区域会按数组中颜色的顺序依次循环设置颜色。默认是一个深浅的间隔色。
            }
        },
        axisLine: { //指向外圈文本的分隔线样式
            lineStyle: {
                color: '#153269'
            }
        },
        splitLine: {
            lineStyle: {
                color: '#113865', // 分隔线颜色
                width: 1, // 分隔线线宽
            }
        },
    },
    series: [{
        type: 'radar',
        symbolSize: 8,
        // symbol: 'angle',
        data: dataArr
    }]
};
此内容由惯性聚合(RSS阅读器)自动聚合整理,仅供阅读参考。 原文来自 — 版权归原作者所有。