





moth //
I’ve been diving deep into Linux lately, with my latest kick being exploring the Linux kernel. I’ve found “The Linux Programming Interface” (TLPI) by Michael Kerrisk, among others, to be a fantastic reference manual that covers the application of system calls (syscalls). For a quick primer on Linux syscalls, check out the introductory Linux manual page on the subject by using the man 2 intro command in a terminal (or viewing the page online). While reading through TLPI, I found myself yearning for a deeper exploration into the implementations of the syscalls themselves. To that end, I’ve lately been reading a lot of kernel source code and chaining bits of code together to get a better understanding of what some things do. My first port of call was a way to detect when a given syscall was used and a way to see what information was passed to it before it was executed. As an extension of the overarching adventure, I ultimately wanted to have a Loadable Kernel Module (LKM) that would listen for a given syscall and, at the very least, log that the syscall was observed. Ideally, the module would also print some detailed information about the call’s arguments. What I’ve ended up with is a piece of code that I can extend to monitor arbitrary syscalls, as well as a mechanism to investigate Linux kernel security.
Some initial research led me to a kernel tracing facility called Kprobes, which can be used to hook most kernel symbols. From what I understand, registering a kprobe in the kernel causes it to be inserted immediately before the target symbol in memory, saving the symbol’s information in the process. The registered kprobe then executes any code written in kp->pre_handler, runs the instruction, then executes whatever you may have written in an optional kp->post_handler. I think the Kprobes facility is wicked cool, and I will certainly return to it at some point, but it wasn’t immediately useful (or so I thought) in giving me a look into when specific syscalls are used, and my initial probing resulted in mostly garbage in the log.
More research eventually led me to kallsyms, which is a facility used to extract kernel symbols. I found a snippet of code that seemed to do exactly what I needed. Using the kallsyms_lookup_name() function, the kernel module looks up the address of the system call table. By using the address of the table, you can temporarily replace the syscall’s definition (after enabling read/write access to the table, courtesy of an answer on Stack Overflow) with your own definition, which in my case just includes a printk to write to the log file when the call is used. I know that I’ve only scratched the surface of what can be done with this facility, but a deeper investigation can (and hopefully will) happen some other time.
So, I compiled the module and tried loading it. It compiled successfully (good sign), but trying to load the module gave me a strange error (bad sign):
ERROR: modpost: "kallsyms_lookup_name" [/home/moth/.../watcher.ko] undefined!
Cool. No clue why kallsyms_lookup_name is undefined, but I’ll have to look into that.
After some additional research, I happened upon an answer. It turns out that since kernel version 5.7.0, the kernel no longer exports that symbol globally. With that knowledge, I now have to find an alternative solution.
I found an issue on a kernel hacking GitHub repository discussing the same thing I was running into and the folks in the thread hashed out something truly glorious. Remember kprobes and how they weren’t immediately useful for this project? Just kidding — turns out that facility is incredibly useful, just not in a way I had initially expected. One of the things you get back in a kprobe structure is the address, which is where the probe lives in memory. Maybe you can already see where this is going. We can use a kprobe to retrieve the address of the kallsyms_lookup_name() function, because kprobes can see basically any kernel structure. We can then treat the address of that kprobe as the function itself, circumventing the need for the kernel to expose it to us at all.
That should be everything needed to make a working proof of concept. Baking the bits of code I found into the module, it can now be used to read/write the syscall table and insert a handler into whatever syscall I want to look at. For now, I’ve been targeting getuid() as it’s relatively simple. In one terminal window, I insert the module with insmod, run the id command (which relies on the getuid() syscall, and then remove the module with rmmod.
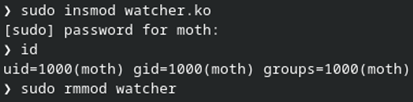
Pretty straightforward so far. In another terminal where I have dmesg -wH running, I see the module setup info, including the addresses of kallsyms_lookup_name(), sys_call_table, and the getuid() syscall. The module then sees three getuid() calls before quieting down. A handful of seconds later, I run the id command and the syscall is identified and logged. Another handful of seconds after that, I run rmmod, which results in the remainder of the intercepted syscalls.
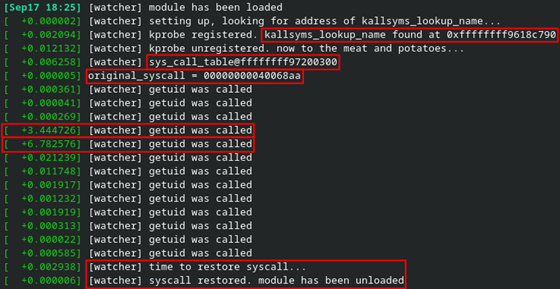
I wasn’t immediately sure where the other getuid() calls were coming from, but I eventually realized that it was most likely due to my use of the sudo command to insert or remove the module.
This seems to work incredibly well and I have ideas for extending it into something more useful for other potential projects. Also, the dmesg output isn’t very useful on its own right now, so the next step will be to output register values and any other relevant information I can think of.
There’s an important caveat I need to make here. The Kprobes facility is a feature which can optionally be disabled. In case it’s not enabled, and you are feeling adventurous, you can compile the kernel with the options specified in the Kprobes documentation to make sure you can load modules to play with the facility. Red Hat flavors seem to have the requisite features enabled by default. Your mileage may vary depending on Debian (or any other) flavors.
Overall, this has been a fun exercise and an excellent learning experience. Is it the most useful thing in the world? No. Are there other more robust solutions available? Almost certainly. I think SystemTap would fit the bill nicely. That said, understanding how to hook into the kernel, as well as everything else learned throughout this project, will be invaluable as I work on other projects going forward.
Speaking of other projects going forward… what’s next? Beyond my original goal of deepening my understanding of Linux system calls, I’ve now found a way to overwrite system calls (as well as other kernel structures) with seemingly anything I want. Beyond simple monitoring, how might I be able to extend (and inevitably break) syscall functionality? Further still beyond the syscall table, what other sorts of kernel structures and memory can I overwrite? And, crucially, what will this do to my poor computer? I didn’t expect an evening of tinkering to result in any of this, but I’m excited to see what I can come up with.
Alright, enough of the human words. It’s time for some computer words. You can find the module code here if you’re interested. Please note the links listed in the comments, as I wouldn’t have gotten this far if I hadn’t found them.
Ready to learn more?
Level up your skills with affordable classes from Antisyphon!
Available live/virtual and on-demand
此内容由惯性聚合(RSS阅读器)自动聚合整理,仅供阅读参考。 原文来自 — 版权归原作者所有。