








When it comes to web performance, you may think of techniques like compression, asset optimization, or even HTTP caching. These are really important, and there's plenty of existing resources covering ways to fix or implement them. However, some less-discussed performance bottlenecks can severely impact website speed. In this post, we'll discuss three issues that often originate from inefficient JavaScript patterns:
While these are not new problems, modern web practices and web frameworks can exacerbate these issues, putting them in the spotlight once again.
Note: These issues can also stem from other sources, such as CSS. For example, a long task can be caused by a complex CSS selector that takes a long time to match elements. However, the focus of this post is on JavaScript.
Here's more information on each bottleneck, along with high-level commentary on addressing such performance issues.
Long tasks occur when there's constant main thread activity that blocks the browser for 50ms or more. Note that many JavaScript and browser rendering tasks are performed sequentially while on the main thread.
When the main thread is busy, it cannot handle user interactions, or do other important rendering tasks. This can lead to noticeable delays in page responsiveness.
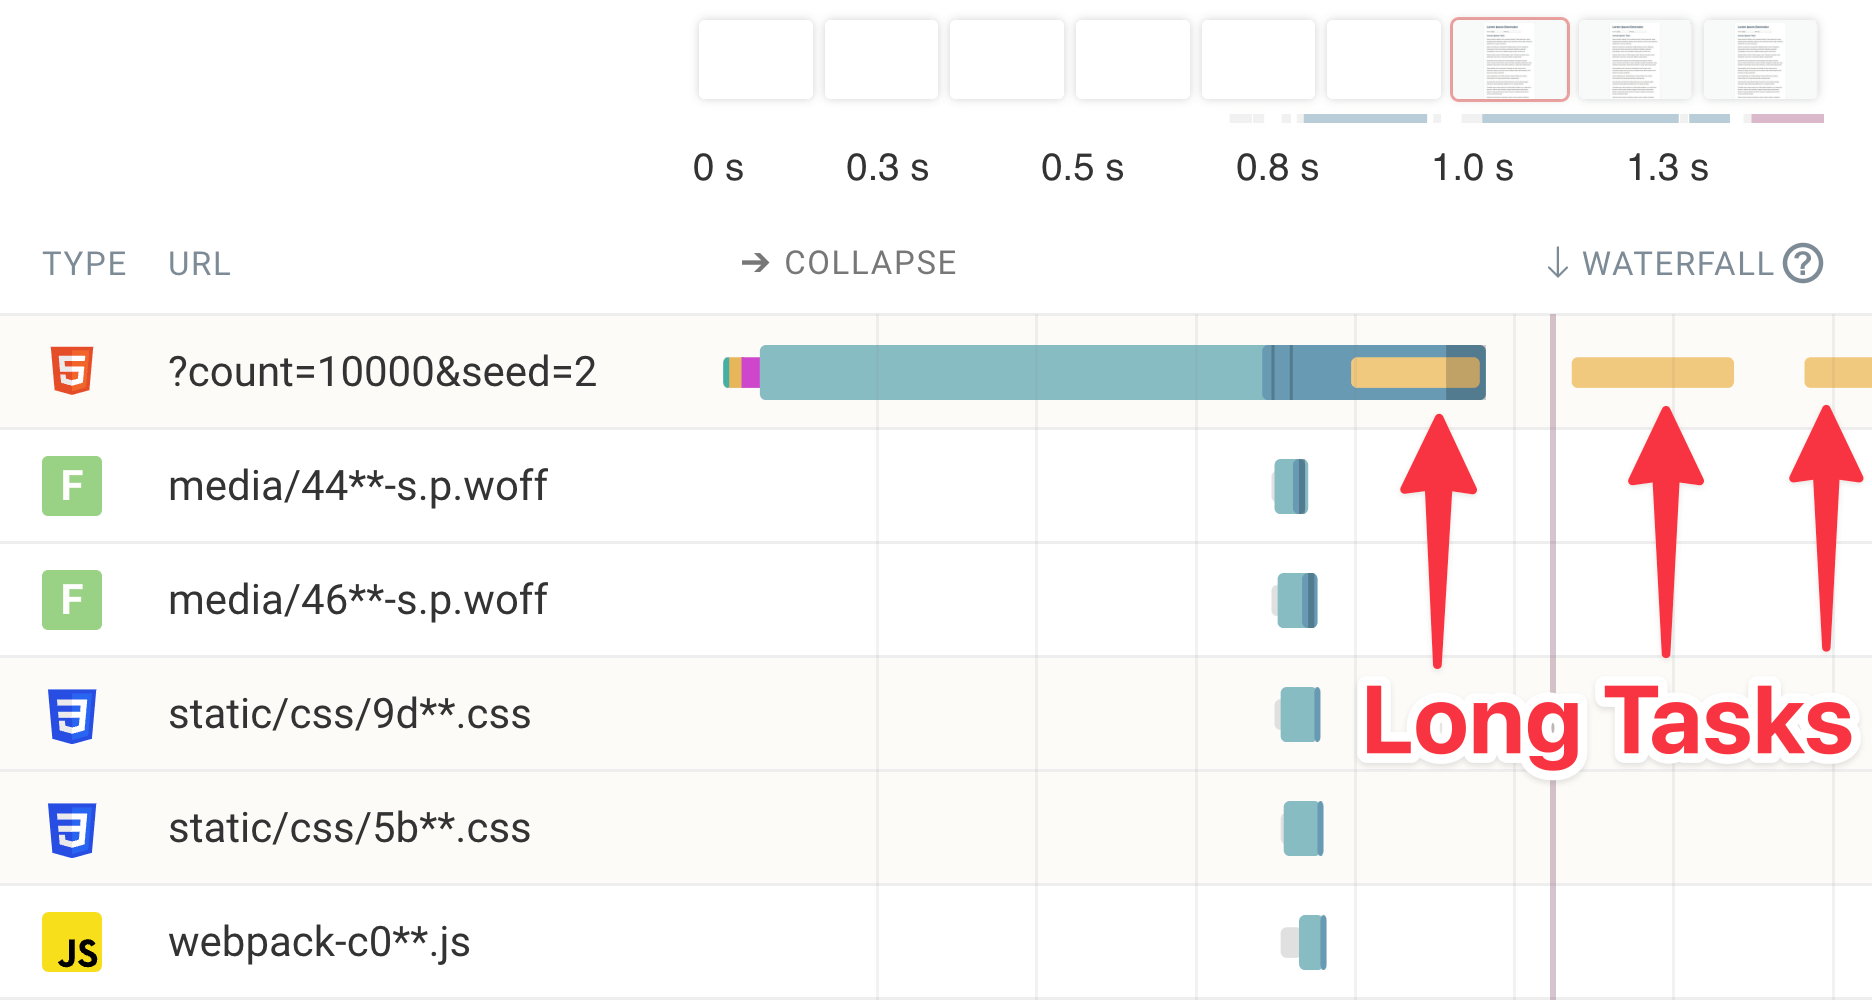
Let's run a website speed test on a Next.js page. This page is server-rendered and then hydrated on the client. Interestingly, the page shows that the user saw useful content quite early on, in spite of the large HTML payload.
The lab-based test that captures this page load shows an acceptable Largest Contentful Paint (LCP) time, and no Cumulative Layout Shift (CLS). This simplified diagram shows what happens when a user interacts during a long task.
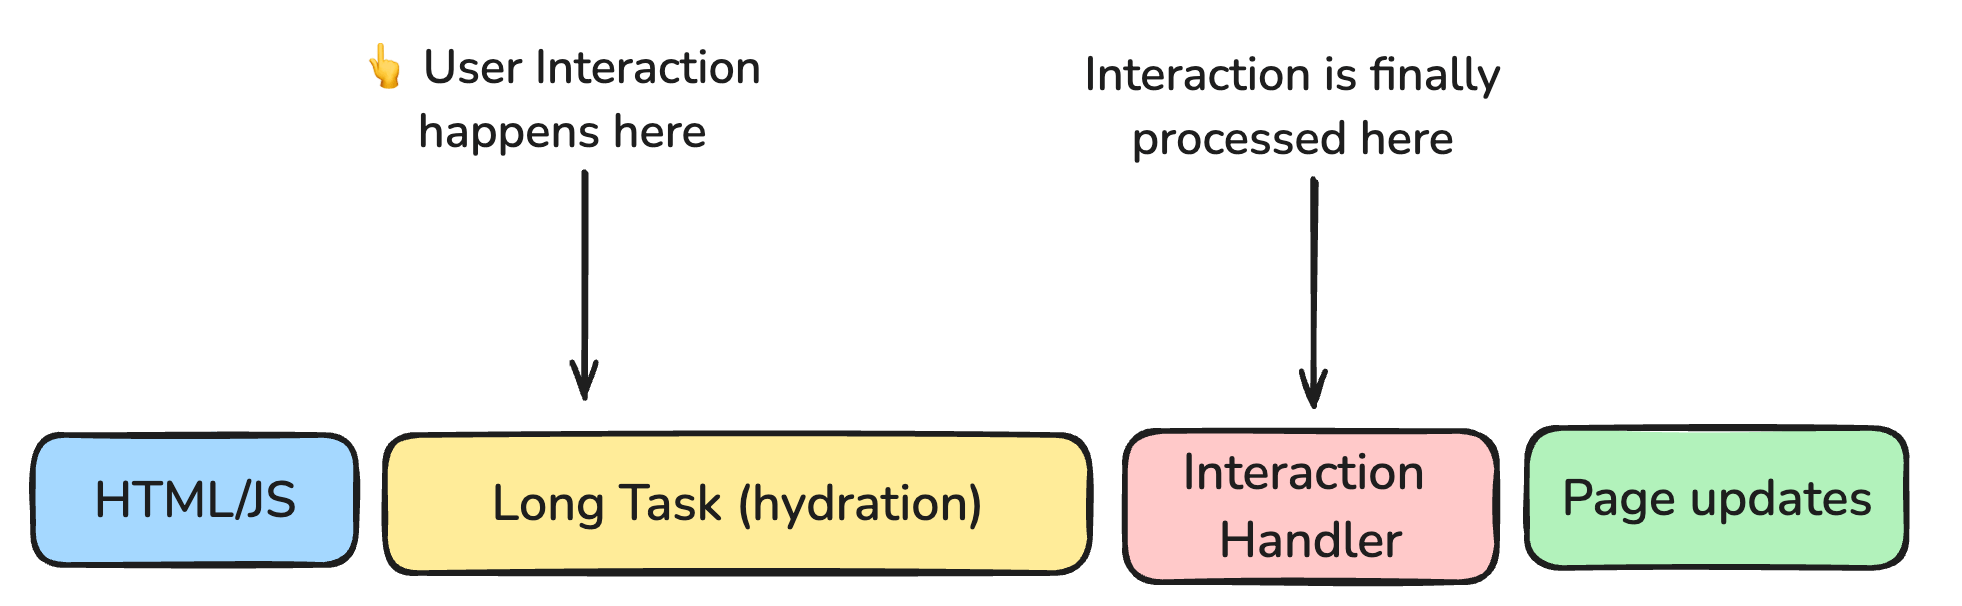
The problem here is that even content may be loaded in a timely manner, the page was not interactive for a long time as the browser was busy parsing and executing the JavaScript. During the slow hydration process, the user saw content that appeared to be interactive, but was not. This meant that the page appeared 'frozen' while the user was trying to interact with it.
This example is particularly interesting because it puts emphasis on parse and execution times, not just download times.
Yield to the main thread: Break up your work into smaller, manageable tasks. This effectively gives the browser a break, allowing it to handle user interactions and rendering. You can learn more about this technique in our article on using the Scheduler API.
Use Web Workers: While it might not make your code run faster, Web Workers allow you to run JavaScript in the background, keeping your main thread free for user interactions and rendering.
Optimize your rendering patterns: Implement techniques like:
As a general performance strategy, you should minimize main thread work and activity.
A large bundle size refers to the total amount of JavaScript code that needs to be downloaded, parsed, and executed when a user visits your website. The 'bundle' is a JavaScript file that contains your application code, along with any dependencies. Oversized JavaScript bundles can lead to several issues:
The last point is also an issue for user interactions. Users interact with pages expecting immediate feedback, but if the browser is busy parsing and executing JavaScript, it can't respond to user input.

The previous screenshot shows a page that has a number of large JavaScript bundles. The page rendering is blocked by:
Here are some powerful web platform features that can replace common JavaScript implementations:
And here are some additional web platform features to be aware of. You can start to try these out, but be mindful that they don't have cross-browser support yet. If you use these features, you should check that your website continues to be usable on browsers which don't yet support such features.
JavaScript bundle sizes used to be easier to understand.
Developers knew what went into them; they consisted of the developer's own code, the framework's code, and third-party library code.
All these parts were combined into one file (like app-v123.js) during the build process.
This made it simpler to identify what was causing large file sizes.
However over time, JavaScript web frameworks introduced server-side rendering. This new approach created a different kind of HTML response, leading to hydration issues.
Hydration is the process of attaching JavaScript functionality to server-rendered HTML, making the HTML interactive on the client-side. Popular frameworks like Next.js use certain hydration techniques by default.
While hydration can complement server-side rendering (SSR) capabilities, it can introduce performance challenges:
You should always consider the impact of popular JavaScript frameworks and libraries on performance. The abundance of resources, tutorials, and starter kits for popular frameworks can sometimes lead developers to choose them without fully considering the performance implications.
For some web developers, creating a website with a JavaScript framework is the default choice, no matter the use case. Framework popularity does not always translate to better UX, so you must balance developer ergonomics, maintainability, and user experience.

Debugbear's HTML Size Analyzer is particularly useful as it breaks down the size of the HTML document, showing the size of the initial HTML payload and the size of the hydration payload. The previous screenshot shows that the large HTML document is largely due to:
It's not a coincidence that the JSON data is the same size as the paragraph text. This is because the JSON data is a serialized version of the paragraph text. This duplication is a common issue with hydration payloads.
Here are some avenues you can explore to improve the performance of web apps that have issues with hydration. You should be aware that using one of these techniques can involve significant architectural changes, and in some cases, can involve moving to a different JavaScript framework.
Progressive hydration / Selective hydration: Prioritize hydrating the most critical parts of your application first, deferring less important components until later.
Islands architecture: Implement "islands" of interactivity within a sea of static content, reducing the overall hydration cost. With islands architecture, you typically use directives to mark which islands should be hydrated.
Resumability: Instead of rebuilding the entire DOM, explore frameworks that can "resume" the server-rendered state more efficiently. At times, almost no JavaScript is sent down during page load, but the necessary JavaScript is fetched and executed when needed, such as on user interaction.
Consider ditching complex frameworks, and instead use a server-side rendered application with vanilla client-side JavaScript:
For example, you can use:
When you combine these tools with effective caching strategies and page preloading, you can create highly performant web applications without sacrificing functionality and user experience.
The Interaction to Next Paint (INP) metric measures how quickly a website responds to user input. If the page freezes for half a second after an interaction, then the page will not feel responsive to the user. INP can be calculated in the browser using the Event Timing API or using a library like web-vitals.js.
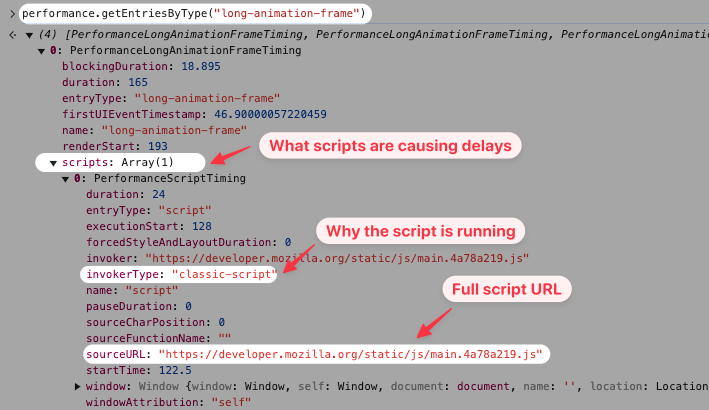
When an interaction causes rendering delays, the Long Animation Frames API can tell you what specific scripts were responsible.
Every time there's a rendering delay a PerformanceEntry with the type long-animation-frame is recorded.
You can access these events like this:
performance.getEntriesByType("long-animation-frame");
The invokerType tells you why the script was running.
In the example below the value is classic-script, which means the processing occurred during the initial evaluation of the script file.
DebugBear real user monitoring can visualize this data for visitors on your website, showing when different scripts were running during the interaction.
You can also see what page element the user interacted with and when the interaction occurred. If the user interacts with a page soon after loading this often causes additional delays, as some parts of the page are still loading, which will delay event handlers.
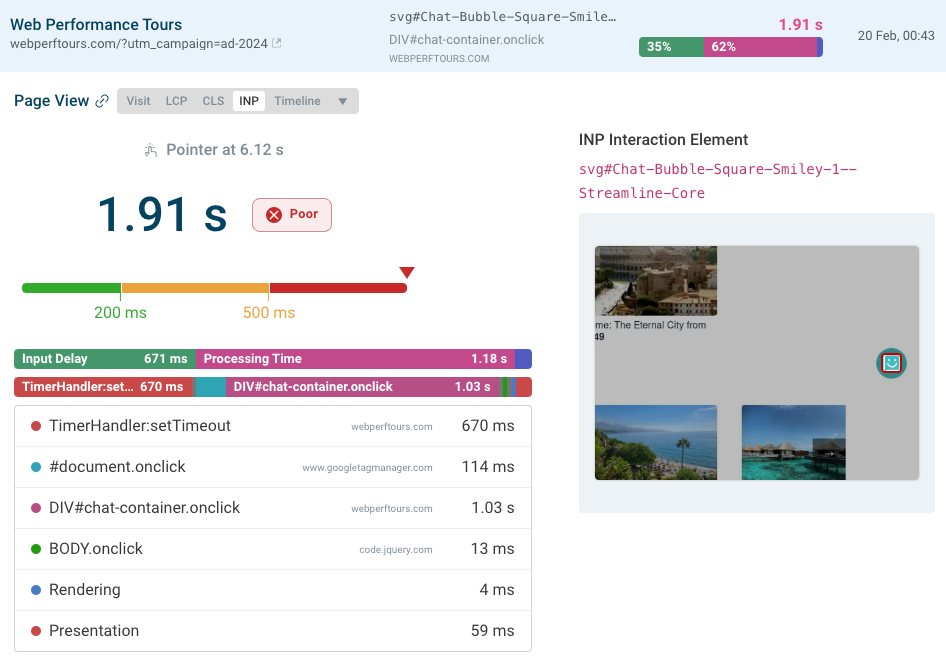
Continuously monitoring INP scores on your websites gives you insight into what pages on your website often display poor interaction responsiveness, and how different visitor groups have experienced your website over time. Based on the Long Animation Frames data you can also see scripts are most often responsible for interaction delays.

This post explored three lesser-known performance bottlenecks caused by excessive JavaScript: long tasks, large bundle sizes, and hydration issues. We examined how web frameworks can sometimes amplify these problems, resulting in slower load times and negatively impacting user interactions. Finally, we discussed approaches to mitigate these bottlenecks and what you can do to measure how slow JavaScript impacts your visitors.
We hope you found this post helpful and that it inspires you to build more efficient, high-performing websites that provide a smoother experience for users.
This post is sponsored by DebugBear. DebugBear helps website developers deliver a better user experience and pass Google's Core Web Vitals assessment. Get detailed page speed recommendations and continuously monitor synthetic and real user page speed metrics.
此内容由惯性聚合(RSS阅读器)自动聚合整理,仅供阅读参考。 原文来自 — 版权归原作者所有。