









Every developer knows the feeling. You finish a small change, stage your files, type git commit and wait. 55 seconds later, your pre-commit hook finishes and gives you the green light.
No single instance feels like a problem. It’s just a minute. You check Slack. You glance at another tab. Then you try to remember exactly where you were in the code.
But what if that minute was costing your team months?
When we set out to build a shared lint and format standard for VTEX’s frontend ecosystem, our goal was to create a single set of rules and tools that 70+ frontend engineers could share across projects, ensuring no configuration drift and no style debates in code review. This forced us to ask a question most teams never stop to ask: What does it actually cost us to run our linter?
The answer changed how we think about tooling decisions.
The easy assumption is that lint is cheap. It runs automatically, stays out of your application code, and doesn’t block users.
But pre-commit hooks don’t run in the background; they block the developer. Lint on CI is the same: it blocks the pipeline, delays feedback, and adds up across hundreds of runs per week.
We decided to measure instead of assume. Each developer was losing approximately 16 hours per year waiting for lint to finish: 1,140 hours across the 70-person team, or roughly $22,120 per year.
To measure execution time, we ran controlled benchmarks on three repositories: 50 iterations per scenario, clearing all caches between runs and trimming the top and bottom 10% of results to remove outliers.
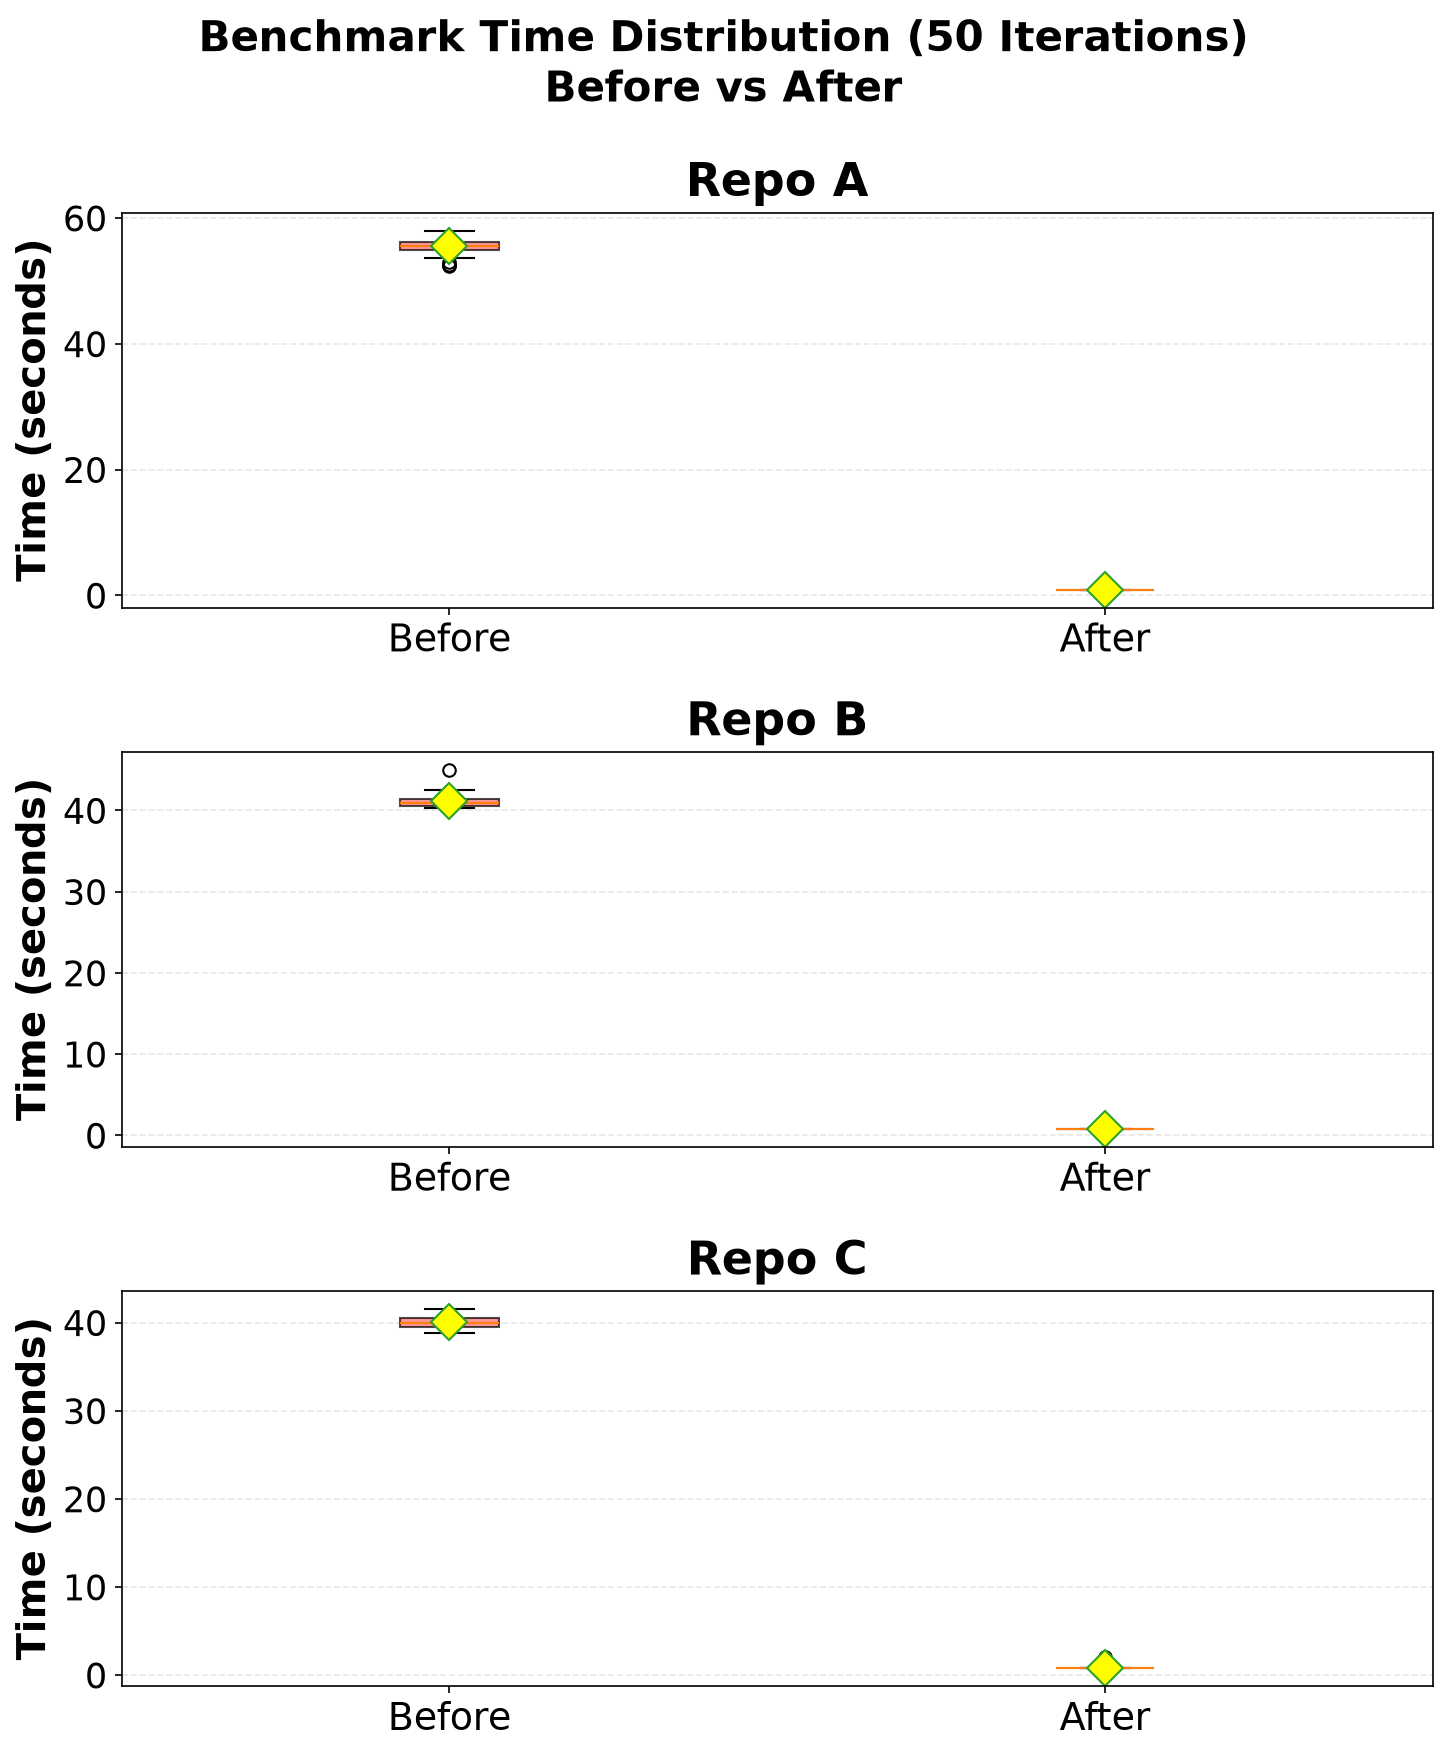
To translate that into engineer hours, we pulled 12 months of commit activity across a sample of 18 active frontend engineers in the org (the event counts the version control system already had). Every commit triggers the pre-commit hook and the developer waits, adding up to 16.3 hours per developer per year.
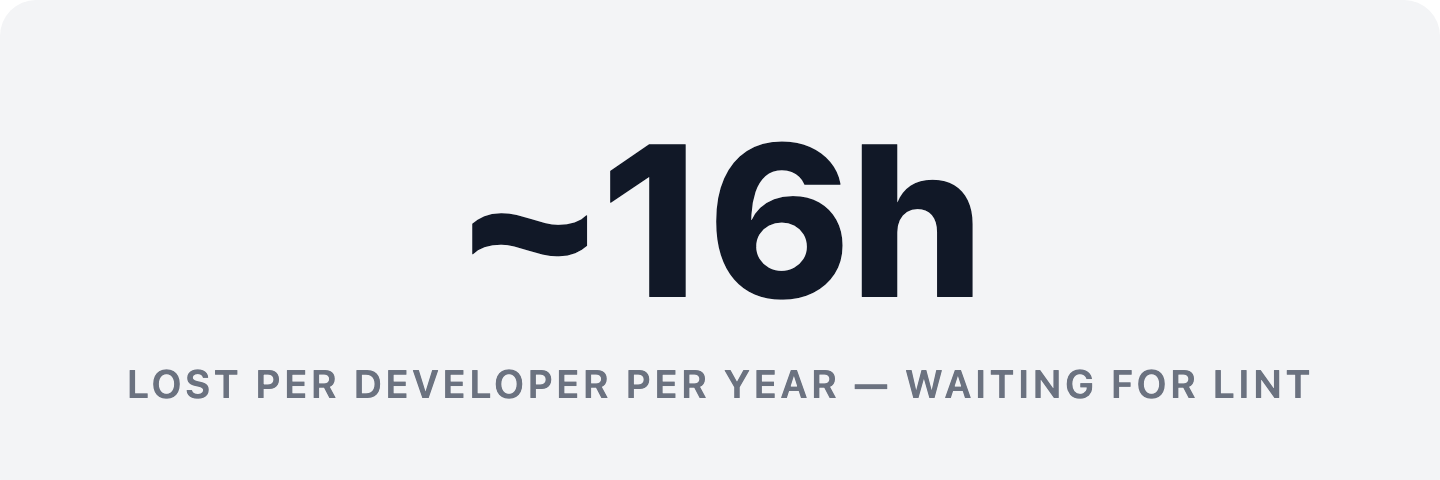
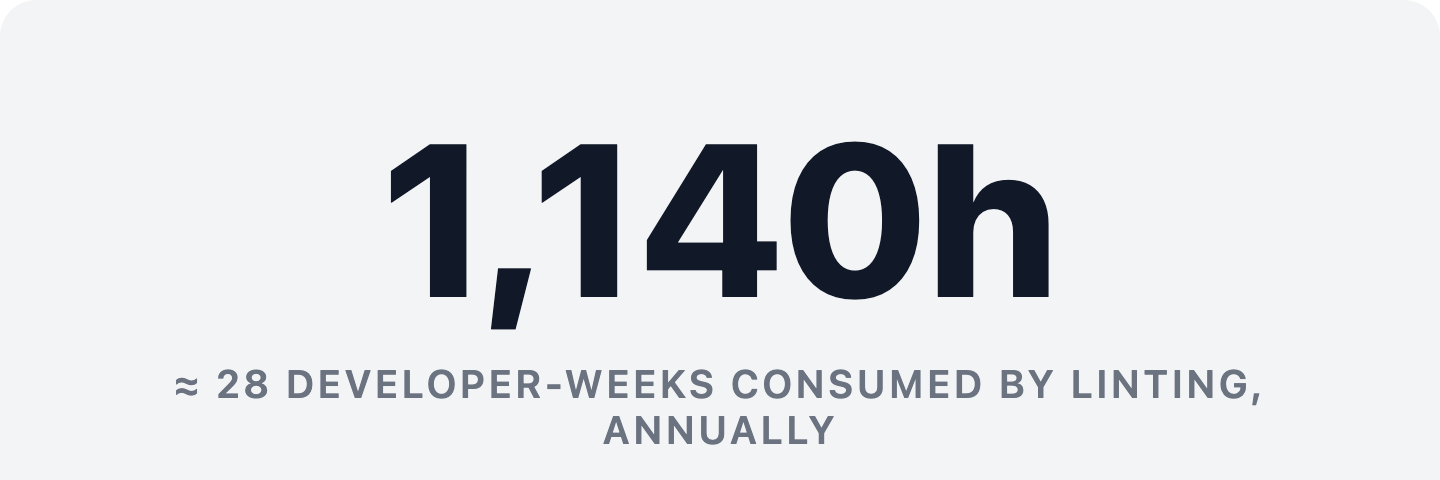
Sixteen hours per year sounds manageable until you scale it. Projected across a 70-person frontend team at the same commit frequency, that works out to roughly 1,140 hours per year: the equivalent of about 28 developer-weeks absorbed entirely by linting wait time.
A frontend engineer in Brazil earns roughly $23,000 per year, or about $11 per hour. Factoring in employer taxes, benefits, and overhead at a standard 1.7×, the fully-loaded hourly rate comes to around $18.6. At that rate, 16.3 hours per developer per year translate to $303 in human attention.
CI lint is a separate cost type: machine time, running on cloud infrastructure whether or not anyone is watching. Every pull request triggers a lint run, adding $13 in compute per developer per year. Combined: $316 per developer, or $22,120 across the 70-person team, absorbed silently, one commit at a time. Substitute your own market rate and the formula holds; the numbers will shift.
It stays invisible because no single instance feels worth fixing. One interruption feels like noise; over a thousand hours is a problem.
With the numbers in hand, the question was simple: is this fixable?
ESLint and Prettier are the defaults of the JavaScript ecosystem for a reason. Together they account for over 123 million weekly downloads. Prettier ships inside virtually every modern JavaScript project. They are mature, well-documented, and built into editors, CI pipelines, and team onboarding guides everywhere.
They are also slow by design. ESLint’s plugin-based JavaScript architecture evaluates rules through the Node.js runtime, and that cost grows with project size. In our repositories (full-codebase cold-start scans at pre-commit and CI scale), no amount of ESLint tuning brought us close to the sub-second feedback a compiled binary provides.
We evaluated the alternatives against four criteria: performance, production maturity, TypeScript and React rule coverage, and unified lint+format support, replacing two tools with one, not adding a third.
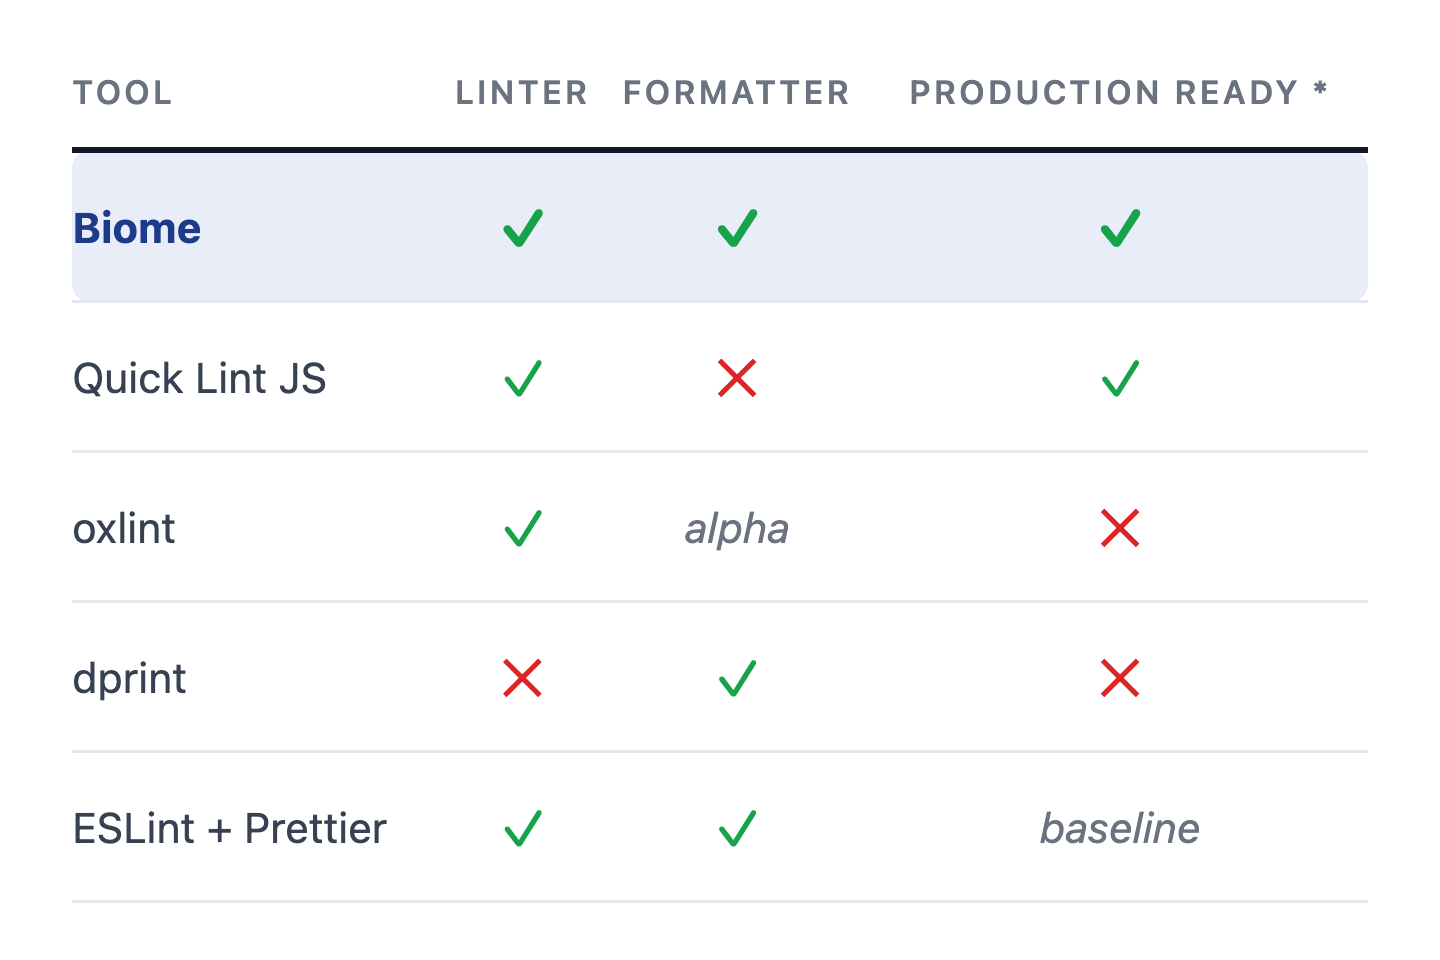
Quick Lint JS is reportedly 90× faster than ESLint, but it only lints, with around 10% of ESLint’s rule coverage and a niche adoption profile (under 1,000 weekly downloads) that makes it a poor fit for a company-wide standard. oxlint reportedly reaches 50–100× improvements, but its formatter was in alpha at the time of our evaluation. dprint is formatter-only and was pre-1.0 at the time of our evaluation. Only Biome met all four criteria: a Rust-based toolchain that consolidates linting and formatting into a single binary, with production-ready maturity and a growing community.
The performance benchmarks were run against a configuration that directly mirrors our existing ESLint + Prettier setup: same rules, same scope. Of the 214 ESLint rules we had configured, ~71% have a direct Biome equivalent, covering 100% of correctness and security rules; all Prettier options translate 1:1. This is consistent with Biome’s general coverage numbers (~70% of ESLint’s rule surface, 97% Prettier-compatible). The speed comparison is as close to apples-to-apples as the tool allows: the same meaningful checks, dramatically faster.
We migrated three VTEX repositories and measured the results in production.
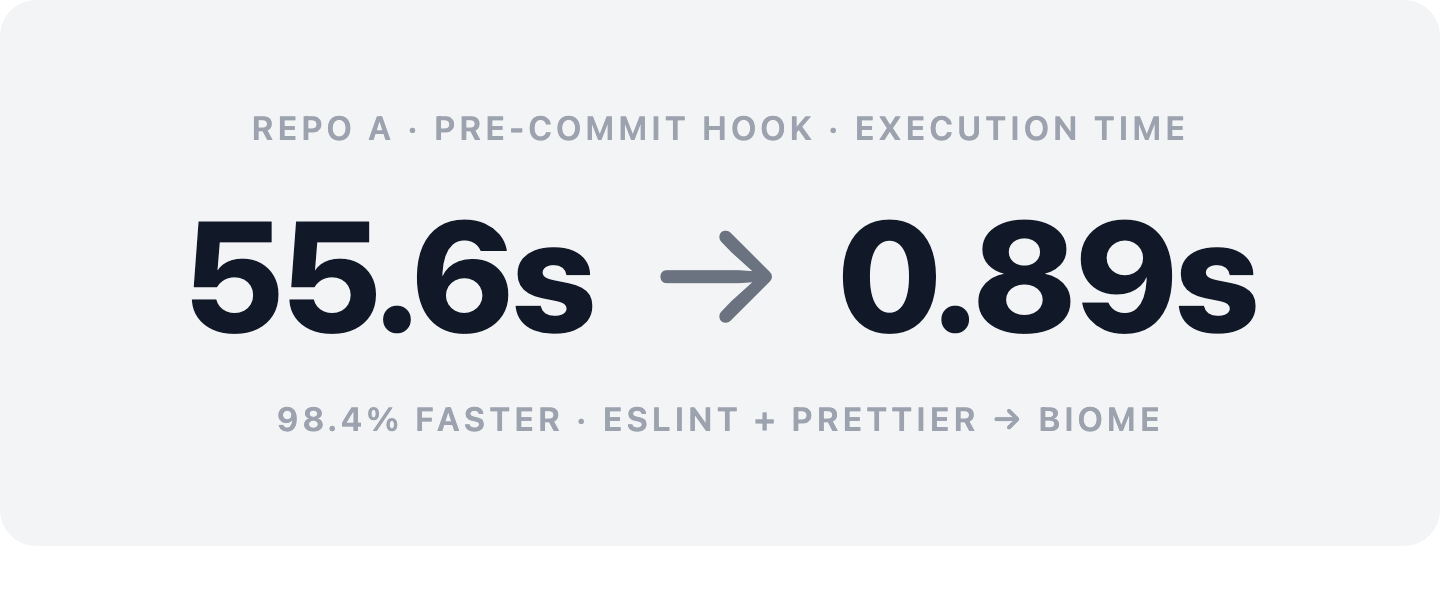
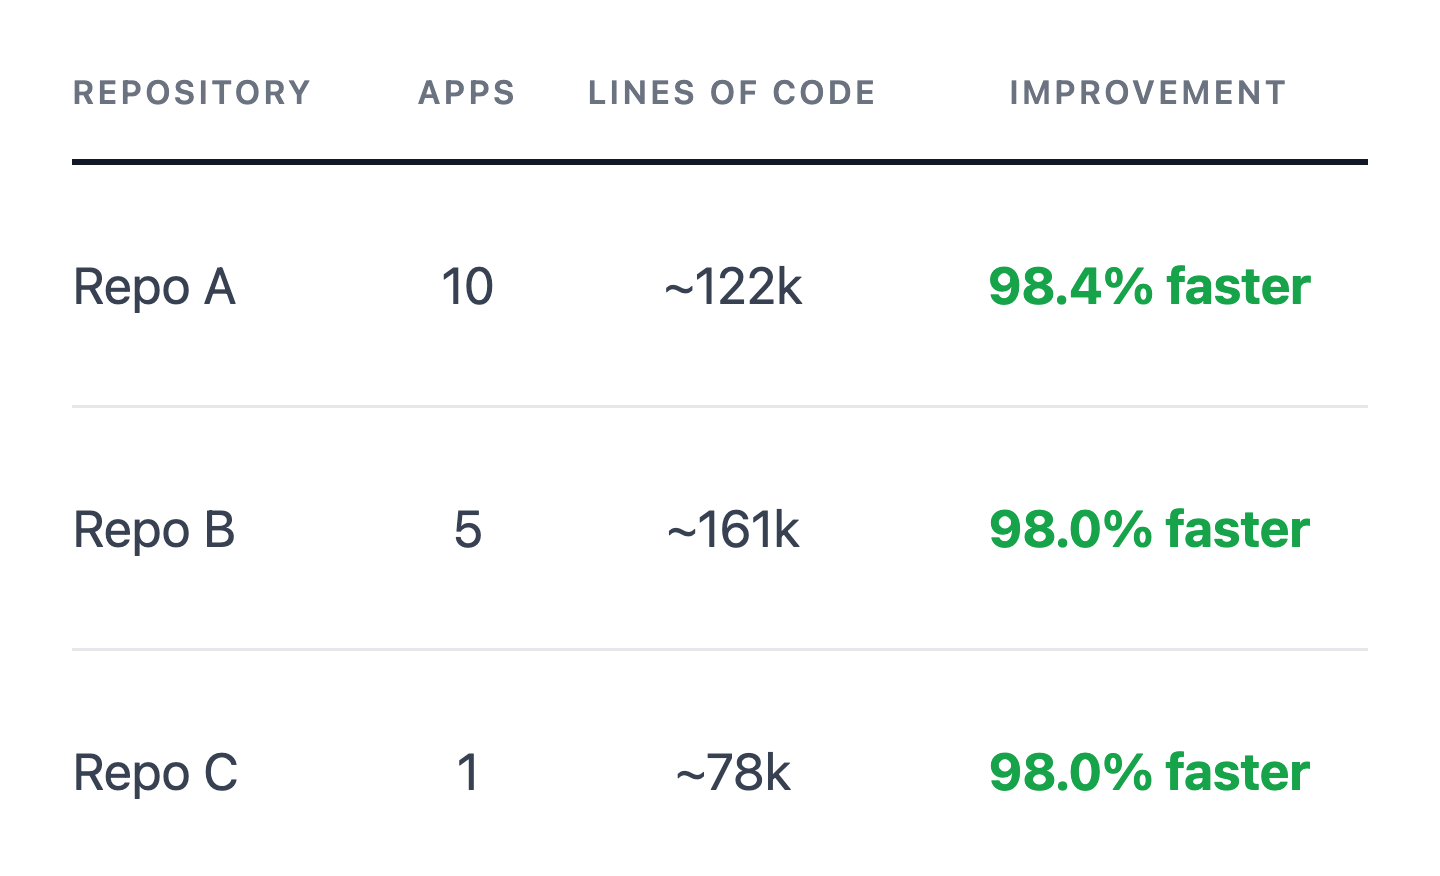
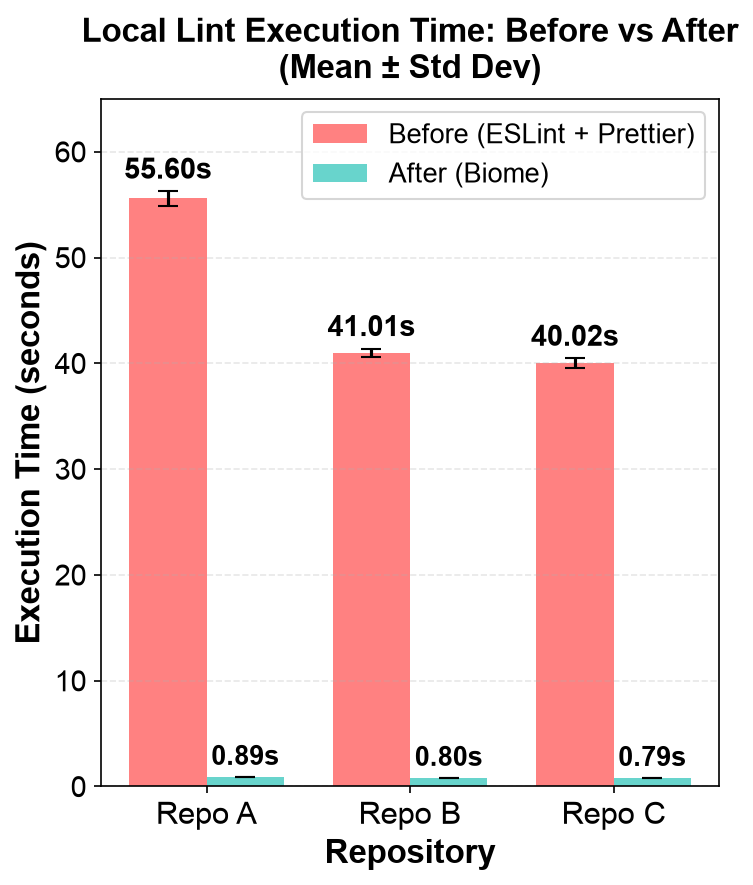
A 98% improvement sounds like a statistic; in practice, it changes what contributing to a codebase feels like. Fifty-five seconds is long enough to open another tab, get distracted, lose the thread of what you were doing. Below one second, it’s barely perceptible: the hook completes before you’ve finished reading the output. The tool goes from something you tolerate to something you stop noticing. That’s what you expect from a good tool. CI lint followed the same pattern: we measured it directly on Repo A and found a 98.4% reduction, from 108 seconds down to 1.77. Averaged across all three repositories, the pre-commit improvement was 98.1%.
Production results gave us the confidence to do what we set out to do: build the standard.
We encoded VTEX’s lint and format rules into a shared configuration that any frontend team can adopt without reconstructing the setup from scratch. No more per-project rule drift; no more inconsistencies discovered at code review. One baseline, consistent across every project in the ecosystem.
But a standard is only as good as how easy it is to adopt. Configuration alone still leaves each team to do the mechanical work of migration: understanding what changed, resolving rule conflicts, testing the output. That friction slows adoption.
So we built an AI-assisted migration workflow that detects each repository’s current state, removes legacy tooling, installs and configures Biome with the shared preset, and resolves remaining lint violations in batches with automated build gates at each step. What previously took 1–2 days per repository manually now takes 2–4 hours with the workflow: under 10 minutes to set up, and the rest is the AI workflow resolving violations in automated batches. Teams that haven’t migrated yet can do so independently, without needing support from the platform team, and without migration cost becoming a reason to delay.
The lesson here is not “use Biome.” Biome is the answer we arrived at given our constraints and the state of the tooling ecosystem in 2025. The ecosystem will evolve, and the right answer for your team may differ a year from now.
The lesson is: measure the cost of your tooling before assuming the industry default is optimal for your context.
The methodology is straightforward and replicable:
Benchmark, don’t estimate. Run lint on your real codebase, not a toy project or a published benchmark, multiple times, clearing caches between runs and discarding outliers. A single measurement is noise.
Pull frequency from git history. Don’t estimate how often developers commit. Pull the actual count from version control; 12 months of real events are already there. Track commits separately from PR creations and updates: they hit different cost buckets.
Separate developer time from CI machine time. Pre-commit hooks consume developer attention. CI runs consume cloud infrastructure. Both add up, but they have different hourly rates and different owners in a budget conversation.
Apply fully-loaded cost, not gross salary. Use Total Cost of Employment, the number that includes employer contributions and benefits. It’s what the company actually pays per developer-hour, and it’s what makes the final figure defensible in a leadership conversation.
Once you have it, the case for a tooling change is easier to make. Over a thousand hours is not an abstraction. It’s seven months of a colleague’s time, absorbed silently, one 55-second commit at a time.
此内容由惯性聚合(RSS阅读器)自动聚合整理,仅供阅读参考。 原文来自 — 版权归原作者所有。