







PostHog captures a lot of user behavior data — the pages people visit, the buttons they click, and everything in between, all captured as events and session recordings. By “a lot,” I mean billions of events and terabytes of S3 snapshots. Watching those sessions is incredibly useful for understanding how products are actually used, but there’s an obvious problem: there are far too many to review manually.
So, we created a tool to watch and analyze user sessions. It highlights the issues - so you can find what's broken without watching hundreds of hours of recordings yourself. It's called Session Summaries, we release it in beta today. You can use it right now, for free, with PostHog AI.
In this post, I'll walk through what we learned through the process of building it, where we messed up, and lots of practical tips on how to make user behavior analysis work in production. All the code is open-source, and here's a 36-second demo of how it works:
Let's forget about scaling for a moment and focus just on a single user session: a user visited a website or app, navigated a bit, did something useful, and left. The logic seems straightforward: take all the session events, send them to an LLM, and get a summary.
However...
Usually, each user-generated event has lots of metadata attached to it. User info, URLs, event type, CSS selectors, timestamps, and so on. In PostHog's case, a single session with all metadata could easily exceed 1 million tokens. Even if we forget about pricing and context limits, providing too much data will cause the lost-in-the-middle effect: the LLM will highlight what happened at the very start or end but completely miss the main part.
Our approach:
url_N alias and attach a mapping. Same for tab IDs, and any repeating parameters.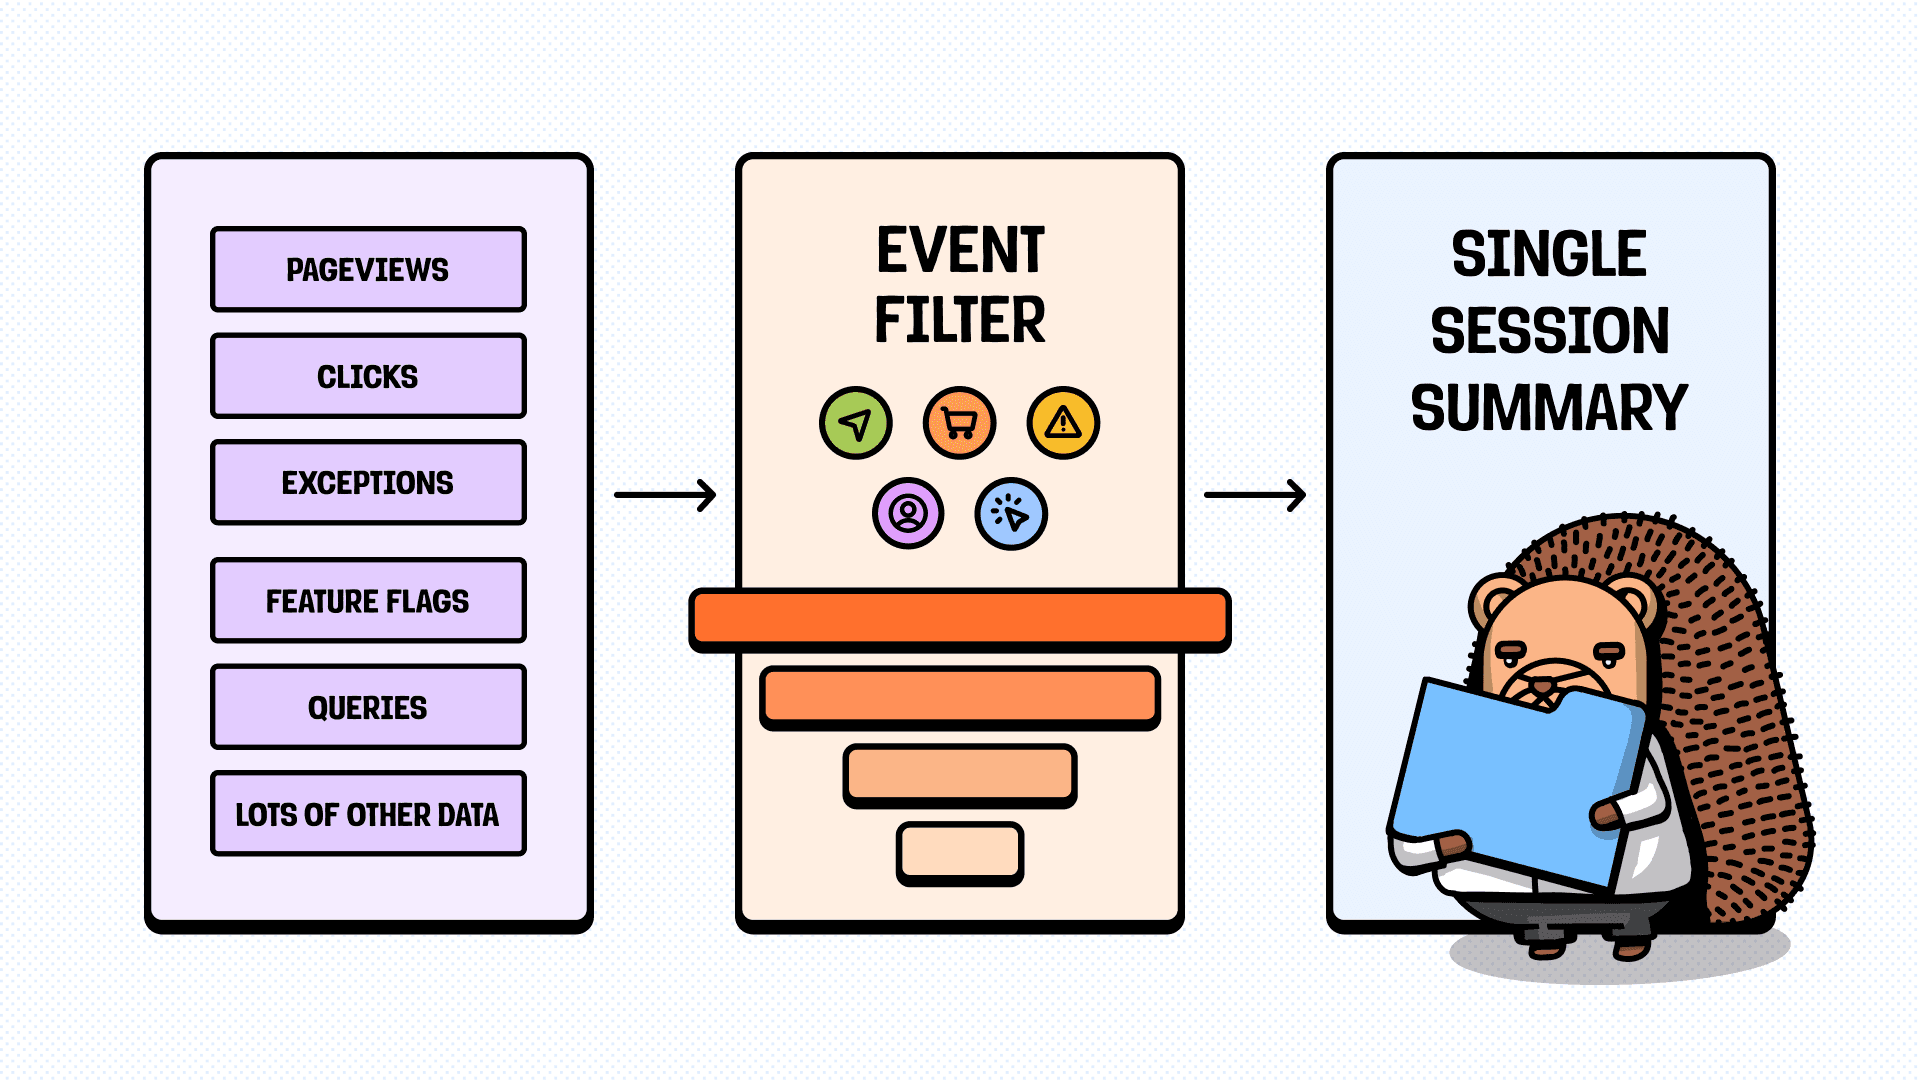
Carefully select what data goes into the pipeline
If a user spends hours on your site, their session could be huge. If you have lots of such users (like we do), it’s tempting to split each session into segments and analyze them in parallel to cut latency. It's a trap. If the LLM doesn't know what happened before or after, it loses critical context on what the current segment's events actually mean, so the combined result is worthless.
Our approach:
nano ones) can allow streaming the summary after 10-15s, but thinking models on "high" provide better results quality-wise, and quality is the goal.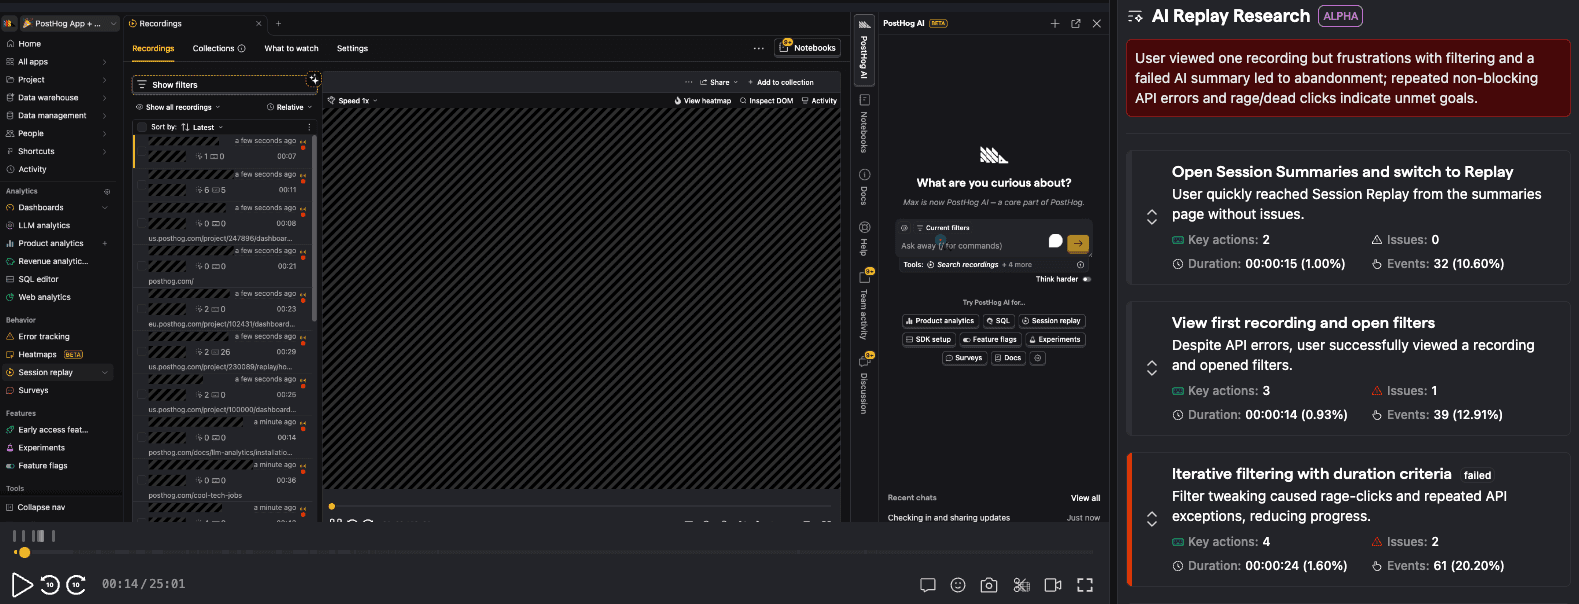
Here's how you can get a summary of a single session from chat, or Replay player
Fast-growing products (startups specifically) have a bad habit of generating lots of exceptions spurious, especially frontend ones. LLMs see this, panic, and hallucinate a summary of the session in which the user completely failed on all their goals. In reality, the user successfully got what they came for and didn't even notice these exceptions.
Our approach:
Even with noise reduction, the core problem remains: we can't be sure whether the issues highlighted by the LLM actually affected users. A TypeError in logs looks scary, but if a retry succeeded in 200ms - the user never noticed. Since we have lots of snapshots, we can generate videos of the sessions and see what the user saw.
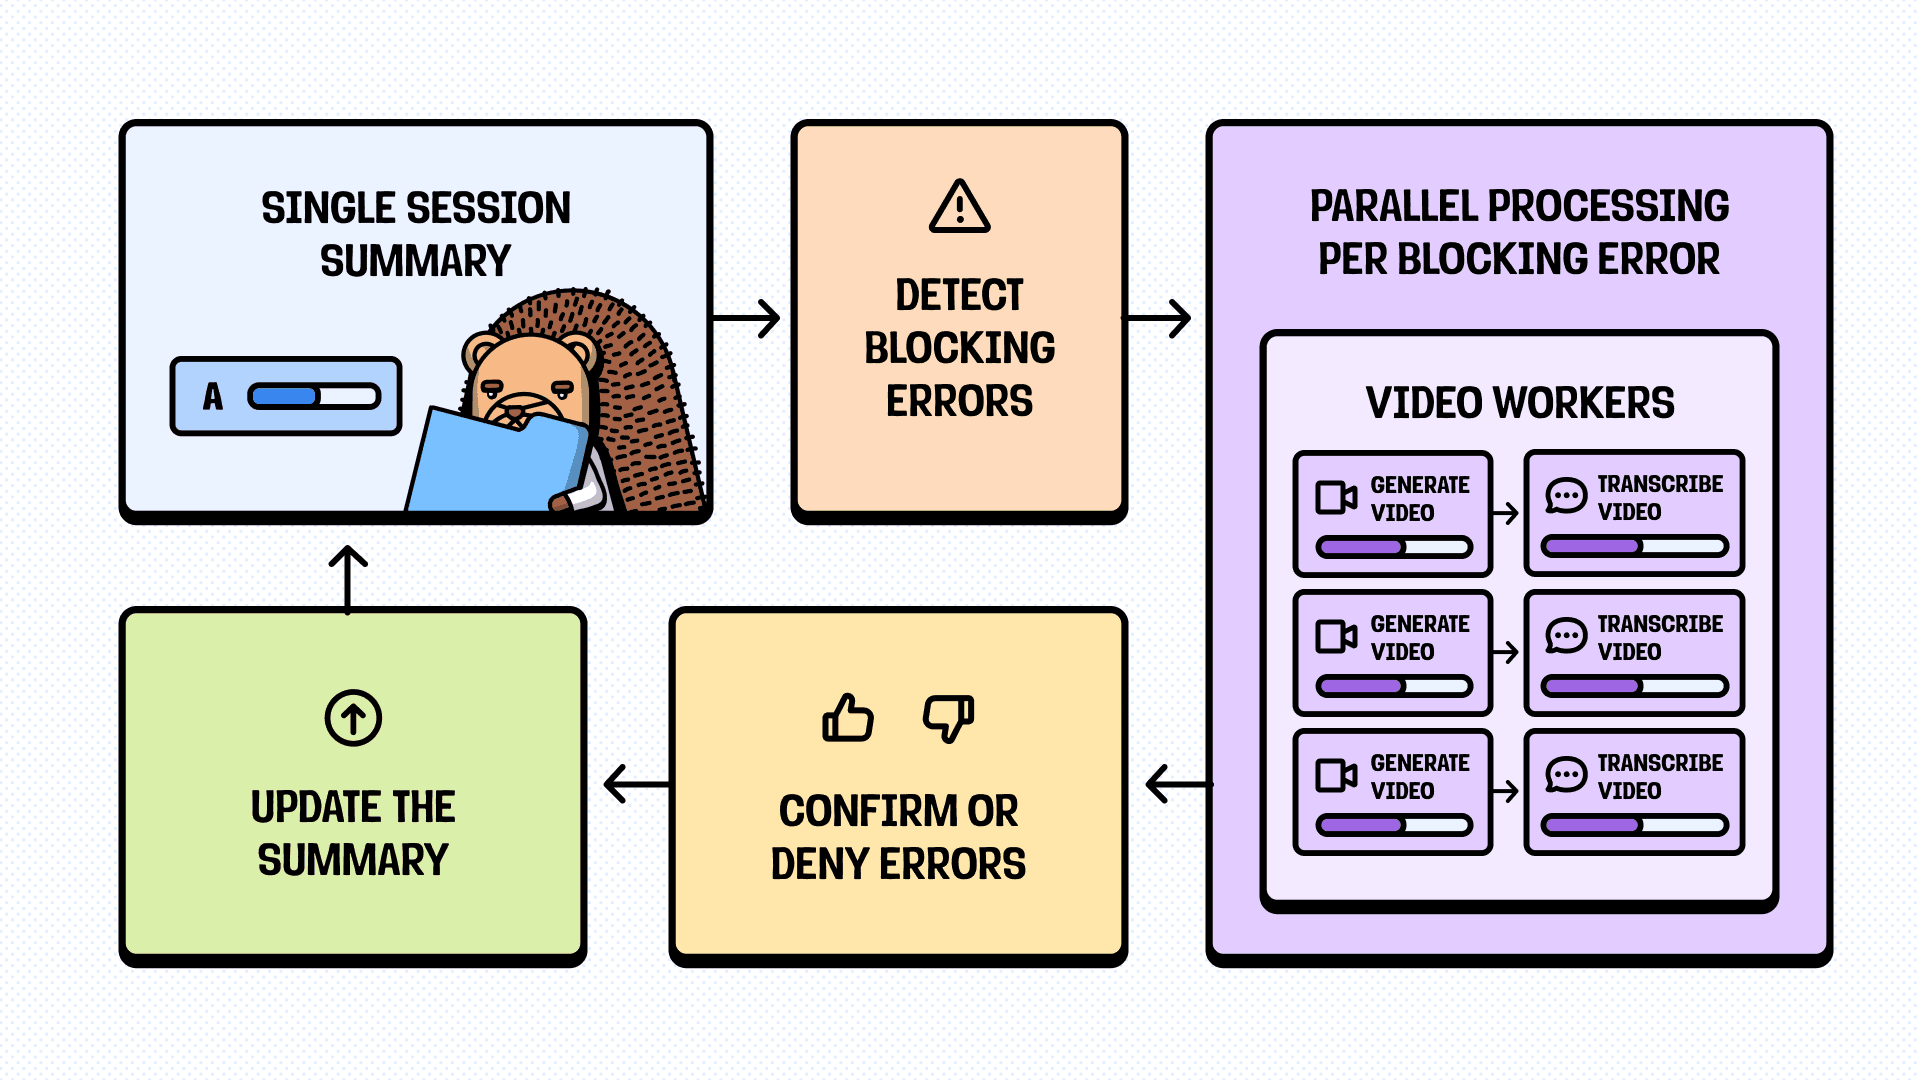
When the single-session summary flags something as a "blocking error" - an exception that supposedly prevented the user from completing their goal - we don't trust it blindly. Instead, we:
And it works pretty well, but it raises the question: why not use only the session recording? Why use events at all?
If we use only video, we can see that the user visited the page, waited for 5 seconds at the loading state, and left. We don't see the ClickHouse timeout error, outdated data cached in Redis, or malformed query parameter in the users URL. We know what happened, but creating a detailed report would require extensive manual investigation - so why read the summary in the first place?
Our approach:
We haven't shipped approach 2 (yet) because...
At first glance, transcribing all the user session videos seems like a no-brainer. For example, Gemini Flash multi-modal models cost 10-20 times cheaper than thinking LLMs from Anthropic or OpenAI (or even Gemini's own). It can go even lower with open-source models.
However, let's try basic math, using numbers from now (end of 2025).
1 frame per second * 60 seconds in a minute * 60 minutes in a hour * 258 tokens = 929k tokens.We can even use lighter models and lower resolutions, but at some point, the quality drop is too much. Also, these models are this cheap because they aren't exactly clever. We can ask it to transcribe what's on the screen, but it won't be able to make meaningful conclusions on the whole journey. So, either we need to use a much more expensive model from the start, or we need another model to analyze transcription afterward.
Our approach:
Even with all the optimizations above, video files add up. A 10-second GIF clip at 1080p can be 7-15MB. Multiply by hundreds of thousands of sessions, and we're looking at terabytes of storage costs daily. The example is obviously laughable, but even with the regular .mp4 format (tens of times smaller), it's easy to reach terabytes pretty quickly.
Our approach:
.webm. It's roughly half the size of the .mp4, supported by most multimodal models, and can be played in most browsers by default (in the UI or not).puppeteer, playwright, and similar libraries have different recording settings, and speeding up can result in data loss.A single session summary is useful enough, but watching one session at a time doesn't solve the original problem - there are thousands of sessions, and we need to find issues across them. We decided to start small, with 100-session batches. It won't cover all the sessions, but it can cover a good enough sample (or a specific org), and already saves tons of time.
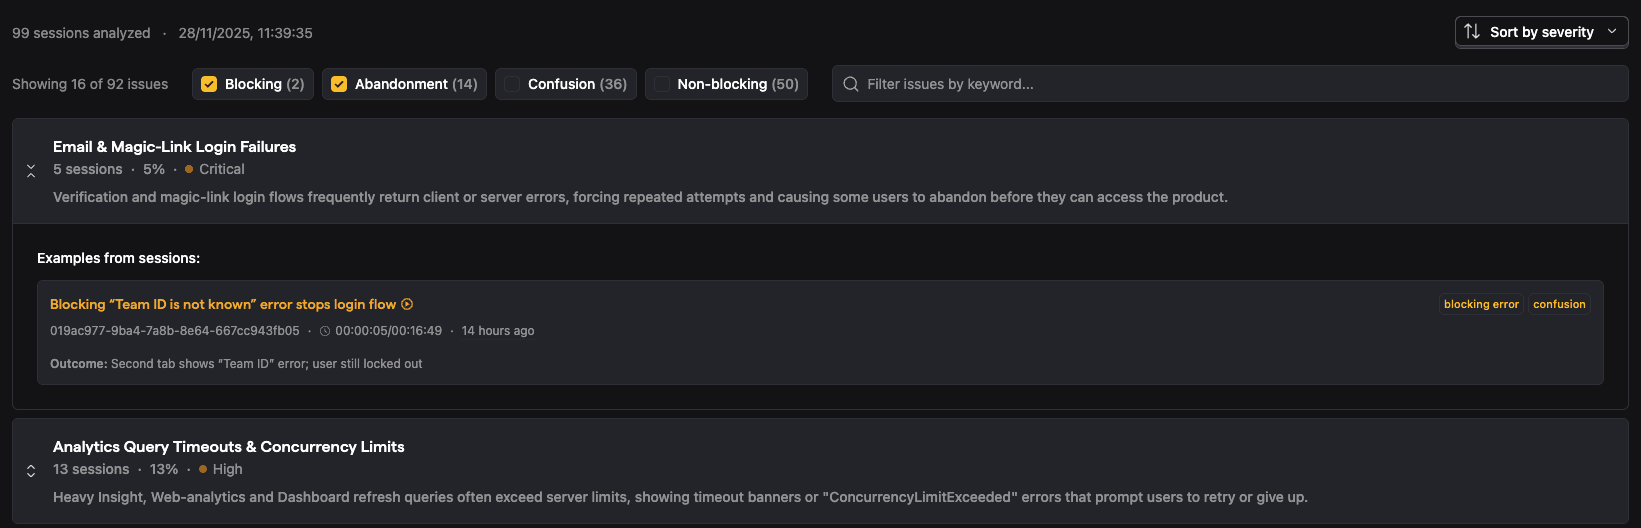
You can check the pattern based on severity and issue types
The session group summary surfaces patterns across sessions, including severity, the number of affected sessions, and specific examples. The complex part, obviously, is how to extract these patterns.
In an ideal world, we’d send 100 single-session summaries in one LLM call and get back an extracted set of patterns. Sadly, that breaks down on multiple levels. First, we’d hit the model’s context limits — enriched summaries are heavy on metadata. Second, even if they did fit, we’d run into the same lost-in-the-middle problem, with the first and last sessions getting far more attention than everything in between.
Also, we could've just picked a sample of sessions and selected patterns from them, but then the quality of the final report would be too dependent on our luck in picking the initial sessions. LLMs love finding patterns, but without proper control, we would've gotten either duplicates or incredibly insightful "wow, users clicked buttons" ones.
Our approach: We use a four-phase pipeline instead of a single prompt:
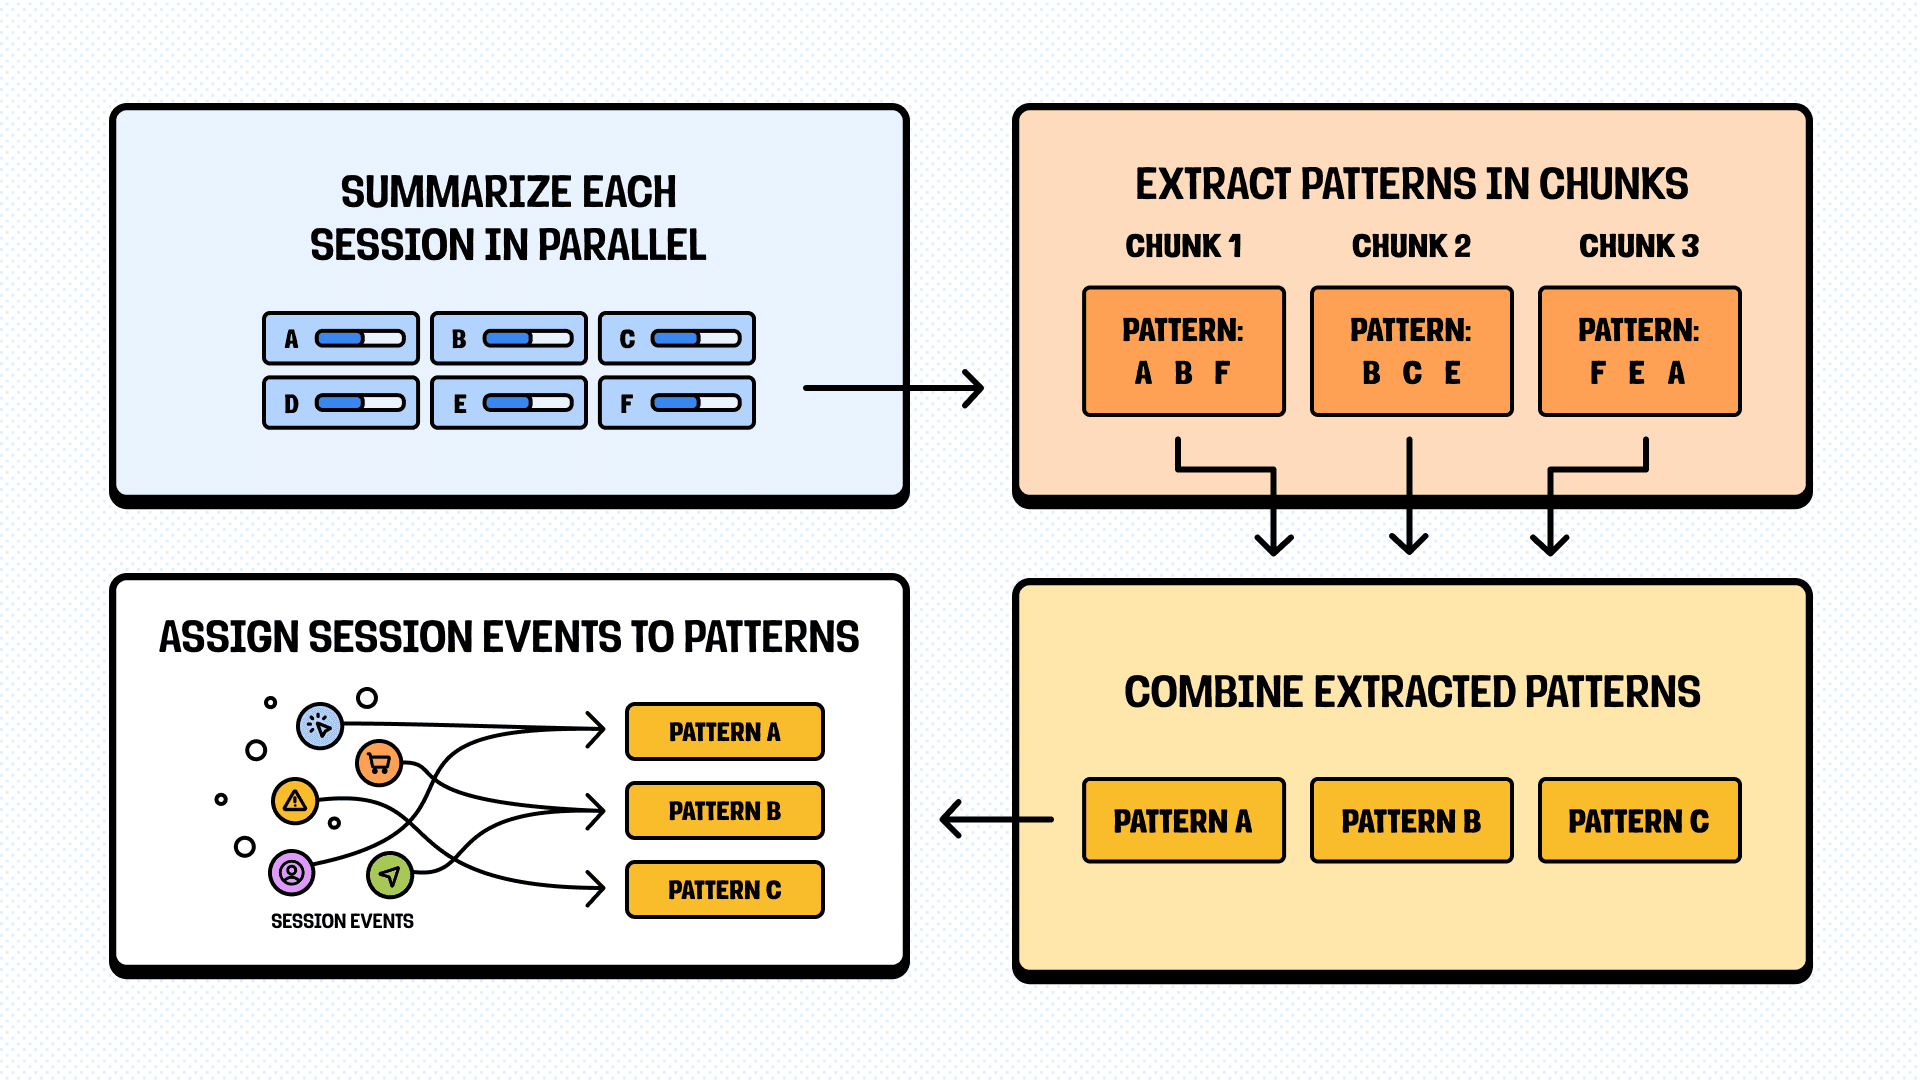
Even if we got patterns, there's just too much data to process easily, so we need to rank them properly. For example, a blocking error that happens once in 100 sessions is annoying. The same error in 80 sessions is critical. Or the exception could occur 10 times, but only for a single user out of 100, and saying "issue X happened 15 times" could cause a false alarm.
Our approach:
Extracting patterns is only half the job. If users can't verify that the patterns are real, they won't trust the report. "Users experience checkout timeouts" is useful. "Users experience checkout timeouts - here are 5 specific sessions where it happened, with timestamps and video clips" is actionable.
To make it work, we needed a way to easily display the whole story to the user and give them the tools to validate the issue themselves. So we did.
Our approach:

Now we have a pipeline that works across 100 sessions: single-session summaries → video validation → pattern extraction → pattern enrichment. The problem? It's fragile. If the whole thing falls apart because of one bad response, the feature is unusable.
To make it more predictable, we use Temporal workflows, with each workflow spawning hundreds of atomic and easily retriable activities, so we’ll get a proper result - sooner or later.
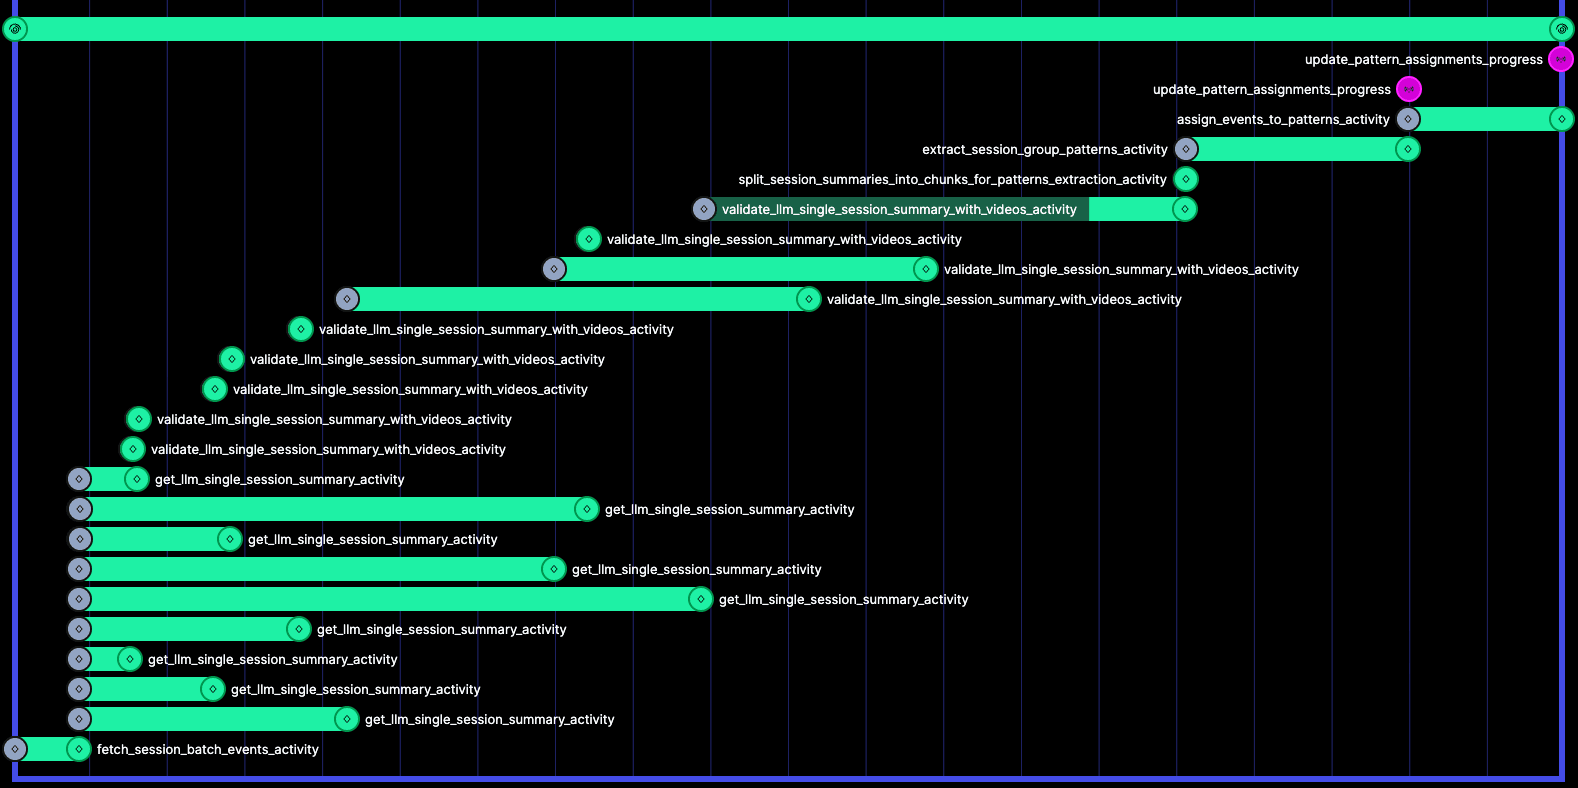
Temporal workflow logic on a small sample of sessions
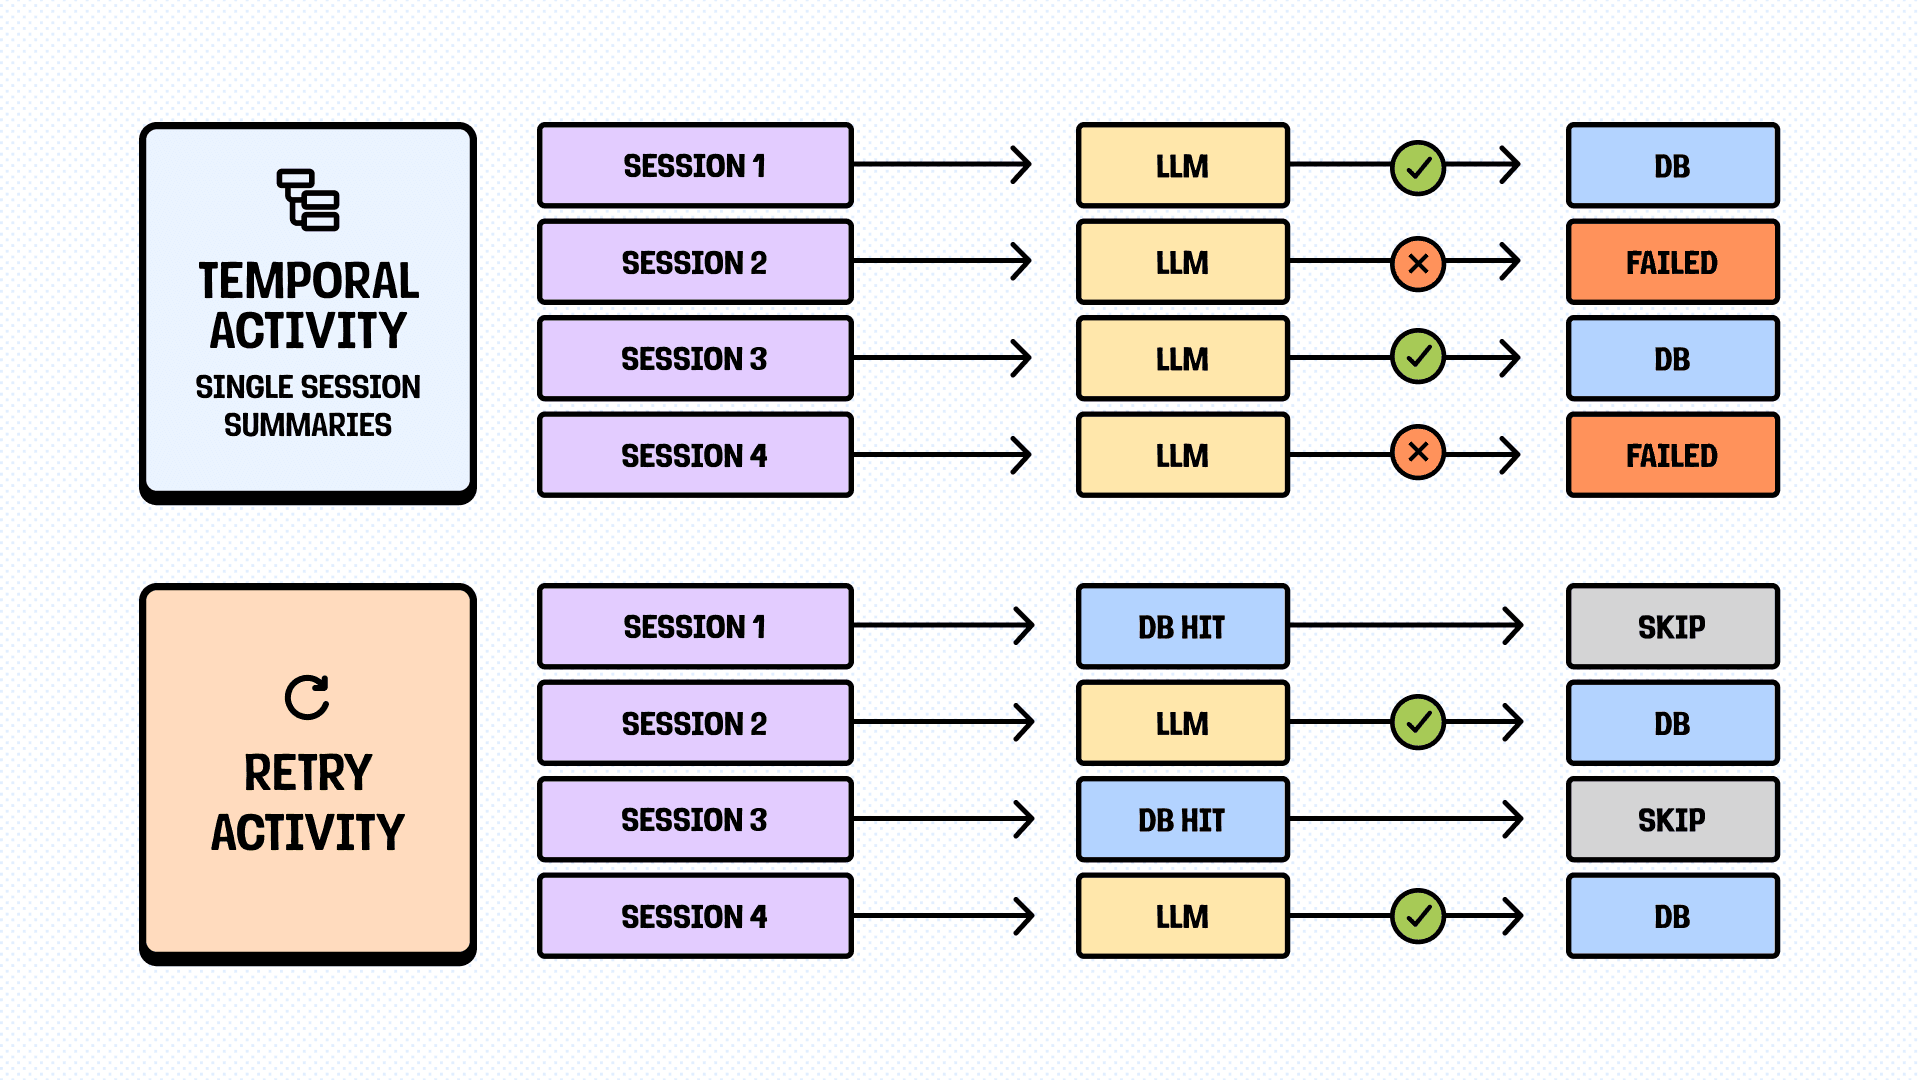
We're making ~150-200 LLM calls per a single report, any of which can (and often will) fail. Timeouts, rate limits, malformed responses, hallucinations, and lots of other creative reasons my human mind isn’t capable of predicting. Treating every such failure as fatal means the feature never works in production.
Our approach:
If any analysis step fails, but you have proper atomic activities and cache the results, you can even retry the whole workflow for cheap. Storage is cheap and fast (especially non-persistent ones, like Redis), while LLM calls are not and take time.
Our approach:
Temporal is amazing for orchestrating complex workflows, but it has limits. Event history is capped at around 2MB. When we tried to use it as-is, we hit the limit even before making a single LLM call – just by pulling the data to analyze from the DB (an obvious anti-pattern).
Redis, as a stateful bridge, provides plenty of opportunities for workarounds. Firstly, we can store all the intermediate steps there without the need to calculate space (and just pass the keys). Secondly, we use Redis to stream the progress, LLM calls, combined data, and whatever else we want, with great latency.
Our approach:
Session Summaries are available now in free, public beta. So, if you want to check our findings above, give it a try. Just ask PostHog AI to summarize your sessions. Worst case: you’ll notice where we messed up. Best case: you’ll learn something useful about your users and your product.
What Session Summaries can do:
What it will be able to do soon:
We’ll share more updates and learnings down the road. Or we'll get distracted by something shiny. Probably both.
In the meantime, try it, break it, and let us know.
P.S. If you are still reading and find it interesting, we're hiring AI Product Engineers. We have tons of ideas to ship, and we'd love to hear yours.
此内容由惯性聚合(RSS阅读器)自动聚合整理,仅供阅读参考。 原文来自 — 版权归原作者所有。