惯性聚合 高效追踪和阅读你感兴趣的博客、新闻、科技资讯
阅读原文 在惯性聚合中打开

推荐订阅源

cs.AI updates on arXiv.org
SecWiki News
SecWiki News
Recent Commits to openclaw:main
Forbes - Security
Forbes - Security
Schneier on Security
W
WeLiveSecurity
cs.CV updates on arXiv.org
Google Online Security Blog
O
OpenAI News
Exploit-DB.com RSS Feed
S
Secure Thoughts
PCI Perspectives
PCI Perspectives
人人都是产品经理
人人都是产品经理
Blog — PlanetScale
Blog — PlanetScale
S
SegmentFault 最新的问题
Help Net Security
Help Net Security
G
GRAHAM CLULEY
Latest news
Latest news
V
Visual Studio Blog
The Cloudflare Blog
T
Troy Hunt's Blog
Threat Intelligence Blog | Flashpoint
Stack Overflow Blog
Stack Overflow Blog
GbyAI
GbyAI
I
InfoQ
Know Your Adversary
Know Your Adversary
B
Blog RSS Feed
V2EX - 技术
V2EX - 技术
奇客Solidot–传递最新科技情报
奇客Solidot–传递最新科技情报
Cyber Security Advisories - MS-ISAC
H
Heimdal Security Blog
Y
Y Combinator Blog
Security Archives - TechRepublic
The GitHub Blog
The GitHub Blog
P
Palo Alto Networks Blog
OSCHINA 社区最新新闻
OSCHINA 社区最新新闻
T
Tor Project blog
T
Threat Research - Cisco Blogs
博客园 - 三生石上(FineUI控件)
Cloudbric
Cloudbric
博客园 - Franky
博客园 - 叶小钗
S
Security @ Cisco Blogs
cs.CL updates on arXiv.org
阮一峰的网络日志
阮一峰的网络日志
WordPress大学
WordPress大学
T
Threatpost
MongoDB | Blog
MongoDB | Blog
V
Vulnerabilities – Threatpost
Martin Fowler
Martin Fowler

PostHog's RSS Feed

Training our own AI models - PostHog From 270GB RAM to 5GB: Moving local flag evaluation from Django to Rust The best analytics stack for vibe-coded apps The do's and don'ts of minimum viable product marketing - PostHog The best MCP servers for startups, by workflow 4,063 errors closed without a human opening PostHog – here's what we learned - PostHog PostHog Code and the self-driving product - PostHog Why attacking your competitors online is dumb - PostHog The best real-time analytics platforms for developers, compared DuckDB vs ClickHouse: Why we use both at PostHog - PostHog PostHog's next chapter - PostHog Making Claude Cowork actually useful - PostHog PostHog vs Matomo in-depth tool comparison You're doing lifecycle emails wrong Untangling Tokio and Rayon in production: From 2s latency spikes to 94ms flat The best HIPAA-compliant A/B testing tools - PostHog A beginner's guide to testing AI agents - PostHog I hate the standup bot (so I built an agent to do it for me) - PostHog The best CDPs for developers, compared The best error tracking tools for developers, compared The best feature flag software for developers, compared 7 best session replay tools for mobile apps 7 best free open source business intelligence tools right now PostHog vs LogRocket in-depth tool comparison The most popular PostHog alternatives, compared Open source (and self-hosted) session replay tools - PostHog The 9 best GA4 alternatives for apps and websites - PostHog PostHog vs Google Analytics 4 in-depth tool comparison How we built automatic clustering for LLM traces - PostHog The 7 best HIPAA-compliant analytics tools 8 best open source analytics tools you can self-host - PostHog The best product analytics tools for startups, compared PostHog vs FullStory in-depth tool comparison The best in-app survey tools for product teams, compared The 7 best mobile app analytics tools PostHog vs Hotjar in-depth tool comparison The 8 best free and open-source feature flag services - PostHog The 5 best free and open-source A/B testing tools - PostHog The best mobile app A/B testing tools, compared What is a feature flag? Feature Flags vs Remote Config vs A/B Testing PostHog is now available in Vercel’s v0 The best Heap alternatives & competitors, compared PostHog vs Heap in-depth tool comparison PostHog vs Pendo in-depth tool comparison PostHog × Vercel: feature flags, minus the plumbing Your logs' final destination is in GA. You always end up here anyway Behind the scenes of a PostHog hackathon - PostHog The most popular Mixpanel alternatives & competitors, compared PostHog vs Mixpanel in-depth tool comparison The 9 best GDPR-compliant analytics tools How we use Logs at PostHog The best web analytics tools for developers, compared Stop AI slop: Run evals with LLM-as-a-Judge - PostHog You product data just got a job: Workflows is now out App onboarding: How to fix drop-off points Meet Logs (beta) – logs with all the tools you’re already using Why small teams crush tiger teams How we built user behavior analysis with multi-modal LLMs (in 5 not-so-easy steps) - PostHog The best Contentsquare alternatives & competitors, compared 8 learnings from 1 year of agents – PostHog AI - PostHog Why we killed our AI product assistant Workflows graduate to beta! Product data, meet automation The best Rollbar alternatives & competitors, compared Workflows are now in Alpha and I already broke mine - PostHog I've consistently underestimated how important communication is as a CEO - PostHog How we made feature flags even faster and more reliable The best session replay tools for developers, compared What I learned attending my first ever hackathon - PostHog Did you know AI is answering our community questions? - PostHog How not to be boring - PostHog We built an internal tool to generate changelog images for social media - PostHog What we built at our windswept Mykonos hackathon - PostHog How we built our onboarding email flow (with actual performance data) - PostHog We're building a better PostHog community by closing our public Slack - PostHog Introducing Notebooks for PostHog - PostHog Why we've launched PostHog user surveys - PostHog How we made feature flags faster and more reliable - PostHog In-depth: ClickHouse vs Redshift - PostHog Introducing HouseWatch: An open-source toolkit for ClickHouse - PostHog Introducing HogQL: Direct SQL access for PostHog - PostHog What we built at our sun-kissed Aruba hackathon - PostHog In-depth: ClickHouse vs BigQuery - PostHog In-depth: ClickHouse vs Elasticsearch - PostHog HogMail #22: Why do companies over-hire?" - PostHog Our simpler goal: Help engineers to be better at product - PostHog In-depth: ClickHouse vs Snowflake - PostHog HogMail #21: Avoiding the "Product Death Cycle" - PostHog Sunsetting Kubernetes support for PostHog - PostHog Why 'Product Engineer' is the most fun role I've had in tech - PostHog HogMail #20: Why do startups fail? - PostHog The best Google Optimize alternatives for apps and websites - PostHog Array 1.43.0: Massive performance improvements! - PostHog In-depth: ClickHouse vs Druid - PostHog HogMail #19: Which meetings should you kill? - PostHog CEO diary: The things I learned in 2022 - PostHog The essential tools used by product engineers - PostHog HogMail #18: What can SaaS learn from the New York Times? - PostHog What is a product engineer? - Product Engineer Handbook - PostHog Array 1.42.0: Get beta features via our roadmap! - PostHog HogMail #17: The personal traits that can't be taught - PostHog
7 best free and open source LLM observability tools
Ian Vanagas · 2026-03-19 · via PostHog's RSS Feed

To build LLM-powered apps, developers need to know how users are using their app.

LLM observability tools help them do this by capturing LLM provider requests and generations, then visualizing and aggregating them. This helps developers monitor, debug, and improve their apps.

To help you pick the best of these tools, we put together this list. All of the following products:

  1. Integrate with popular LLM providers like OpenAI, Anthropic, and Vercel AI SDK to capture generations.
  2. Let you view individual generations and traces from your app.
  3. Calculate and display an aggregated metrics dashboard with cost, latency, and more.
  4. Are open source and self-hostable.
  5. Have a free hosted version (minus one of them…)

1. PostHog

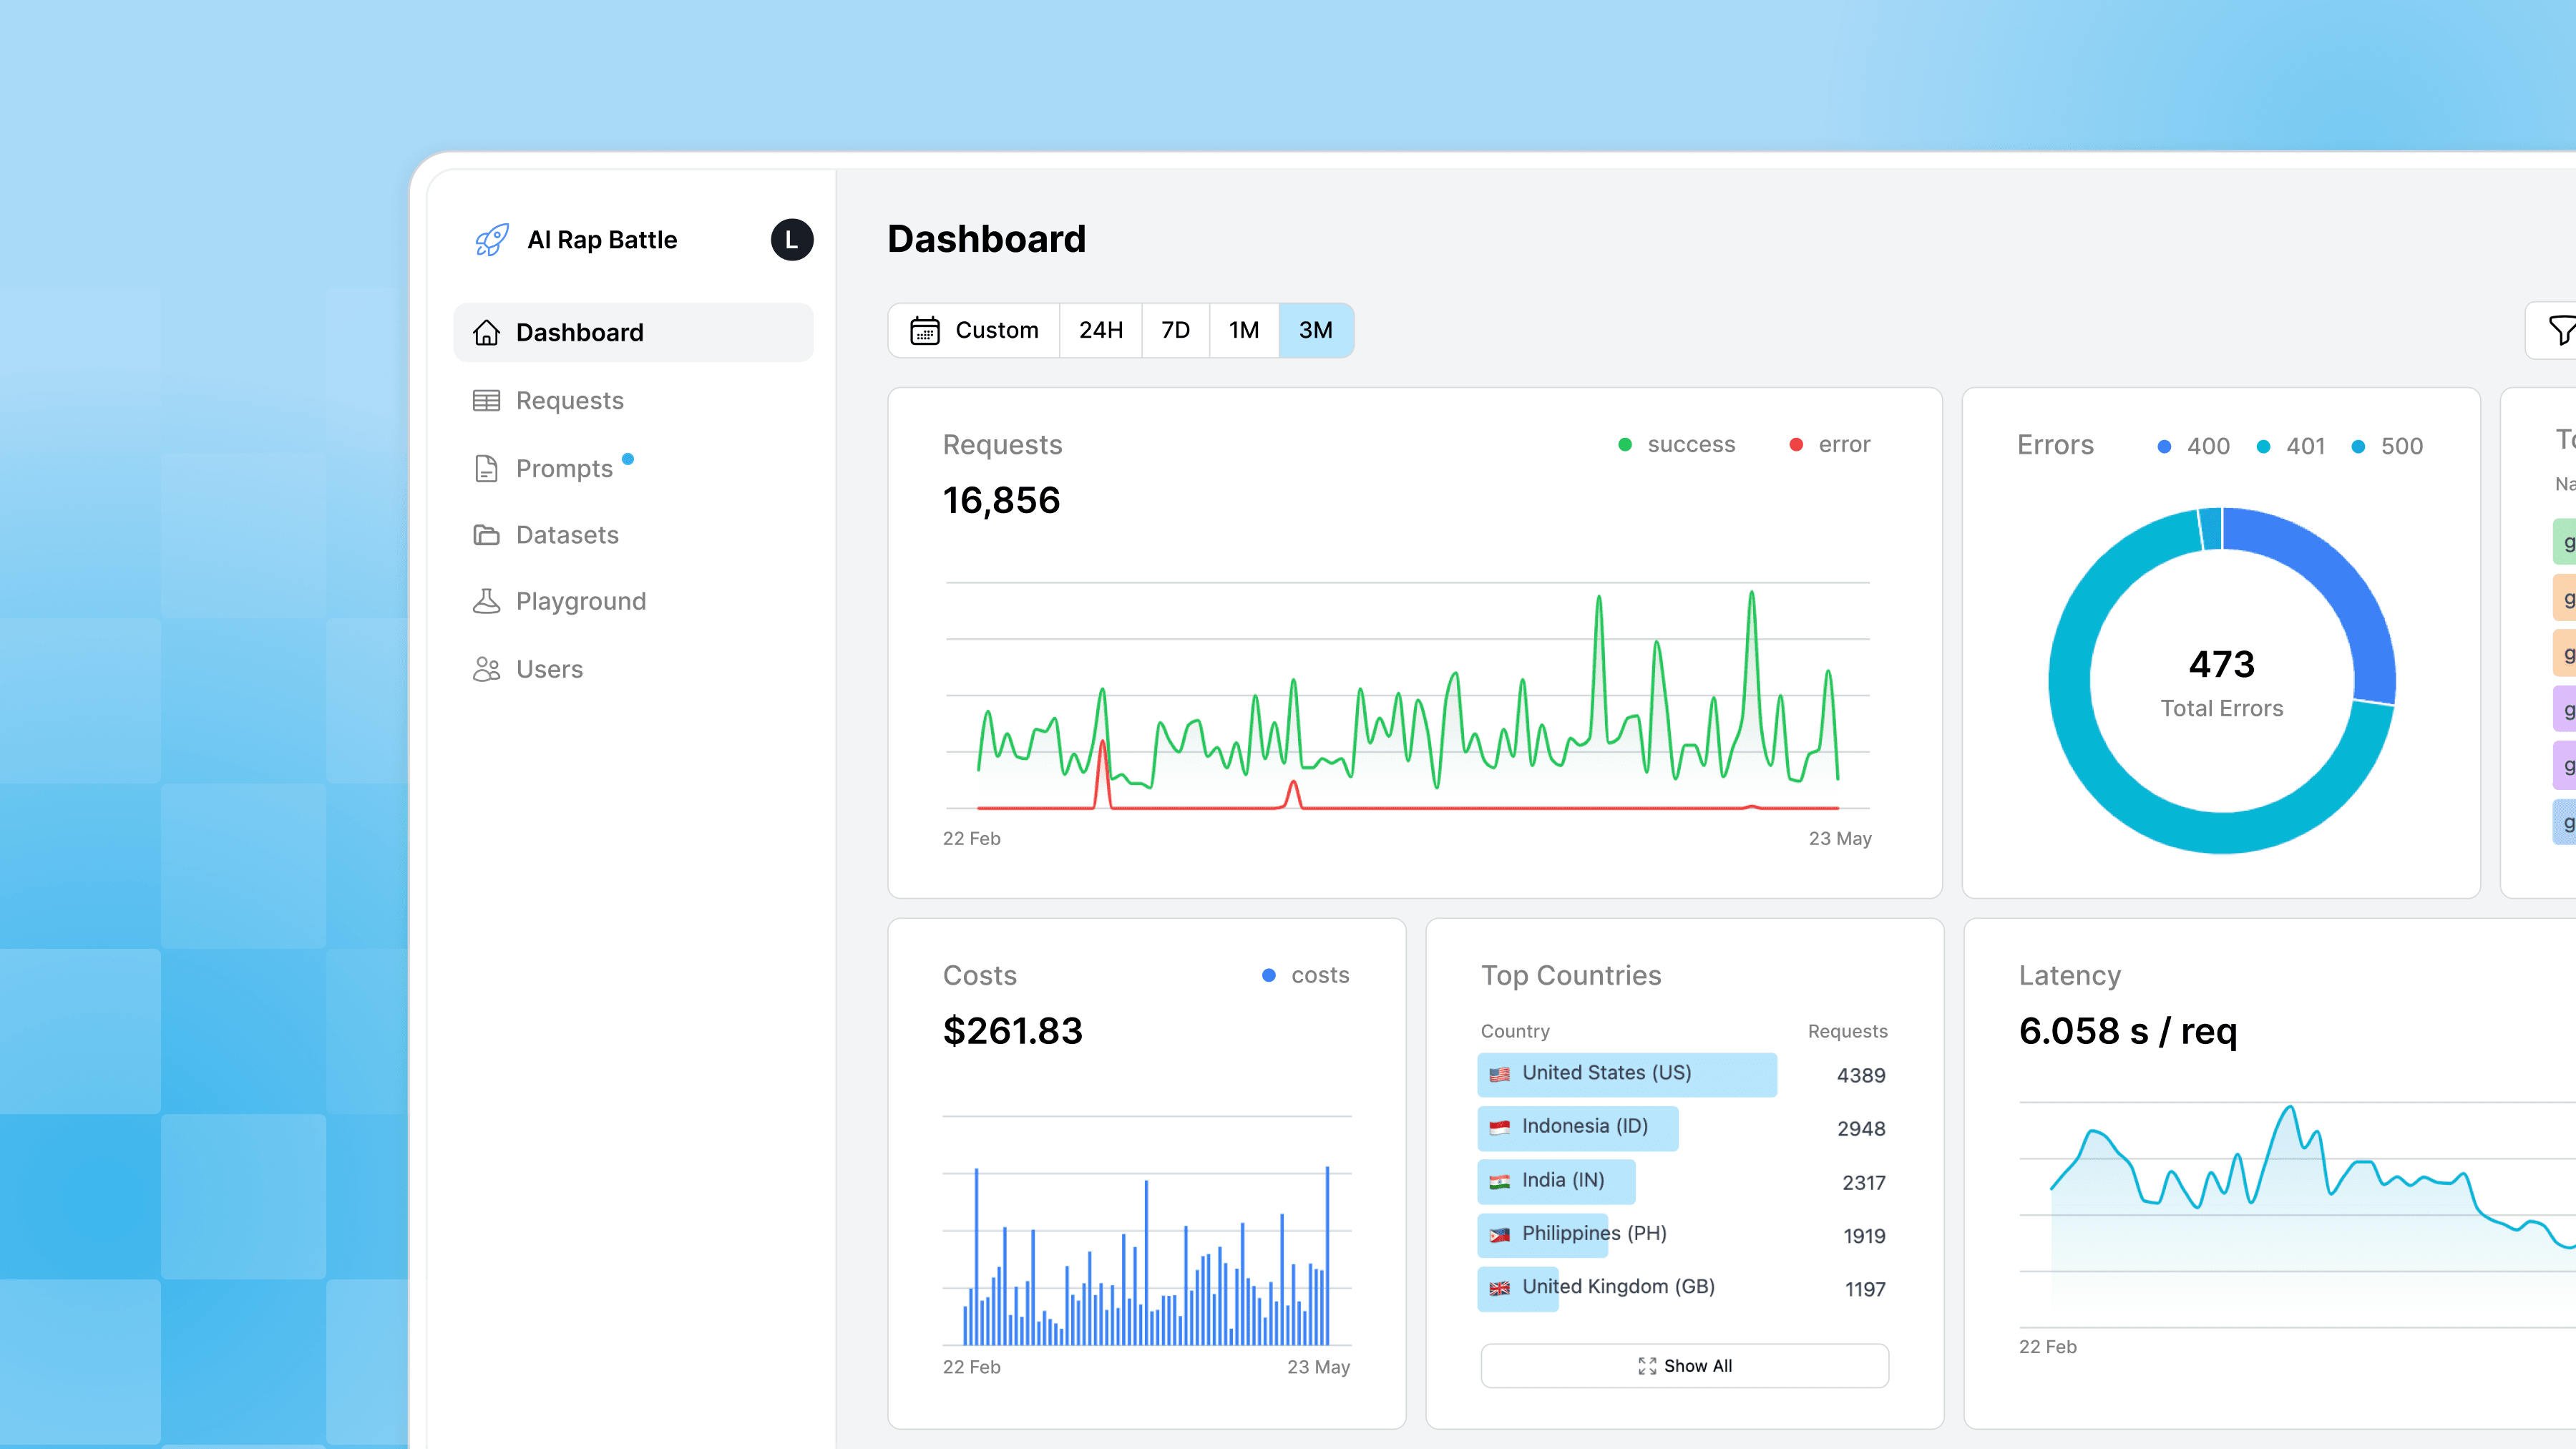
PostHog is an all-in-one developer platform that combines LLM observability with several other developer-focused tools, such as product and web analytics, session replay, feature flags, experiments, error tracking, and surveys.

Its LLM observability product (known as AI Observability) integrates with popular LLM providers, captures details of generations, provides an aggregated metrics dashboard, and more.

PostHogPostHog

What makes PostHog special?

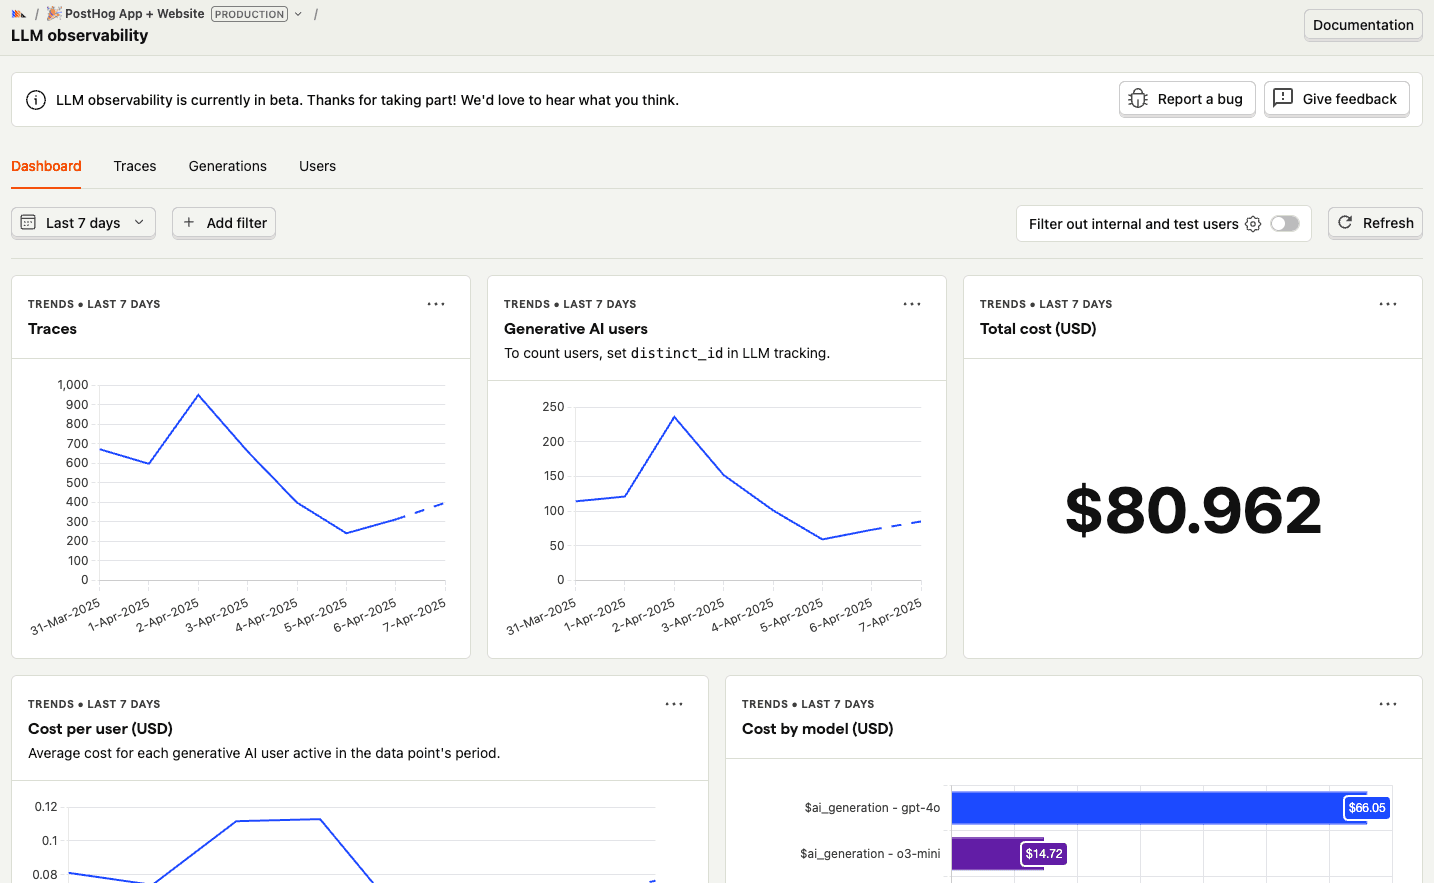
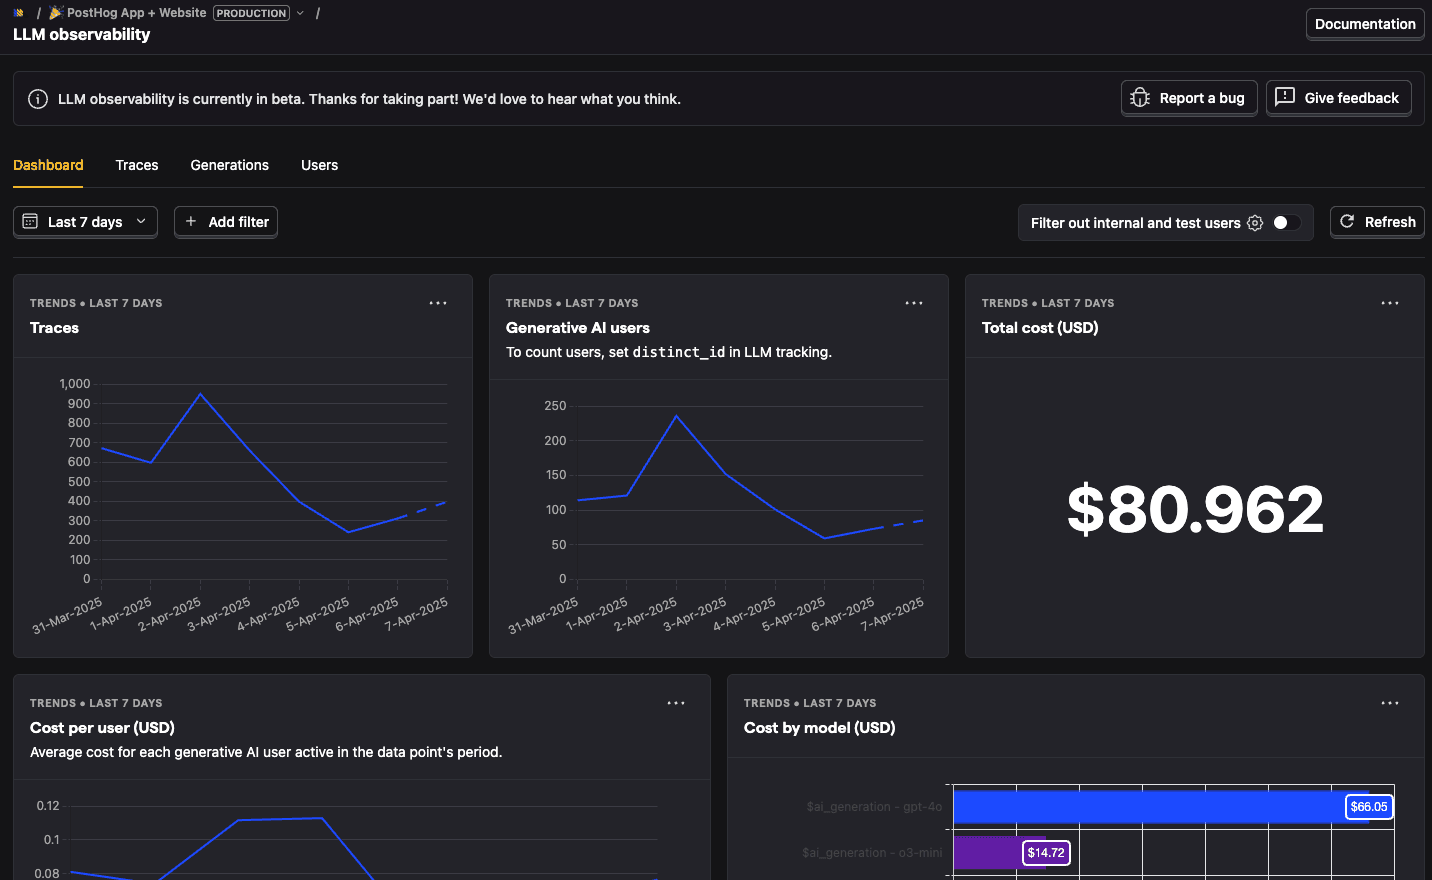
PostHog’s AI Observability app works with the rest of our dev tool suite. This means you can visualize LLM-related data along product and business data, create custom queries using SQL, view session replays of AI interactions, A/B test prompts, and more.

Two features worth highlighting for teams iterating on LLM apps:

  • Prompt management (beta): Create and version prompts directly in PostHog. Prompts are fetched at runtime via the SDK with caching and fallback support, so you can update them without code deploys. Non-engineers can iterate on prompts from the UI, and every change creates an immutable version you can compare, restore, or link to traces to see which prompt versions drive which outputs.

  • Evaluations (beta): Score LLM outputs automatically or with human review to track quality over time – not just whether API calls succeed, but whether they're actually good.

PostHog’s hosted Cloud version and all of its AI Observability features are free to use. It comes with 100k LLM observability events for free every month with 30 day retention. Beyond this, pricing is usage-based and totally transparent.

Use the setup wizard to get started in minutes – no sales call or elaborate configuration needed.

Langfuse (recently acquired by ClickHouse) is an open source LLM engineering platform. It provides LLM call tracking and tracing, prompt management, evaluation, datasets, and more. These give LLM app developers tools they need for their entire workflow.

Langfuse can be self-hosted for free. If you prefer a managed service, Langfuse Cloud is free to use up to 50k events per month and 2 users, but this only includes 30 day data access. Pricing beyond this starts at $29/m for 100k events with additional events at $8/m more.

Langfuse dashboard

What makes Langfuse special?

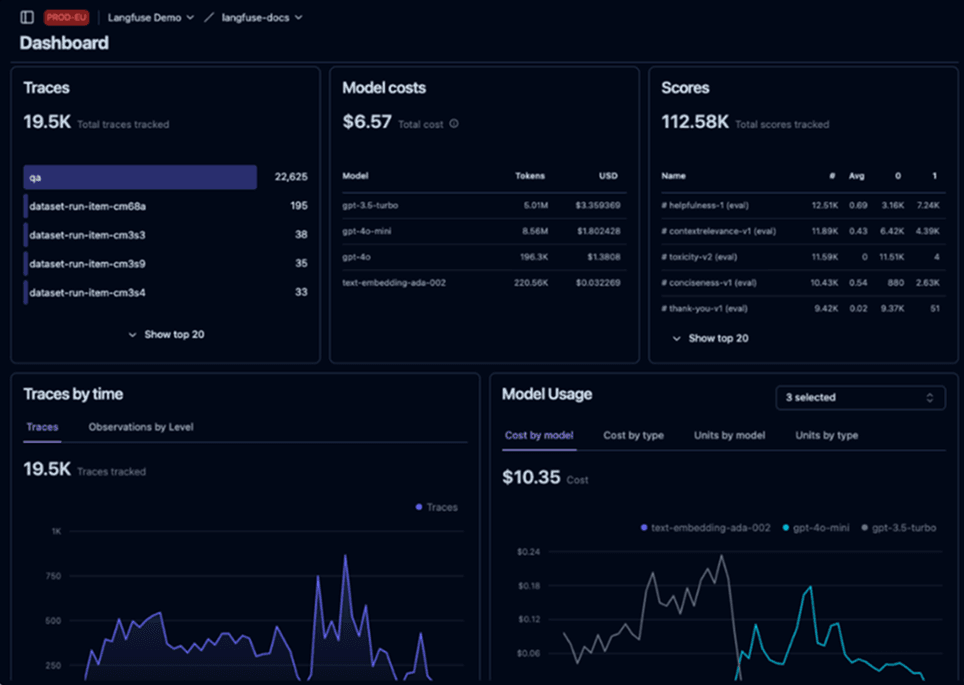
Langfuse is one of the original tools in the LLM observability space. This means it has a wide range of tools for LLM app developers to use and have been instrumental in defining what they look like.

It also claims to be the most used open LLMOps platform. Beyond its early entry, this is thanks to its integrations with most LLM providers and agent frameworks, native SDKs for Python and JavaScript, and its ability to act as an OpenTelemetry backend

Langfuse is also the most fully-featured LLM observability tool. Its pricing page lists a huge 78 features from session tracking to batch exports to SOC2 compliance.

Opik is an open source platform for evaluating, testing, and monitoring LLM apps. It provides tracing, annotations, a prompt and model playground, evaluation, and more. It’s built by Comet, an end-to-end model evaluation platform for developers.

Opik’s free hosted plan provides 25k spans per month with unlimited team members and a 60-day data retention. Beyond this, its Pro plan is $19 per month for 100k spans per month with every extra 100k spans costing $5.

Opik dashboard

What makes Opik special?

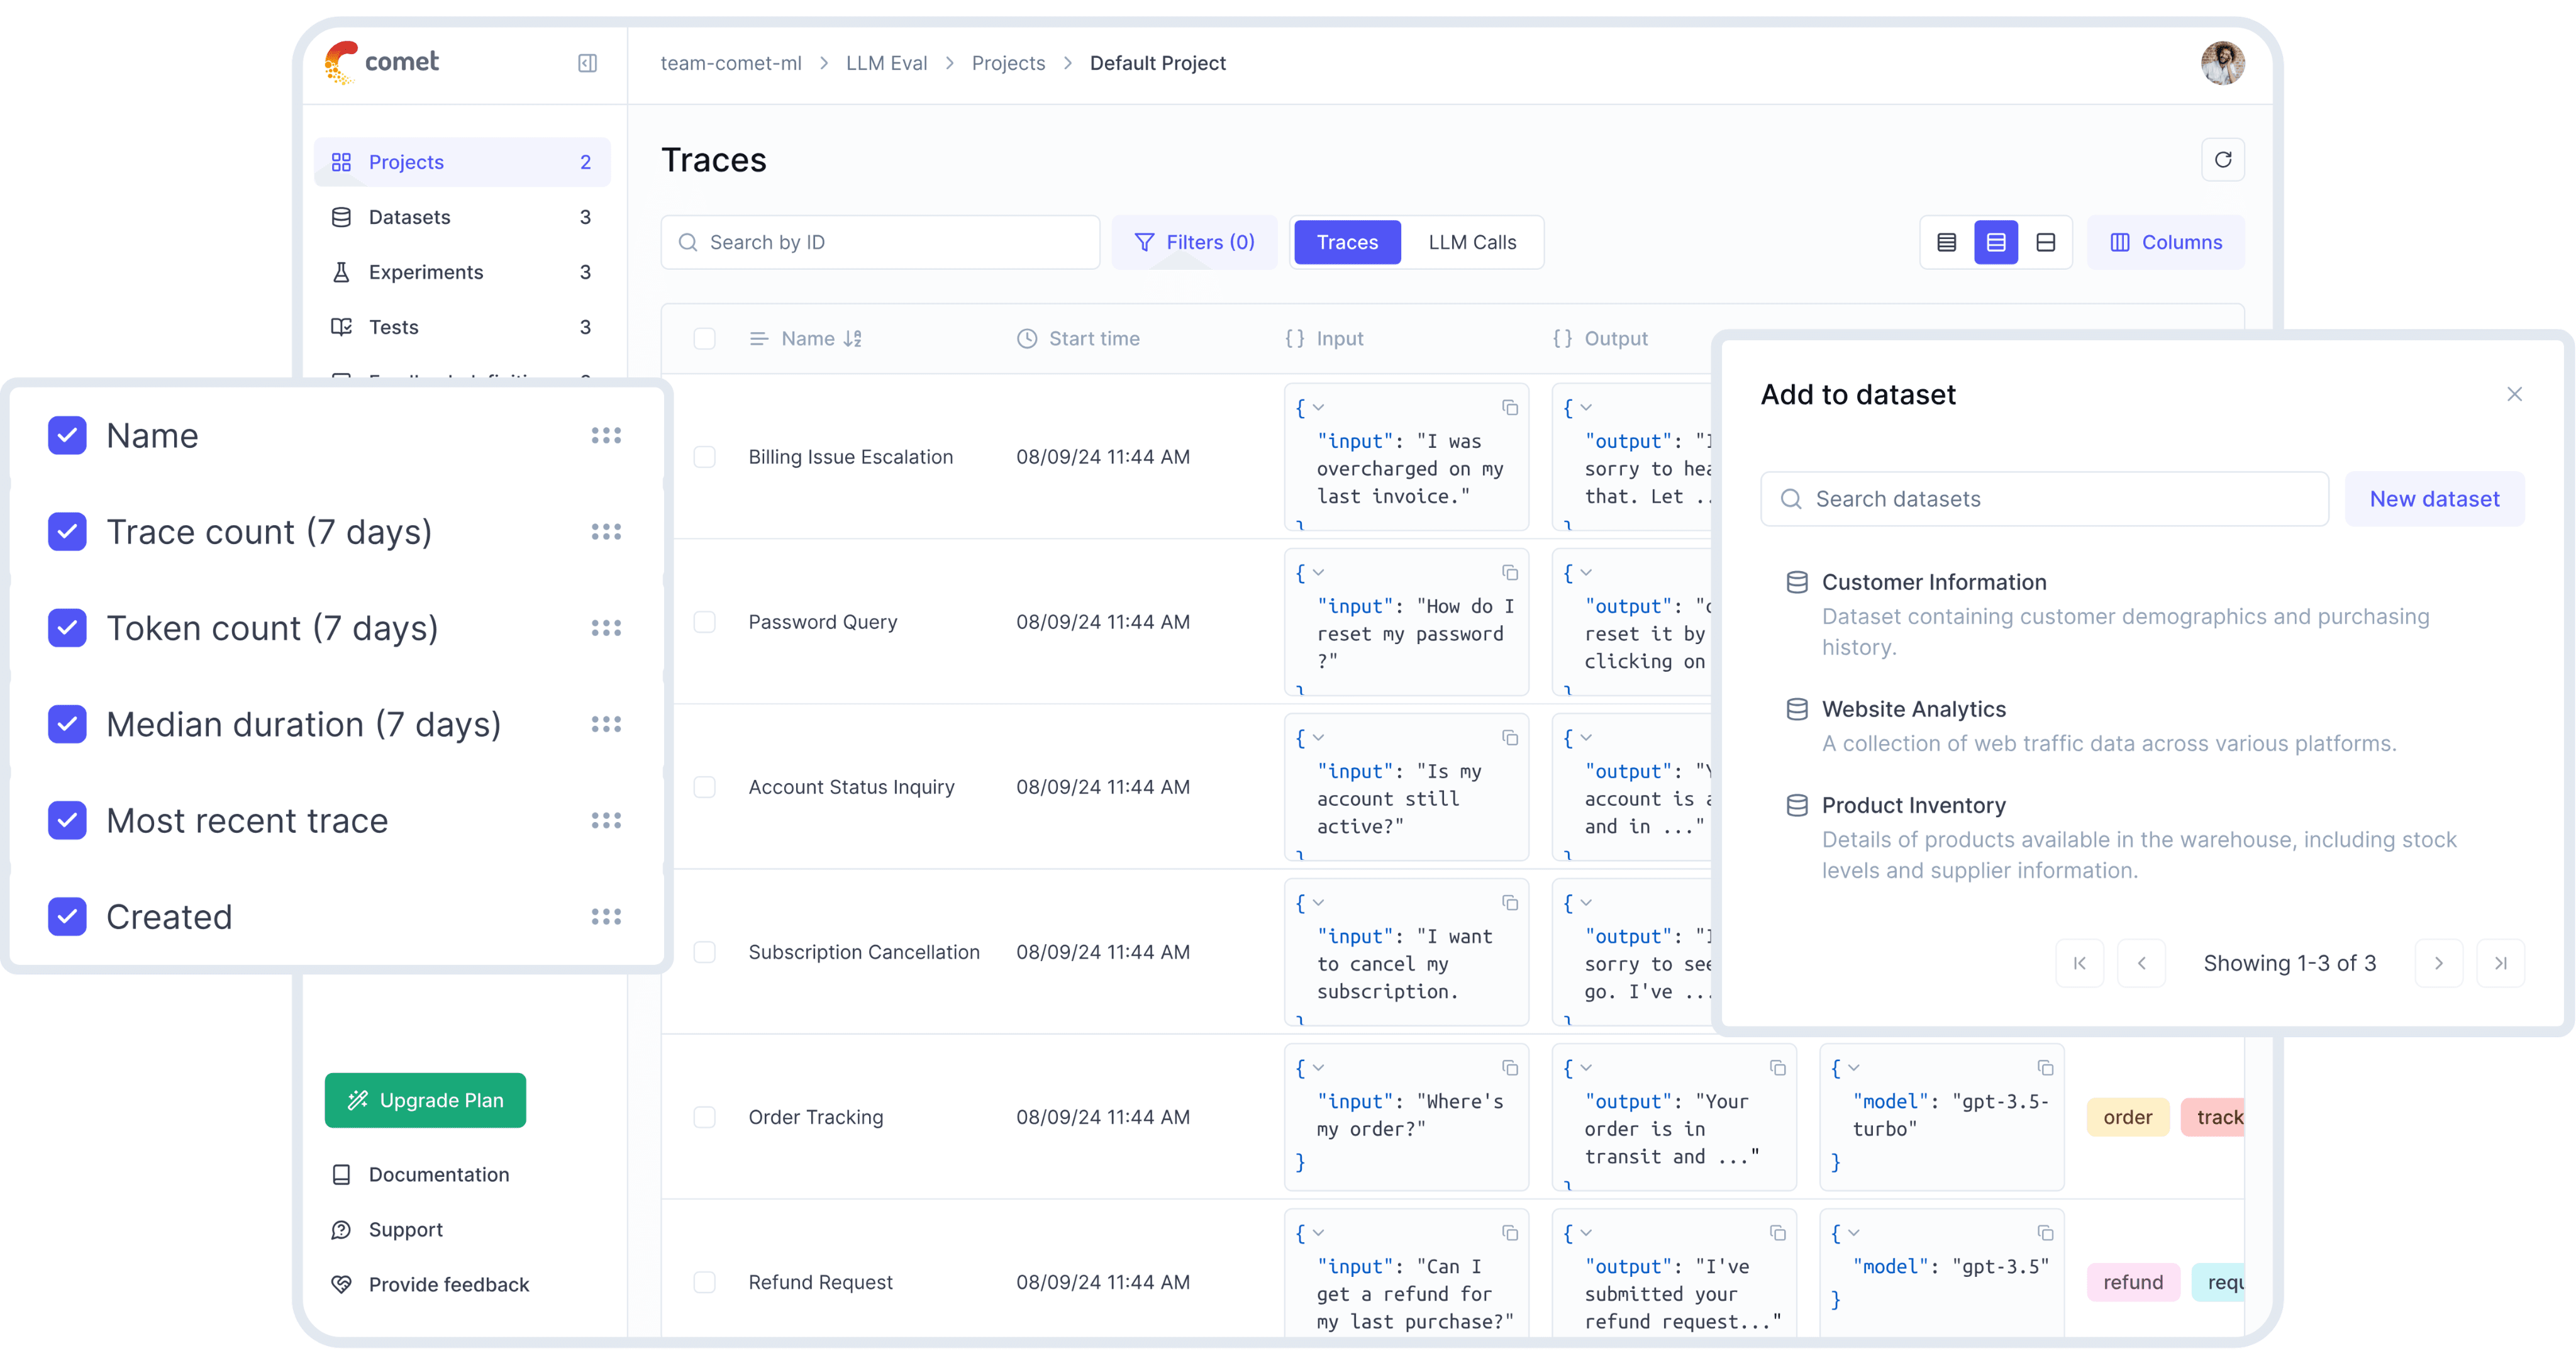
Thanks to Opik’s integration with Comet, it’s the only tool on this list that appeals to LLM developers, not just LLM app developers. This means it is ideal for teams training and hosting models of their own, not just using the LLM providers.

OpenLLMetry is an open-source observability product for LLM applications based on OpenTelemetry. It was built by Traceloop and recommends using its SDK to capture data.

Traceloop is free up to 50k spans per month and 5 seats, but this only provides 24-hour data retention. Beyond this, you’ll need to talk to sales.

OpenLLMetry can capture data from a range of LLM providers, vector DBs, and LLM frameworks. It can then send this data to a range of supported destinations from Traceloop to Datadog to Honeycomb.

OpenLLMetry dashboard

What makes OpenLLMetry special?

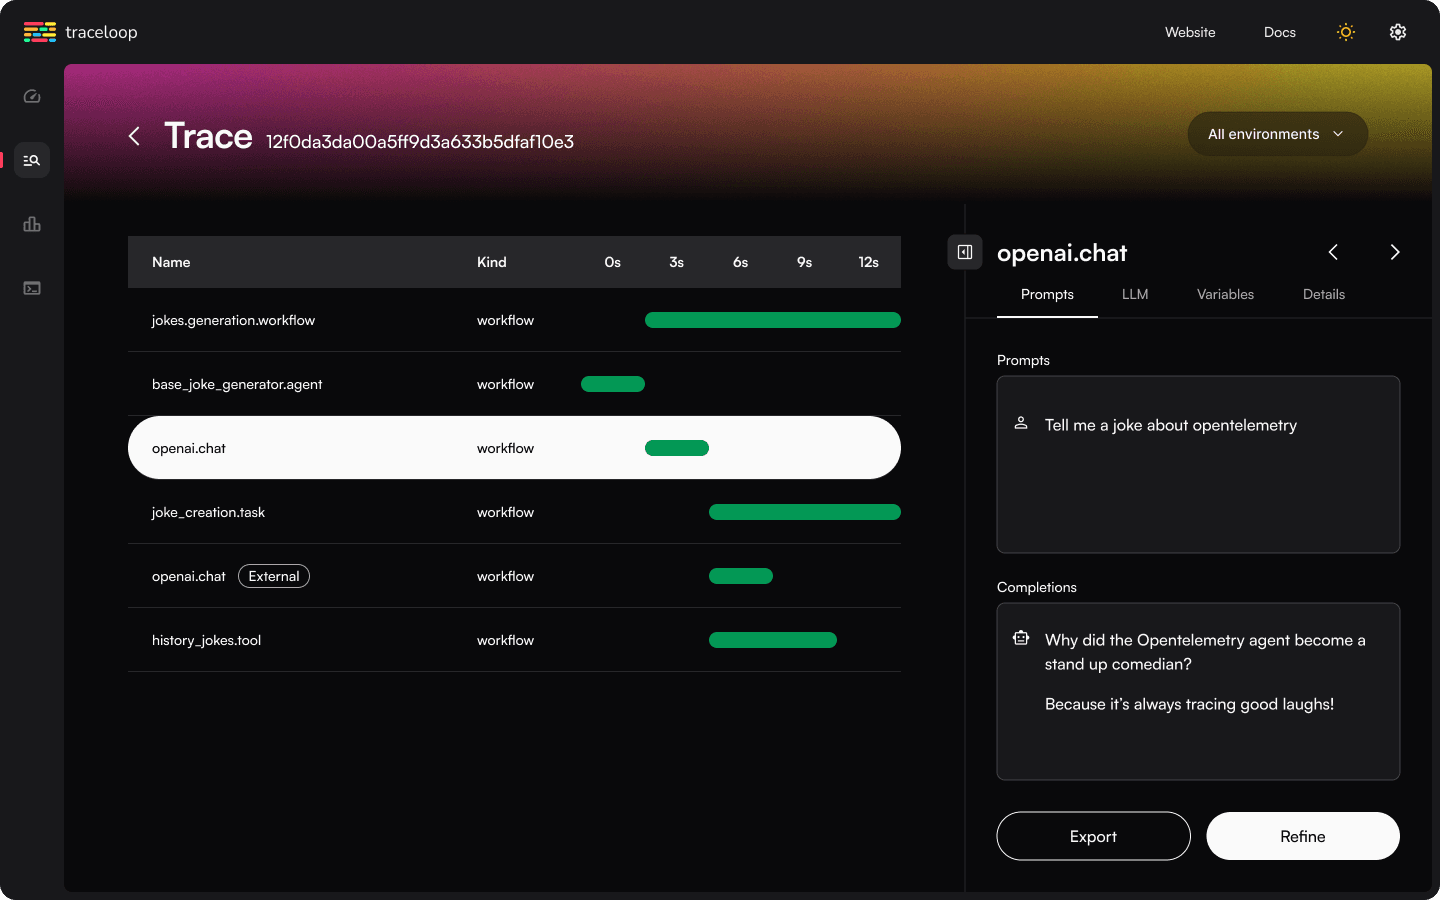
With its range of extensions and destinations, OpenLLMetry is very likely to integrate with the observability tools you already use.

It integrates with the broader OpenTelemetry ecosystem, meaning it can instrument things like your database, API calls, and more. Their semantic conventions for LLM were also adopted by the OpenTelemetry project.

Phoenix is an open source AI observability platform. It provides tracing, evaluation, experiments, prompt management, and more. It works out-of-the-box with frameworks like LlamaIndex and LangChain as well as LLM providers like OpenAI, Bedrock, and more. It’s built by Arize AI, a unified AI observability and evaluation platform.

Arize doesn’t provide a free hosted version of Phoenix. Their product, AX Pro, starts at $50 per month for 10k spans and up to 3 users.

Phoenix

What makes Phoenix special?

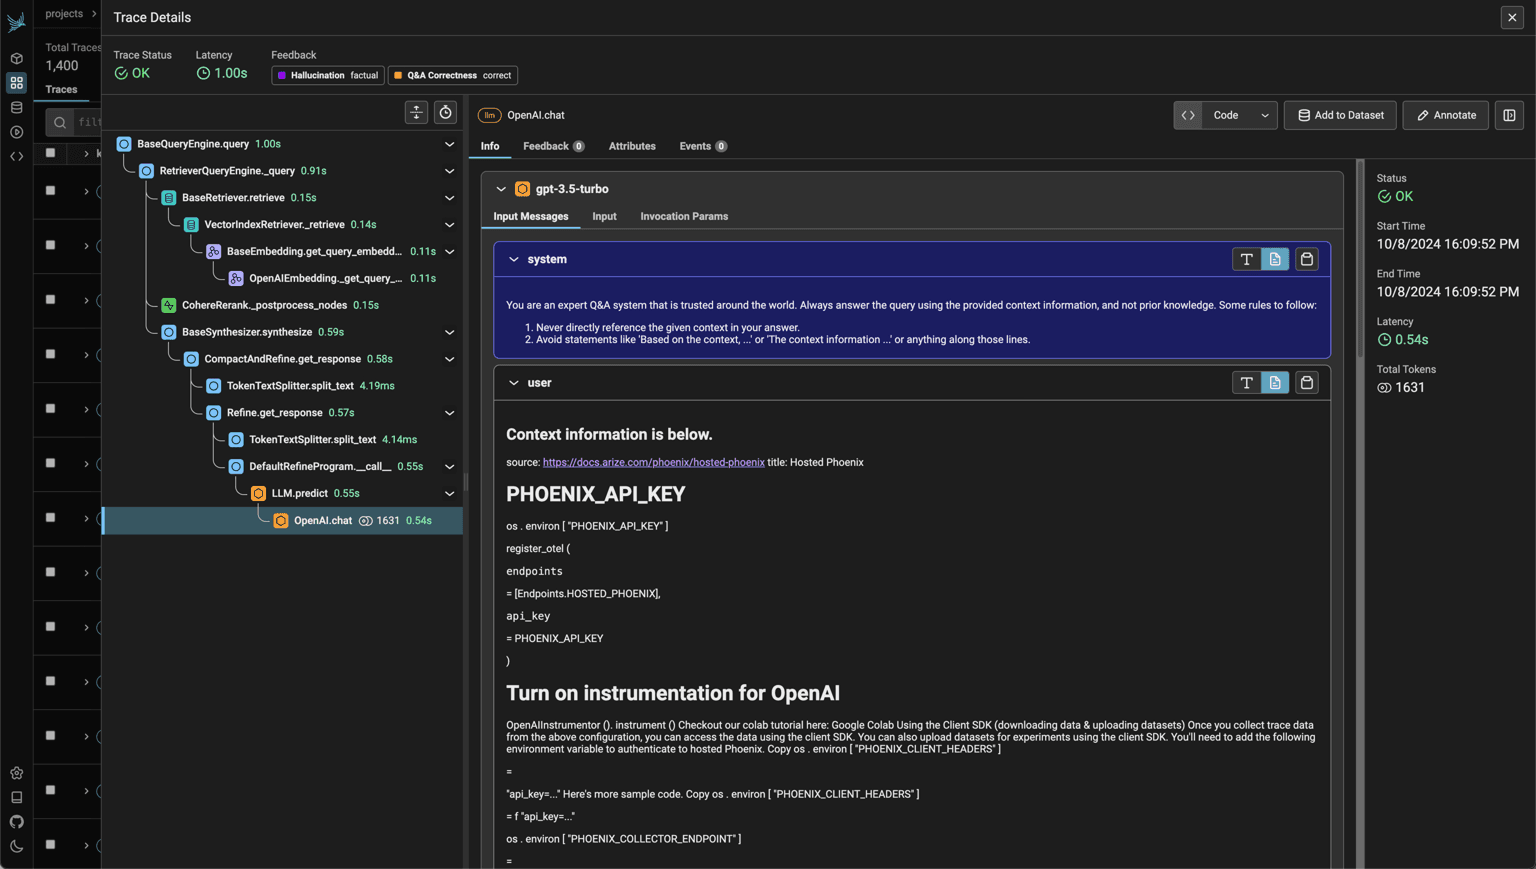
Similar to OpenLLMetry, Phoenix works well with OpenTelemetry thanks to a set of conventions and plugins that are complimentary to OpenTelemetry. This means Phoenix can more easily integrate into your existing Telemetry stack.

Like Opik, Phoenix is connected to a broader AI development platform. Unique to Arize’s platform is their observability tools for ML and computer vision helping developers debug and improve these systems.

Helicone is an open source platform for monitoring, debugging, and improving LLM applications. Beyond integrations with popular LLM providers, tracing, and an aggregate analytics dashboard, Helicone provides more tools like prompt management and evals.

Recently acquired by Mintlify, it will continue operating in maintenance mode.

Its hosted version is free up to 10,000 requests with some features limited to the $79/m pro and $799/m team plans. The costs for requests beyond the first 10,000 is unknown, though.

Helicone dashboard

What makes Helicone special?

Helicone provides purpose-built tools for improving LLMs, like its prompt playground, prompt management, evaluation scoring, and feedback. This helps developers improve their LLM applications.

For developers focused on performance and reliability concerns, Helicone also contains both proxy and async interfaces for integrating with LLM providers. This ensures Helicone is only on your critical path if you want it to be.

  • Want LLM observability running alongside product analytics, session replay, A/B testing, feature flags, and more in one platform for full visibility? PostHog
  • Need the most fully-featured LLM observability platform? Langfuse
  • Building or fine-tuning models as well as LLM apps? Opik (via Comet)
  • Already using OpenTelemetry and want LLM instrumentation to fit into your existing stack? OpenLLMetry
  • Need AI observability beyond LLMs – including ML models and computer vision? Phoenix
  • Want purpose-built tools for improving LLM outputs through prompt iteration and evals? Helicone

Is PostHog right for you?

Here's the (short) sales pitch.

We're biased, obviously, but we think you'll love PostHog if:

  • You want LLM observability connected to the rest of your product data – session replays, feature flags, A/B testing, and analytics all in one place
  • You're already using PostHog, so adding AI Observability requires no extra setup or contract
  • You want to try before you buy (we're self-serve with a generous free tier)

It's completely free to get started – no credit card required. Our setup wizard handles configuration in minutes, or you can check out our docs to do it yourself.

What is LLM observability?

LLM observability is the practice of monitoring and understanding how your LLM-powered application behaves in production. It typically includes capturing individual LLM calls (inputs, outputs, latency, token usage), aggregating metrics across requests, and providing tools to debug issues and improve model performance.

It's similar to traditional application observability, but focused on the unique characteristics of LLM systems – non-deterministic outputs, high token costs, prompt sensitivity, and the challenge of evaluating quality.

What features do you need in an LLM observability tool?

A good LLM observability tool gives you visibility into how your AI-powered app is performing in production. Most solid tools include:

  • Tracing and logging to capture individual LLM calls, inputs, outputs, and latency
  • Cost tracking to monitor token usage and spend across providers and models
  • Aggregated dashboards for monitoring performance trends over time
  • Self-hosting options so you keep full control of your data and model inputs

More advanced tools go further with:

  • Prompt management for versioning, testing, and deploying prompts
  • Evaluation and evals to score model outputs automatically or with human review
  • Datasets for curating examples and running regression tests
  • Integration with product analytics so you can connect LLM performance to user behavior
  • OpenTelemetry compatibility for teams with existing observability infrastructure
When should you consider an LLM observability tool?

If you're building an LLM-powered app and have shipped to real users, you need one. Common signals that you're ready:

  • You're not sure which prompts or models are causing user drop-off
  • You're spending more on tokens than expected and don't know where the cost is going
  • You have no visibility into latency spikes or failure rates
  • You want to run evals or compare model versions systematically

Most tools on this list are free to start, so there's no reason to wait.

Do I need a separate LLM observability tool if I already use PostHog?

No. PostHog's LLM observability product is built into the platform, so if you're already using PostHog for product analytics or session replay, you can add LLM observability without any additional setup or contract. You get 100k LLM events free per month.

Getting started is easy; once you install the SDK, it will handle all the heavy lifting. Use your LLM provider as normal and we'll capture everything automatically.

What's the difference between LLM observability and traditional application monitoring?

Traditional application monitoring focuses on things like error rates, latency, and uptime – binary metrics where something either works or doesn't.

LLM observability adds a quality dimension: you need to evaluate whether model outputs are actually good, not just whether the API call succeeded. This is why tools like Langfuse and Opik invest heavily in evals, human review, and prompt management – capabilities that don't exist in traditional APM tools.

Are these tools compatible with all LLM providers?

Most tools on this list support the major providers – OpenAI, Anthropic, Google Gemini, and AWS Bedrock – as well as popular frameworks like LangChain, LlamaIndex, and Vercel AI SDK. Coverage varies by tool. Langfuse and PostHog have the broadest integration coverage.

For specific provider support, check each tool's documentation.

Subscribe to our newsletter

Product for Engineers

Read by 100,000+ founders and builders

We'll share your email with Substack