





Tokio, Rayon, and a Kubernetes pod walk into a bar. Nobody gets served.
Even though Rust is known for its performance and safety, overlooking its inner workings often causes you to shoot yourself in the foot.
We know because it happened to us. We discovered a big performance bottleneck in the hot path of our feature flags service. Solving it reduced mean p99 latency by 4x, from 2.5 second spikes to a flat 94 ms line.
Here's how we found it and everything we learned along the way.
Feature Flags sits in a uniquely latency-sensitive spot compared to most PostHog products. It needs to be as close to real time as possible. A slow flag evaluation means a customer's application is stuck waiting for a response before it can proceed. That’s a tough requirement for a service that also needs to scale well while doing compute-intensive work.
Although the Rust rewrite of our feature flag service resulted in a bunch of performance gains, as we grew to serve twice the traffic, problems arose again. Latency, which the rewrite made up to 10.6x faster, was spiking. Our application was "randomly" freezing up.

Our initial thought was that it was a database issue. Connection pools were maxing out at 100% multiple times a day, and connection acquire times were spiking in direct correlation with the p99 latency spikes. That's usually a clear signal. But as we dug deeper, the database turned out to be innocent.
We pulled up the Aurora RDS metrics expecting to find the culprit. Instead: query execution times were fast and stable, CPU utilization was healthy, no external pressure. Something else was making it look slow from the application's point of view.
We then looked at scaling. The Horizontal Pod Autoscaler (HPA), Kubernetes' mechanism for automatically adding or removing pods based on load, was kicking in during spikes, but always too late. More importantly, having more or fewer pods didn't change the latency at all. This showed it wasn't about capacity. The problem was inside every single pod.
The hint that shifted our focus was CPU throttling. CFS (Completely Fair Scheduler) throttling, Linux's mechanism for capping how much CPU time a container gets, was spiking in lockstep with the p99 latency, but the mean CPU utilization was low. That's a telling pattern: the pods weren't running out of CPU on average, they were getting throttled in short bursts.
Something was creating intense, brief CPU demand that the scheduler couldn't smooth out. And the connection pool metrics now made sense too: connection acquire times and pool utilization were spiking together with latency, not because the database was slow, but because the application couldn't even get to the point of asking the database for a connection. The I/O runtime was frozen.
With that, we stopped looking at the database and started looking at what was happening inside the application.
Under the hood, we relied on two popular Rust crates (or libraries): Tokio and Rayon.
TL;DR: Tokio allows you to wait for a bunch of things at the same time, and Rayon allows you to do a bunch of things at the same time.
Tokio is the go-to Rust solution for async operations. It creates a runtime that manages all your application's async tasks. By default, it creates a runtime with the same number of worker threads (actual OS-level threads) as the number of CPU cores available.
The management and coordination of tasks and worker threads is abstracted away from users – Tokio does it for you. Think of it as the multi-threaded Rust version of JavaScript's event loop. Tokio's tasks and architecture are built around the async model: waiting for many operations at the same time.
Rayon is a data-processing crate. Its main purpose is to "make it drop-dead simple to convert sequential computations into parallel ones." It can split data, process it in different threads, and glue the pieces back together. Naturally, there's some overhead in coordinating this process, so it shines with big datasets where that overhead pays off.
By default, Rayon also creates a ThreadPool with – unsurprisingly – the same number of OS-level threads as there are CPU cores available.
We used a combination of Tokio and Rayon in an uncoordinated way. Both crates spawned as many threads as the number of CPU cores they detected (based on the K8s CPU limit). That meant 100% thread oversubscription—we created twice the number of threads we should have, and CFS had to constantly juggle them.
This was our first hint at the problem, but it wasn't the main issue. Thread oversubscription made things worse (the Linux CPU scheduler throttled harder with more threads fighting for time), but the real culprit was how we were calling Rayon in the first place.
Takeaway: Defaults assume they own the machine and won't take into account your specific usage patterns. Both Tokio and Rayon default to "use all available cores" because they assume they're the only thing running. In a container with a capped CPU budget, that assumption breaks immediately. If you run more than one thread pool, it's important to budget.
Rayon's par_iter() was being called directly in the request handler, managed by Tokio, for every flag evaluation request. This means that the worker thread, which was supposed to be dealing with I/O, sat blocked waiting for Rayon to process the flag payload.
Not only that, but since every request tried to use Rayon's thread pool, with no backpressure, Rayon's parallelism collapsed into contention.
Blocking the I/O worker threads is one of the single worst things that can happen to an I/O bound application.
While the workers are blocked, the application won't poll futures. This means no HTTP requests being answered, no DB or cache interaction, so effectively an app-level freeze. When we got unlucky and most workers blocked simultaneously, our p99 and p95 response times would spike up to 2.5 seconds, with a big number of gateway 504 timeouts as well.
When you want to block the thread, like the CPU-bound computation work we need to do, the best practice is to offload it from the I/O workers. Alice Ryhl's Async: What is blocking? is a great deep dive on doing this. The core idea is: your application should not spend too much time stuck between .await calls.
Our chosen solution was to dispatch the work to a separate thread pool using Rayon. This required:
.awaitrayon::spawn to dispatch the work to Rayon's thread pool and wait for it to finish up with a tokio::sync::oneshot channel. This enabled us to use Rayon while leveraging the async model. The workers don't wait anymore, they effectively run free to deal with I/O.A concrete example of the concept:
A semaphore (essentially a counter that limits how many threads can access a given resource at the same time) also gates the Rayon thread pool, working as a pressure valve. Without any backpressure, Rayon's internal work queue could grow without limit during traffic bursts, causing queueing delays to snowball. At most N batches are in-flight at once. If the pool is full, the request waits asynchronously.
On the infrastructure side, we also bumped the Kubernetes CPU limit to give the combined pools burst headroom, and pinned the thread count to the CPU request rather than the limit. This matters because Rust's available_parallelism() reads the cgroup limit, not the request, so without the override the pools would silently create more threads than they had guaranteed CPU for.
We also noticed not every request benefits from Rayon. If 10 flags are going to be evaluated, the overhead is not worth it. By default, requests with under 200 flags in US (and 100 in EU) will be evaluated sequentially. This gives the parallel pool more breathing room and makes it more effective.
Takeaway: Don't parallelize what doesn't need it (premature optimizations being the root of all evil and all that). 85–90% of our requests were paying the overhead of parallel dispatch for no benefit. Adding a threshold so that only large batches use Rayon was one of the simplest changes we made, and one of the most impactful.
At the same time, we also found and fixed an issue with our flag dependency evaluation.
Feature flags can depend on other flags. If flag B depends on flag A, you need to evaluate A first. This forms a dependency graph, and how you build and traverse it matters. The old implementation was doing two wasteful things:
Building the graph from every flag in the system: If a request needs to evaluate 20 flags, but the team has 500 defined, the old code would still walk all 500 to build the graph. Most of that work was thrown away.
Using a slow algorithm to figure out evaluation order: Flags need to be evaluated in stages, first the ones with no dependencies, then the ones that depend on those, and so on. The old approach repeatedly scanned the entire graph looking for "ready" nodes, which is O(n²). Fine for small graphs, painful when they grow.
For (1), we switched to a BFS closure: start from the flags you actually need, follow their dependencies, and stop. You only touch what's reachable. For (2), we replaced the repeated scans with Kahn's algorithm, which computes the evaluation order in a single pass, so O(V+E) instead of O(V²).
The impact was noticeable: lower memory usage (fewer flags cloned into the graph) and more stable response times. This was directly responsible for smoothing out the remaining rough edges and made the latency line even flatter.
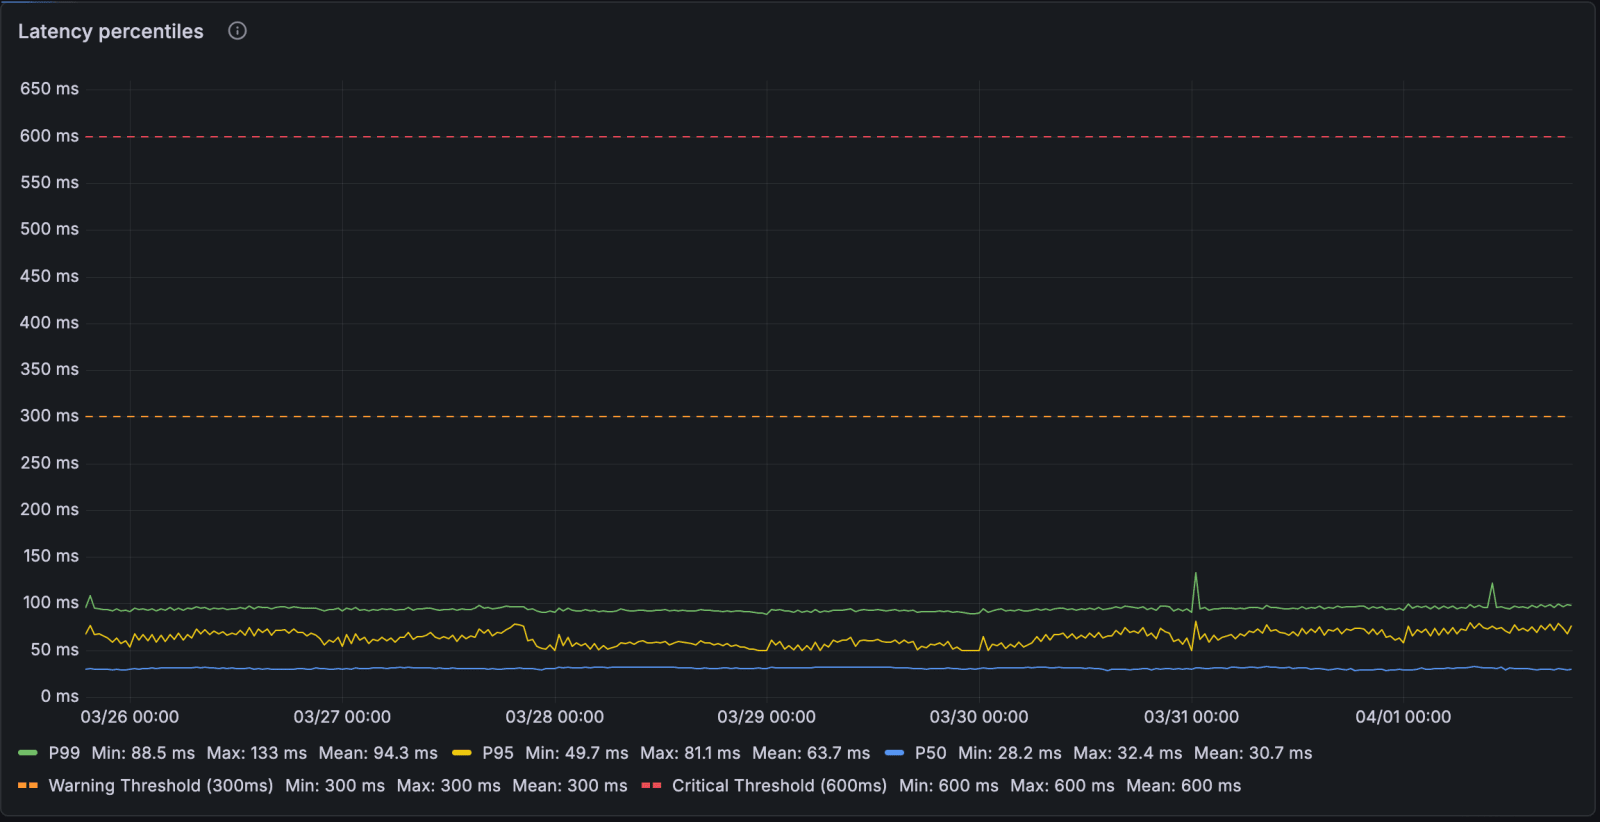
First, notice the differences in the Y-axis scale. This graph shows 0 to 650ms, while the first graph showed 0 to 2.8 seconds. This represents a dramatic change: the mean p99 dropped from ~460ms to ~94ms. The latency spikes are rare throughout the week, and get to at most 200ms.
We now never need to get past the minimum replica count (currently, 50 pods), even during peak traffic. The service doesn't respond to the 2x diurnal traffic swing at all, the p99 is the same at 3am as it is at peak.
When dealing with services that need to balance intensive compute and IO (and a lot of other software engineering problems, really), there is no silver bullet or definitive solution. To get to a good solution that solved our issues, we had to come up with hypotheses with the information we had in hand, place the correct metrics and test them out, comparing results of different approaches.
This wasn't just a Rust-specific problem. The same class of bug (CPU-heavy work blocking an async I/O runtime) shows up in Node.js event loops, Go goroutine schedulers, and anywhere else cooperative scheduling meets capped compute.
The symptoms told us it was a database problem. It wasn't. The maxed-out connection pools, the spiking acquire times and the timeouts were all a downstream effect of the I/O runtime being starved. Pool utilization now sits at ~10%, and connection acquire time p99 is steady at ~4ms. If we had just thrown more pods at it (which we did, at first), we'd still be firefighting today.
Instead, Feature Flags now serves ~13,000 requests per second with a p99 under 100ms, on a flat fleet of 50 pods that doesn't flinch during traffic spikes. That's where we wanted to be: fast enough that flag evaluations are close to invisible to the applications relying on them.
If you want to go deeper on any of the topics covered here:
rayon::spawn + oneshot pattern we adopted.If you want to see the actual code changes:
rayon::spawn + oneshot pattern.此内容由惯性聚合(RSS阅读器)自动聚合整理,仅供阅读参考。 原文来自 — 版权归原作者所有。