


惯性聚合 高效追踪和阅读你感兴趣的博客、新闻、科技资讯
阅读原文 在惯性聚合中打开

推荐订阅源

博客园 - 三生石上(FineUI控件)
L
LangChain Blog
酷 壳 – CoolShell
酷 壳 – CoolShell
Blog — PlanetScale
Blog — PlanetScale
H
Hackread – Cybersecurity News, Data Breaches, AI and More
D
Docker
T
Tailwind CSS Blog
T
The Blog of Author Tim Ferriss
U
Unit 42
B
Blog
N
Netflix TechBlog - Medium
T
Threat Research - Cisco Blogs
OSCHINA 社区最新新闻
OSCHINA 社区最新新闻
O
OpenAI News
M
MIT News - Artificial intelligence
D
DataBreaches.Net
cs.CL updates on arXiv.org
L
LINUX DO - 热门话题
C
CERT Recently Published Vulnerability Notes
V
Visual Studio Blog
让小产品的独立变现更简单 - ezindie.com
N
News and Events Feed by Topic
Vercel News
Vercel News
T
Tenable Blog
Security Latest
Security Latest
C
Check Point Blog
云风的 BLOG
云风的 BLOG
PCI Perspectives
PCI Perspectives
月光博客
月光博客
TaoSecurity Blog
TaoSecurity Blog
cs.AI updates on arXiv.org
Project Zero
Project Zero
雷峰网
雷峰网
IT之家
IT之家
H
Hacker News: Front Page
Microsoft Security Blog
B
Blog RSS Feed
Application and Cybersecurity Blog
Last Week in AI
Last Week in AI
G
Google Developers Blog
Forbes - Security
Forbes - Security
The Register - Security
Cyberwarzone
Cyberwarzone
小众软件
小众软件
Martin Fowler
Martin Fowler
K
Kaspersky official blog
P
Proofpoint News Feed
T
Threatpost
Google Online Security Blog
Microsoft Azure Blog

PostHog's RSS Feed

Training our own AI models - PostHog From 270GB RAM to 5GB: Moving local flag evaluation from Django to Rust The best analytics stack for vibe-coded apps The do's and don'ts of minimum viable product marketing - PostHog The best MCP servers for startups, by workflow 4,063 errors closed without a human opening PostHog – here's what we learned - PostHog PostHog Code and the self-driving product - PostHog Why attacking your competitors online is dumb - PostHog The best real-time analytics platforms for developers, compared DuckDB vs ClickHouse: Why we use both at PostHog - PostHog PostHog's next chapter - PostHog Making Claude Cowork actually useful - PostHog PostHog vs Matomo in-depth tool comparison You're doing lifecycle emails wrong Untangling Tokio and Rayon in production: From 2s latency spikes to 94ms flat The best HIPAA-compliant A/B testing tools - PostHog A beginner's guide to testing AI agents - PostHog I hate the standup bot (so I built an agent to do it for me) - PostHog The best CDPs for developers, compared The best error tracking tools for developers, compared The best feature flag software for developers, compared 7 best session replay tools for mobile apps 7 best free open source business intelligence tools right now 7 best free and open source LLM observability tools PostHog vs LogRocket in-depth tool comparison The most popular PostHog alternatives, compared Open source (and self-hosted) session replay tools - PostHog The 9 best GA4 alternatives for apps and websites - PostHog PostHog vs Google Analytics 4 in-depth tool comparison How we built automatic clustering for LLM traces - PostHog The 7 best HIPAA-compliant analytics tools 8 best open source analytics tools you can self-host - PostHog The best product analytics tools for startups, compared PostHog vs FullStory in-depth tool comparison The best in-app survey tools for product teams, compared The 7 best mobile app analytics tools PostHog vs Hotjar in-depth tool comparison The 8 best free and open-source feature flag services - PostHog The 5 best free and open-source A/B testing tools - PostHog The best mobile app A/B testing tools, compared What is a feature flag? Feature Flags vs Remote Config vs A/B Testing PostHog is now available in Vercel’s v0 The best Heap alternatives & competitors, compared PostHog vs Heap in-depth tool comparison PostHog vs Pendo in-depth tool comparison PostHog × Vercel: feature flags, minus the plumbing Your logs' final destination is in GA. You always end up here anyway Behind the scenes of a PostHog hackathon - PostHog The most popular Mixpanel alternatives & competitors, compared PostHog vs Mixpanel in-depth tool comparison The 9 best GDPR-compliant analytics tools The best web analytics tools for developers, compared Stop AI slop: Run evals with LLM-as-a-Judge - PostHog You product data just got a job: Workflows is now out App onboarding: How to fix drop-off points Meet Logs (beta) – logs with all the tools you’re already using Why small teams crush tiger teams How we built user behavior analysis with multi-modal LLMs (in 5 not-so-easy steps) - PostHog The best Contentsquare alternatives & competitors, compared 8 learnings from 1 year of agents – PostHog AI - PostHog Why we killed our AI product assistant Workflows graduate to beta! Product data, meet automation The best Rollbar alternatives & competitors, compared Workflows are now in Alpha and I already broke mine - PostHog I've consistently underestimated how important communication is as a CEO - PostHog How we made feature flags even faster and more reliable The best session replay tools for developers, compared What I learned attending my first ever hackathon - PostHog Did you know AI is answering our community questions? - PostHog How not to be boring - PostHog We built an internal tool to generate changelog images for social media - PostHog What we built at our windswept Mykonos hackathon - PostHog How we built our onboarding email flow (with actual performance data) - PostHog We're building a better PostHog community by closing our public Slack - PostHog Introducing Notebooks for PostHog - PostHog Why we've launched PostHog user surveys - PostHog How we made feature flags faster and more reliable - PostHog In-depth: ClickHouse vs Redshift - PostHog Introducing HouseWatch: An open-source toolkit for ClickHouse - PostHog Introducing HogQL: Direct SQL access for PostHog - PostHog What we built at our sun-kissed Aruba hackathon - PostHog In-depth: ClickHouse vs BigQuery - PostHog In-depth: ClickHouse vs Elasticsearch - PostHog HogMail #22: Why do companies over-hire?" - PostHog Our simpler goal: Help engineers to be better at product - PostHog In-depth: ClickHouse vs Snowflake - PostHog HogMail #21: Avoiding the "Product Death Cycle" - PostHog Sunsetting Kubernetes support for PostHog - PostHog Why 'Product Engineer' is the most fun role I've had in tech - PostHog HogMail #20: Why do startups fail? - PostHog The best Google Optimize alternatives for apps and websites - PostHog Array 1.43.0: Massive performance improvements! - PostHog In-depth: ClickHouse vs Druid - PostHog HogMail #19: Which meetings should you kill? - PostHog CEO diary: The things I learned in 2022 - PostHog The essential tools used by product engineers - PostHog HogMail #18: What can SaaS learn from the New York Times? - PostHog What is a product engineer? - Product Engineer Handbook - PostHog Array 1.42.0: Get beta features via our roadmap! - PostHog HogMail #17: The personal traits that can't be taught - PostHog
How we use Logs at PostHog
Sara Miteva · 2026-01-23 · via PostHog's RSS Feed

If there’s something we do a lot here at PostHog (well, there’s many things but this one is top three), it’s dogfooding our own product.

This is a crucial part of how we build better products. We're building tools for engineers, so having our own engineers using them helps us get feedback, feature requests, and even haikus.
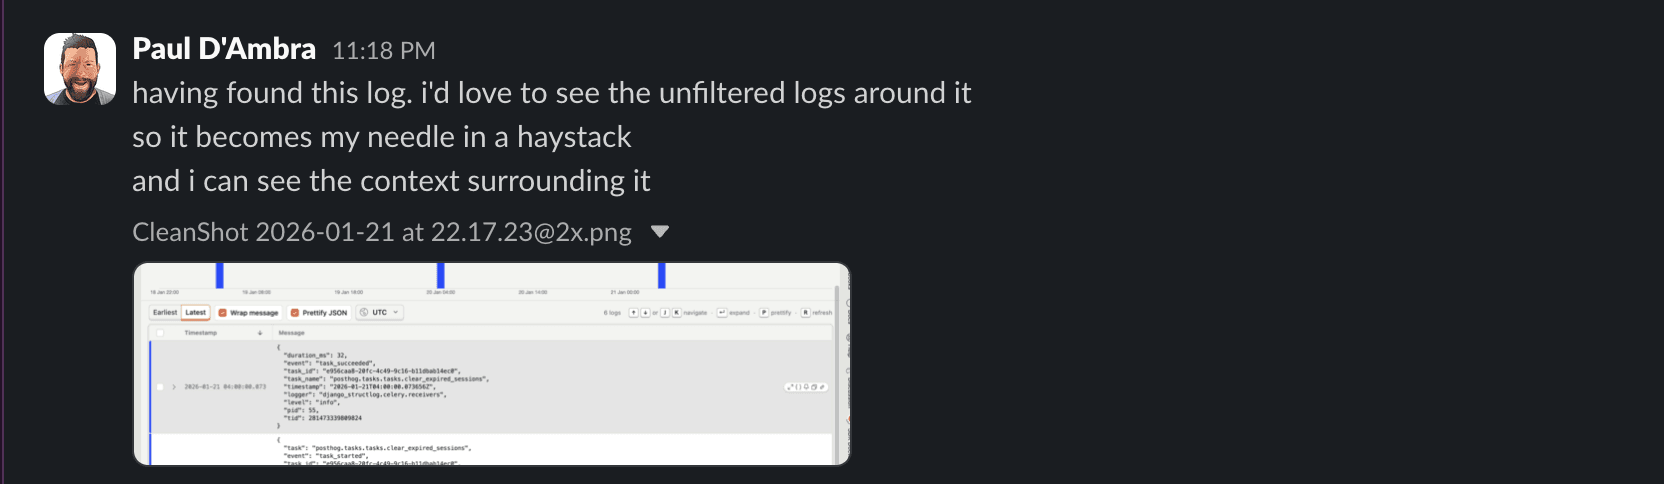
engineer giving logs feedback

Our team loves using Logs to debug PostHog. Here's the most important things they've learned about doing this effectively so far.

For Sven LangeSven Lange, Platform Engineer in the Infrastructure Team, opening Logs usually means something already feels off. It might start with an alert, a bug report, or a suspicious anomaly. Sometimes, that means sanity-checking reports of things like SQL injection attempts and confirming there was no real impact.

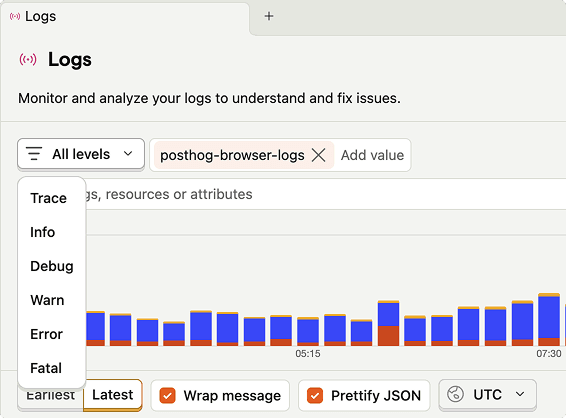
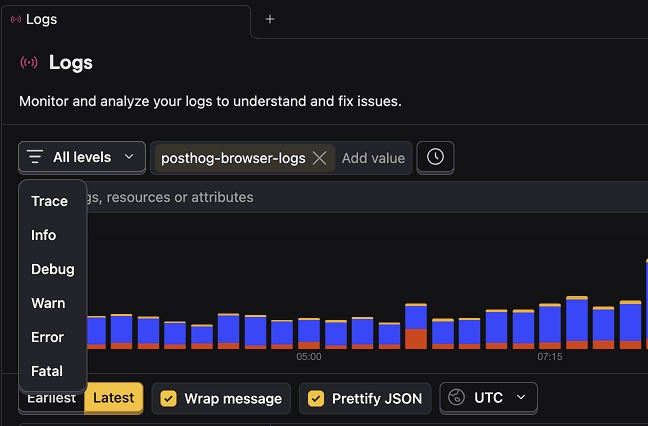
Logs user detailsLogs user details

One case stood out: repeated out-of-memory crashes on a node, with no obvious explanation. Sven opened Logs, filtered down to everything running on that node, and then started ruling things out. Normal-looking logs went first, then more normal-looking logs, until only something odd remained - gzipped noise showing up where it really shouldn’t.

That “noise” turned out to be an application logging huge compressed payloads. Our previous internal log pipeline dutifully tried to read all of it, but the logs were far too large and it kept crashing, sometimes taking other applications with it.

This was exactly the kind of problem the previous logging setup was good at hiding. That system discarded the problematic data, so everything looked mostly fine… apart for the unexplained crashes.

This wasn’t just a one-off investigation. Sven flagged this pattern to the team as a logging failure, not an infrastructure one – the system was hiding exactly the data you’d want when something goes wrong. That kic ked off a round of changes around how large payloads are handled, surfaced, and filtered in Logs.

Today, that same investigation usually starts by carving things down instead of staring at a wall of output. Include and exclude filters came directly out of these cases – the need to rule things out quickly without guessing. Tracking slow HTTP requests, for example, is as simple as filtering for requests over 600 ms and seeing the results update immediately.

Sven still checks Grafana/Loki when he needs older history, but for day-to-day investigations PostHog Logs has become the default. It’s become the default for day-to-day investigations, especially when the problem isn’t obvious yet.

Rory ShanksRory Shanks and his team used to query built-in ClickHouse tables directly to inspect logs. It worked, but it wasn’t something you’d reach for when an issue was unfolding and you needed answers quickly. Until we built PostHog Logs.

Their setup now is intentionally simple. ClickHouse runs on EC2 as a systemd service. systemd writes logs to journald, Vector reads from journald, and sends everything to PostHog via OpenTelemetry. As a bonus, this doesn’t just include ClickHouse logs; it brings in system logs too.
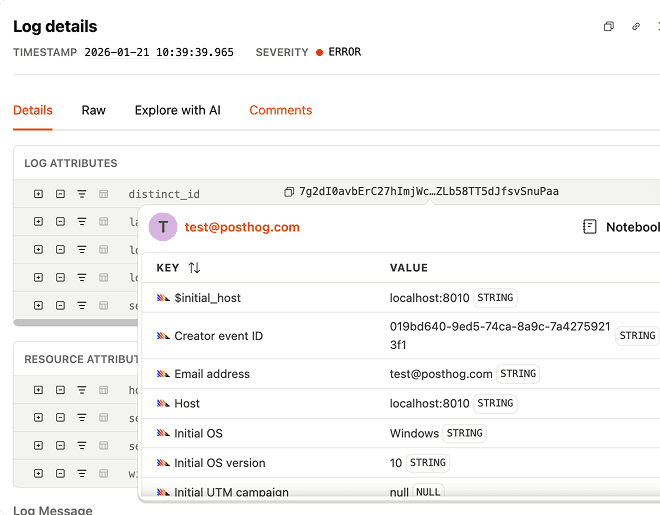
Logs screenLogs screen

Configuration is minimal, maintenance is basically zero, and anything that supports OTel “just works.”

Most of Rory’s questions are straightforward but time-sensitive:

  • When did this error start?
  • How widespread is it?
  • Can I quickly share this log with someone else?

The signals were technically available before, but Logs makes it much faster to see patterns, understand impact, and collaborate. Errors are easier to scope, links are easy to share, and everything loads fast, noticeably lighter than setups they’d used before, especially when all they needed was to understand scope and timing.

Jon McCallumJon McCallum, Product Engineer in the Logs team, spends a lot of time inside Logs. Which actually makes total sense, because he’s one of the people working on it.

Jon rarely starts by staring at log lines and hoping for enlightenment (at least he says so). Instead, he narrows the blast radius first, a specific surface, service, or severity, until the noise drops enough for a pattern to show itself. As he tweaks the filters, the sparkline responds instantly, which is usually faster than his own intuition and much more honest.
Logs detailsLogs details

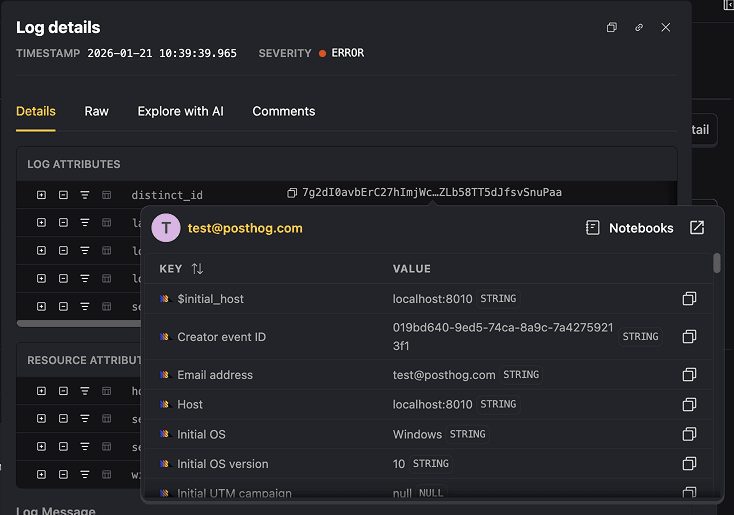
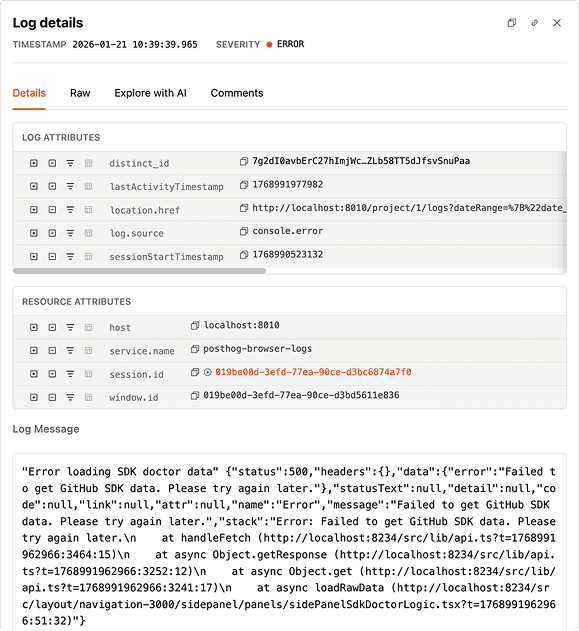
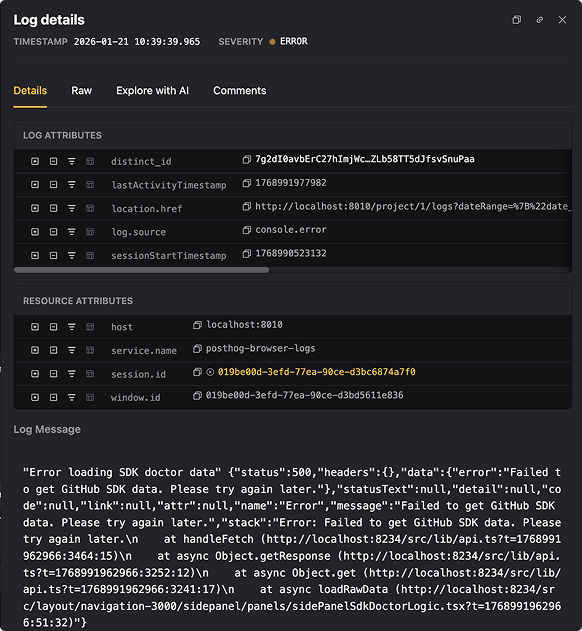
Once something stands out, he digs into the details. Because logs are ingested as structured data, whether they come from OpenTelemetry or PostHog’s own SDKs, the metadata isn’t just there for reference. A trace ID or request ID becomes the fastest way to reframe the investigation.

If he needs a quick reality check, Jon lets PostHog explain what the error is trying (and failing) to do, in human language. And when things are actively on fire, Live Tail is there to stream logs in real time. He says:

The real superpower is how this connects to the front end, because we capture browser logs via PostHog JS. They’re automatically linked to the session and the user IDs. I can search for a front-end exception and jump directly into the session replay to watch the exact moment the bug happened.

This means that logs are now part of the same space as replays, errors, and analytics, which removes a lot of back-and-forth and makes debugging feel noticeably quicker.

Why you should try PostHog Logs too

Across teams, Logs tends to show up at the same moment, when something feels off and you want to confirm or rule it out quickly.

We keep using Logs because it’s shaped by the same problems we run into while building PostHog. When it gets in the way, it gets changed. When it works, it becomes part of the routine.

Try it out and start debugging where your data already is.