惯性聚合 高效追踪和阅读你感兴趣的博客、新闻、科技资讯
阅读原文 在惯性聚合中打开

推荐订阅源

F
Full Disclosure
月光博客
月光博客
D
Darknet – Hacking Tools, Hacker News & Cyber Security
Y
Y Combinator Blog
有赞技术团队
有赞技术团队
PCI Perspectives
PCI Perspectives
云风的 BLOG
云风的 BLOG
MyScale Blog
MyScale Blog
Latest news
Latest news
P
Palo Alto Networks Blog
Blog — PlanetScale
Blog — PlanetScale
Cyberwarzone
Cyberwarzone
P
Privacy International News Feed
Scott Helme
Scott Helme
CTFtime.org: upcoming CTF events
F
Fortinet All Blogs
Engineering at Meta
Engineering at Meta
V
Vulnerabilities – Threatpost
C
CXSECURITY Database RSS Feed - CXSecurity.com
cs.CL updates on arXiv.org
T
Tor Project blog
S
Securelist
H
Hackread – Cybersecurity News, Data Breaches, AI and More
NISL@THU
NISL@THU
GbyAI
GbyAI
H
Hacker News: Front Page
博客园 - 三生石上(FineUI控件)
S
Secure Thoughts
U
Unit 42
T
The Blog of Author Tim Ferriss
Exploit-DB.com RSS Feed
Cloudbric
Cloudbric
Microsoft Security Blog
博客园 - Franky
L
LINUX DO - 最新话题
The Hacker News
The Hacker News
WordPress大学
WordPress大学
博客园 - 叶小钗
阮一峰的网络日志
阮一峰的网络日志
小众软件
小众软件
T
Threatpost
Cisco Talos Blog
Cisco Talos Blog
V
V2EX
L
LINUX DO - 热门话题
cs.AI updates on arXiv.org
Recorded Future
Recorded Future
K
Kaspersky official blog
S
Schneier on Security
T
The Exploit Database - CXSecurity.com
钛媒体:引领未来商业与生活新知
钛媒体:引领未来商业与生活新知

PostHog's RSS Feed

Training our own AI models - PostHog From 270GB RAM to 5GB: Moving local flag evaluation from Django to Rust The best analytics stack for vibe-coded apps The do's and don'ts of minimum viable product marketing - PostHog The best MCP servers for startups, by workflow 4,063 errors closed without a human opening PostHog – here's what we learned - PostHog PostHog Code and the self-driving product - PostHog Why attacking your competitors online is dumb - PostHog The best real-time analytics platforms for developers, compared DuckDB vs ClickHouse: Why we use both at PostHog - PostHog PostHog's next chapter - PostHog Making Claude Cowork actually useful - PostHog PostHog vs Matomo in-depth tool comparison You're doing lifecycle emails wrong Untangling Tokio and Rayon in production: From 2s latency spikes to 94ms flat The best HIPAA-compliant A/B testing tools - PostHog A beginner's guide to testing AI agents - PostHog I hate the standup bot (so I built an agent to do it for me) - PostHog The best CDPs for developers, compared The best error tracking tools for developers, compared The best feature flag software for developers, compared 7 best session replay tools for mobile apps 7 best free open source business intelligence tools right now 7 best free and open source LLM observability tools PostHog vs LogRocket in-depth tool comparison The most popular PostHog alternatives, compared Open source (and self-hosted) session replay tools - PostHog The 9 best GA4 alternatives for apps and websites - PostHog PostHog vs Google Analytics 4 in-depth tool comparison How we built automatic clustering for LLM traces - PostHog The 7 best HIPAA-compliant analytics tools 8 best open source analytics tools you can self-host - PostHog The best product analytics tools for startups, compared PostHog vs FullStory in-depth tool comparison The best in-app survey tools for product teams, compared The 7 best mobile app analytics tools PostHog vs Hotjar in-depth tool comparison The 8 best free and open-source feature flag services - PostHog The 5 best free and open-source A/B testing tools - PostHog The best mobile app A/B testing tools, compared What is a feature flag? Feature Flags vs Remote Config vs A/B Testing PostHog is now available in Vercel’s v0 The best Heap alternatives & competitors, compared PostHog vs Heap in-depth tool comparison PostHog vs Pendo in-depth tool comparison PostHog × Vercel: feature flags, minus the plumbing Your logs' final destination is in GA. You always end up here anyway Behind the scenes of a PostHog hackathon - PostHog The most popular Mixpanel alternatives & competitors, compared PostHog vs Mixpanel in-depth tool comparison The 9 best GDPR-compliant analytics tools How we use Logs at PostHog The best web analytics tools for developers, compared Stop AI slop: Run evals with LLM-as-a-Judge - PostHog You product data just got a job: Workflows is now out App onboarding: How to fix drop-off points Meet Logs (beta) – logs with all the tools you’re already using Why small teams crush tiger teams How we built user behavior analysis with multi-modal LLMs (in 5 not-so-easy steps) - PostHog The best Contentsquare alternatives & competitors, compared 8 learnings from 1 year of agents – PostHog AI - PostHog Why we killed our AI product assistant Workflows graduate to beta! Product data, meet automation The best Rollbar alternatives & competitors, compared Workflows are now in Alpha and I already broke mine - PostHog I've consistently underestimated how important communication is as a CEO - PostHog How we made feature flags even faster and more reliable The best session replay tools for developers, compared What I learned attending my first ever hackathon - PostHog Did you know AI is answering our community questions? - PostHog How not to be boring - PostHog We built an internal tool to generate changelog images for social media - PostHog What we built at our windswept Mykonos hackathon - PostHog How we built our onboarding email flow (with actual performance data) - PostHog We're building a better PostHog community by closing our public Slack - PostHog Introducing Notebooks for PostHog - PostHog Why we've launched PostHog user surveys - PostHog How we made feature flags faster and more reliable - PostHog In-depth: ClickHouse vs Redshift - PostHog Introducing HogQL: Direct SQL access for PostHog - PostHog What we built at our sun-kissed Aruba hackathon - PostHog In-depth: ClickHouse vs BigQuery - PostHog In-depth: ClickHouse vs Elasticsearch - PostHog HogMail #22: Why do companies over-hire?" - PostHog Our simpler goal: Help engineers to be better at product - PostHog In-depth: ClickHouse vs Snowflake - PostHog HogMail #21: Avoiding the "Product Death Cycle" - PostHog Sunsetting Kubernetes support for PostHog - PostHog Why 'Product Engineer' is the most fun role I've had in tech - PostHog HogMail #20: Why do startups fail? - PostHog The best Google Optimize alternatives for apps and websites - PostHog Array 1.43.0: Massive performance improvements! - PostHog In-depth: ClickHouse vs Druid - PostHog HogMail #19: Which meetings should you kill? - PostHog CEO diary: The things I learned in 2022 - PostHog The essential tools used by product engineers - PostHog HogMail #18: What can SaaS learn from the New York Times? - PostHog What is a product engineer? - Product Engineer Handbook - PostHog Array 1.42.0: Get beta features via our roadmap! - PostHog HogMail #17: The personal traits that can't be taught - PostHog
Introducing HouseWatch: An open-source toolkit for ClickHouse - PostHog
Ian Vanagas · 2023-06-12 · via PostHog's RSS Feed

We are big fans of ClickHouse. We rely on it heavily to store and retrieve the massive amount of data we process every day. In doing this at scale for multiple years now, we’ve built a lot of expertise and systems related to ClickHouse.

To formalize and share these, we’ve recently built and launched HouseWatch, an open-source suite of tools for monitoring and managing ClickHouse. HouseWatch is free and works with your existing ClickHouse instance. You can clone it from GitHub and deploy it via Docker Compose.

We started using ClickHouse in August 2021 when we moved away from Postgres.

ClickHouse provides tons of easily queryable metadata about your system, but knowing how and what to query is difficult. From our usage of ClickHouse, we’ve built an intuition for this – some of which we’ve documented in our ClickHouse manual.

We’ve also built many systems and processes for managing clusters. These include:

  • Tracking metrics via Grafana
  • Querying via Metabase
  • Running operations on nodes through ssh
  • Managing async migrations with custom-built tools

To share our expertise, formalize these tools, and centralize them in one place, our engineers Li, Yakko, and CTO Tim built the first version of HouseWatch at our Aruba offsite. We felt it would be useful to us, and support other ClickHouse users as well.

HouseWatch provides a central location for the tools we use to monitor and manage ClickHouse.

Query performance and analysis

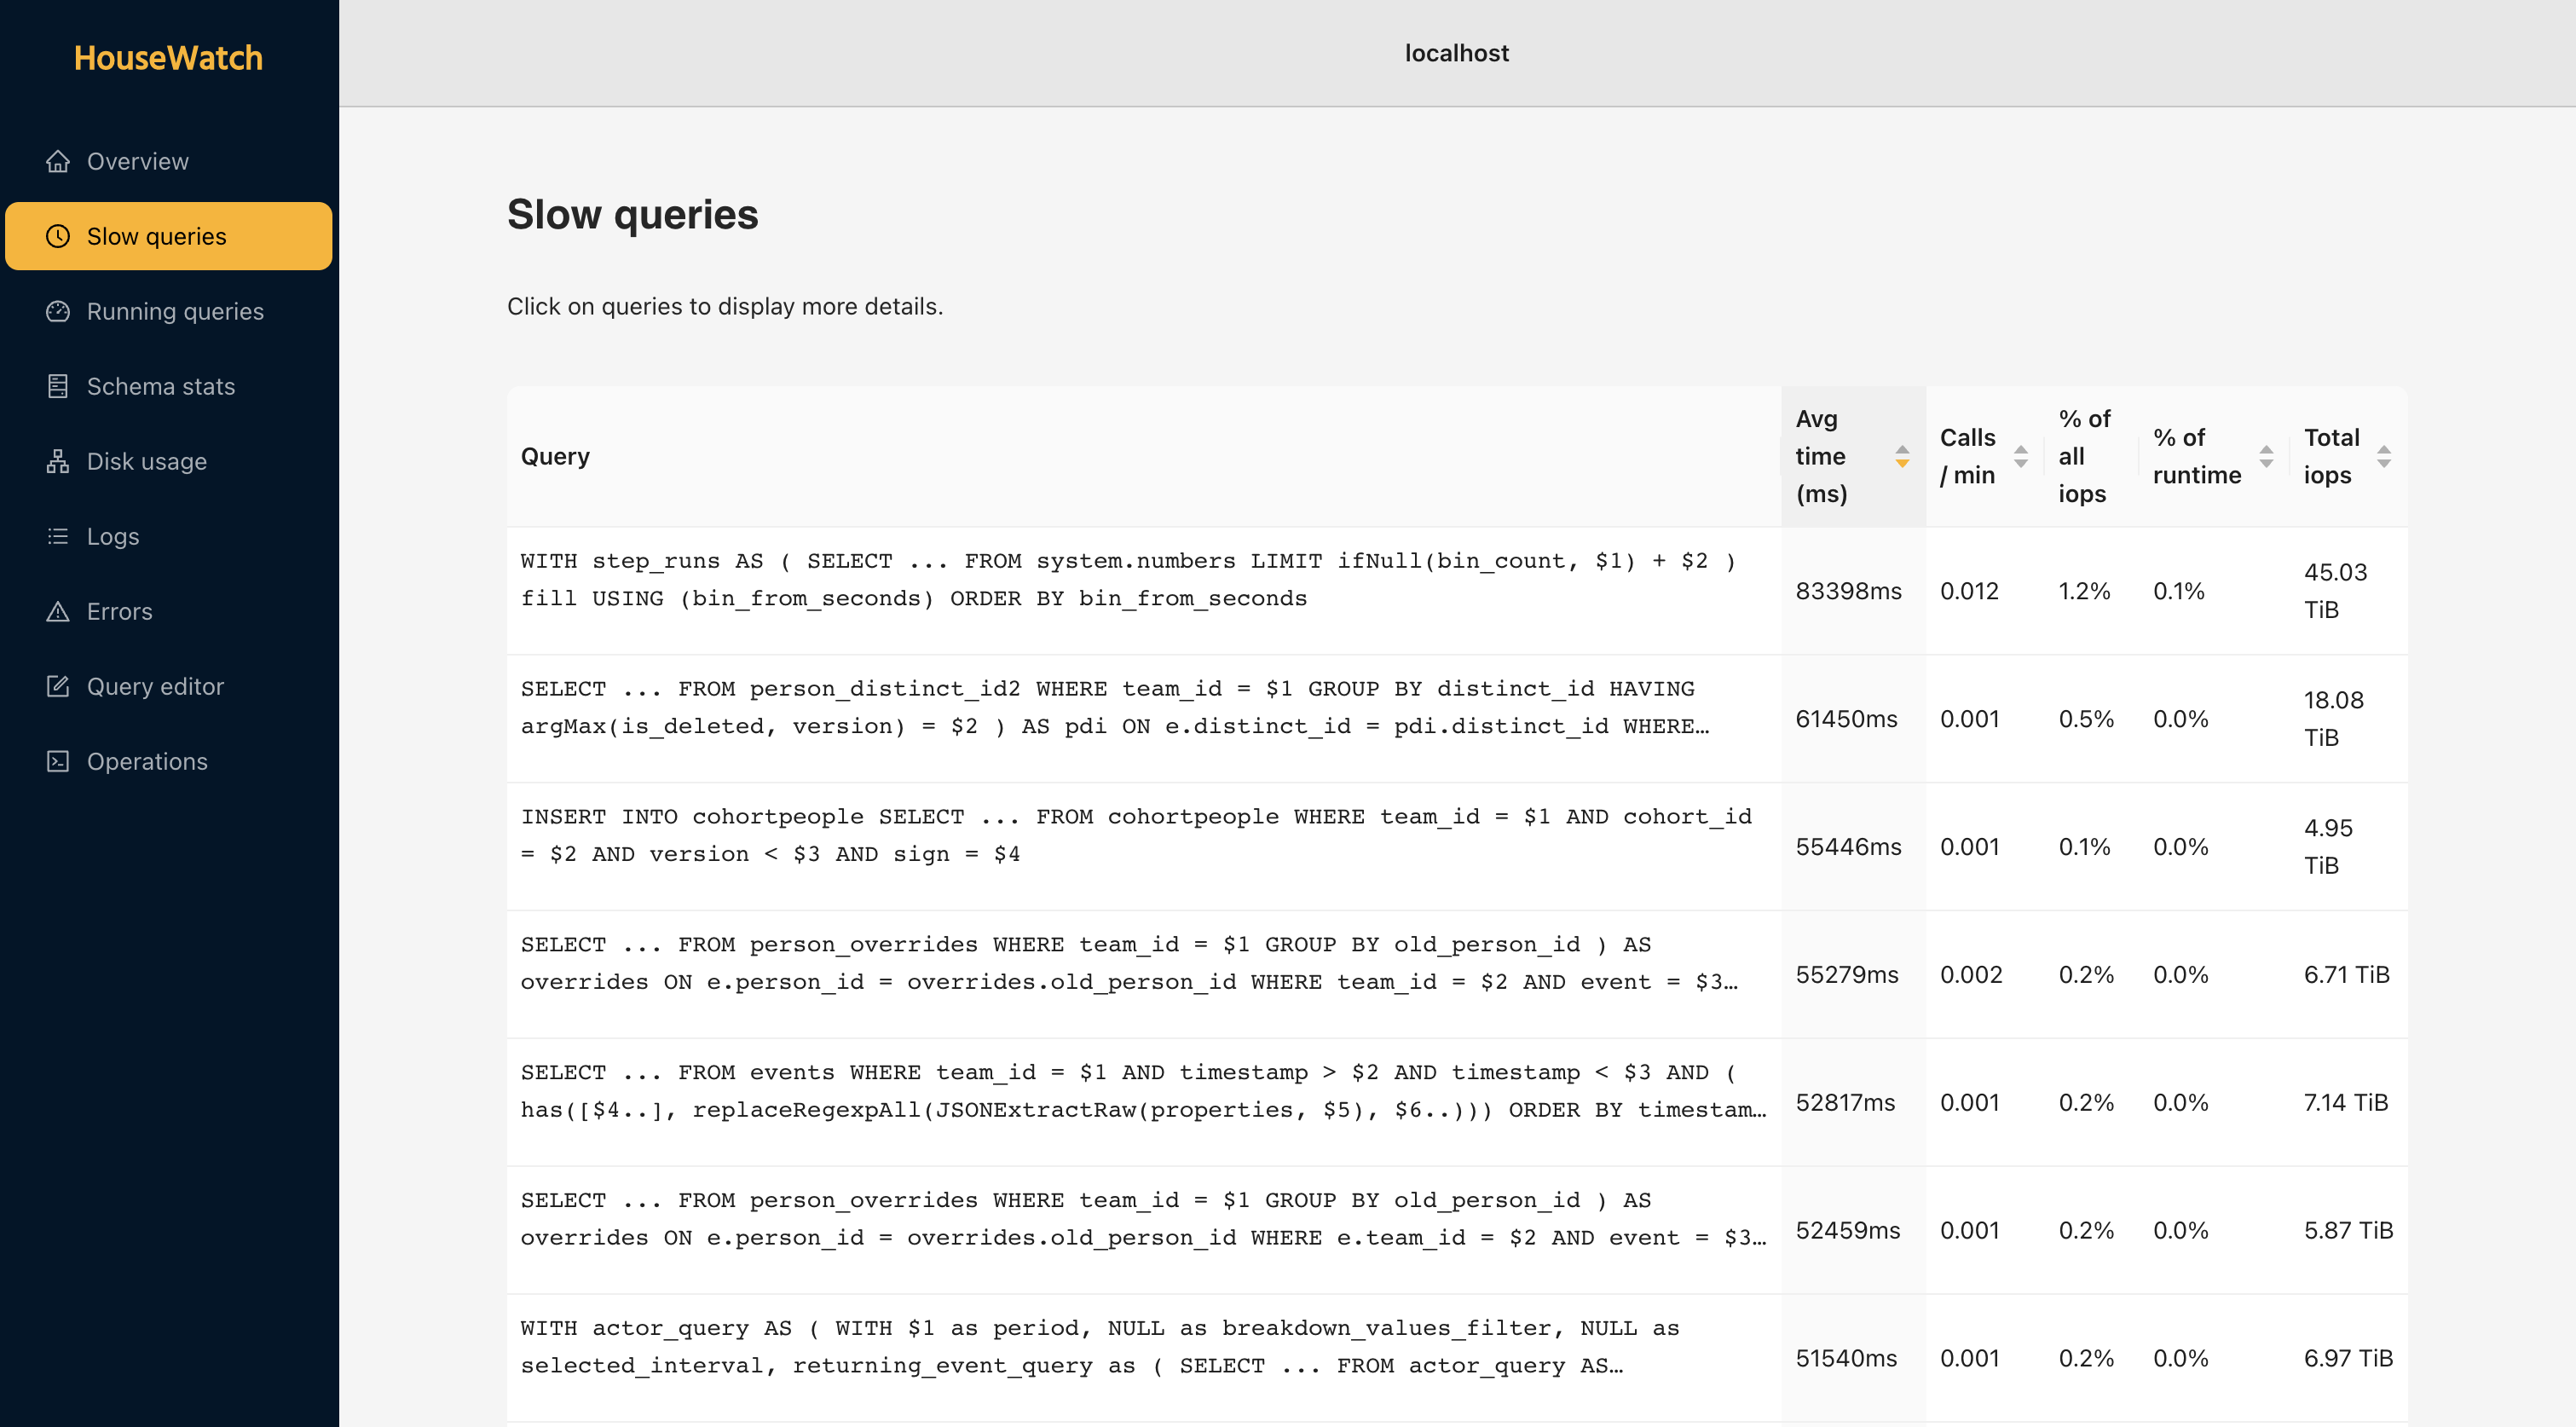
To help understand the performance of all the queries on your ClickHouse clusters, we provide a list of normalized queries and their performance metrics, with an emphasis on active and slow queries.

Each query includes metrics on average run time, calls per minute, percentage of all IOPs, total IOPs, and percentage of run time. It also includes details on the query itself and the EXPLAIN statement. From this, you can sort, monitor, and improve important, slow, or high-stress queries.
Slow

Schema stats

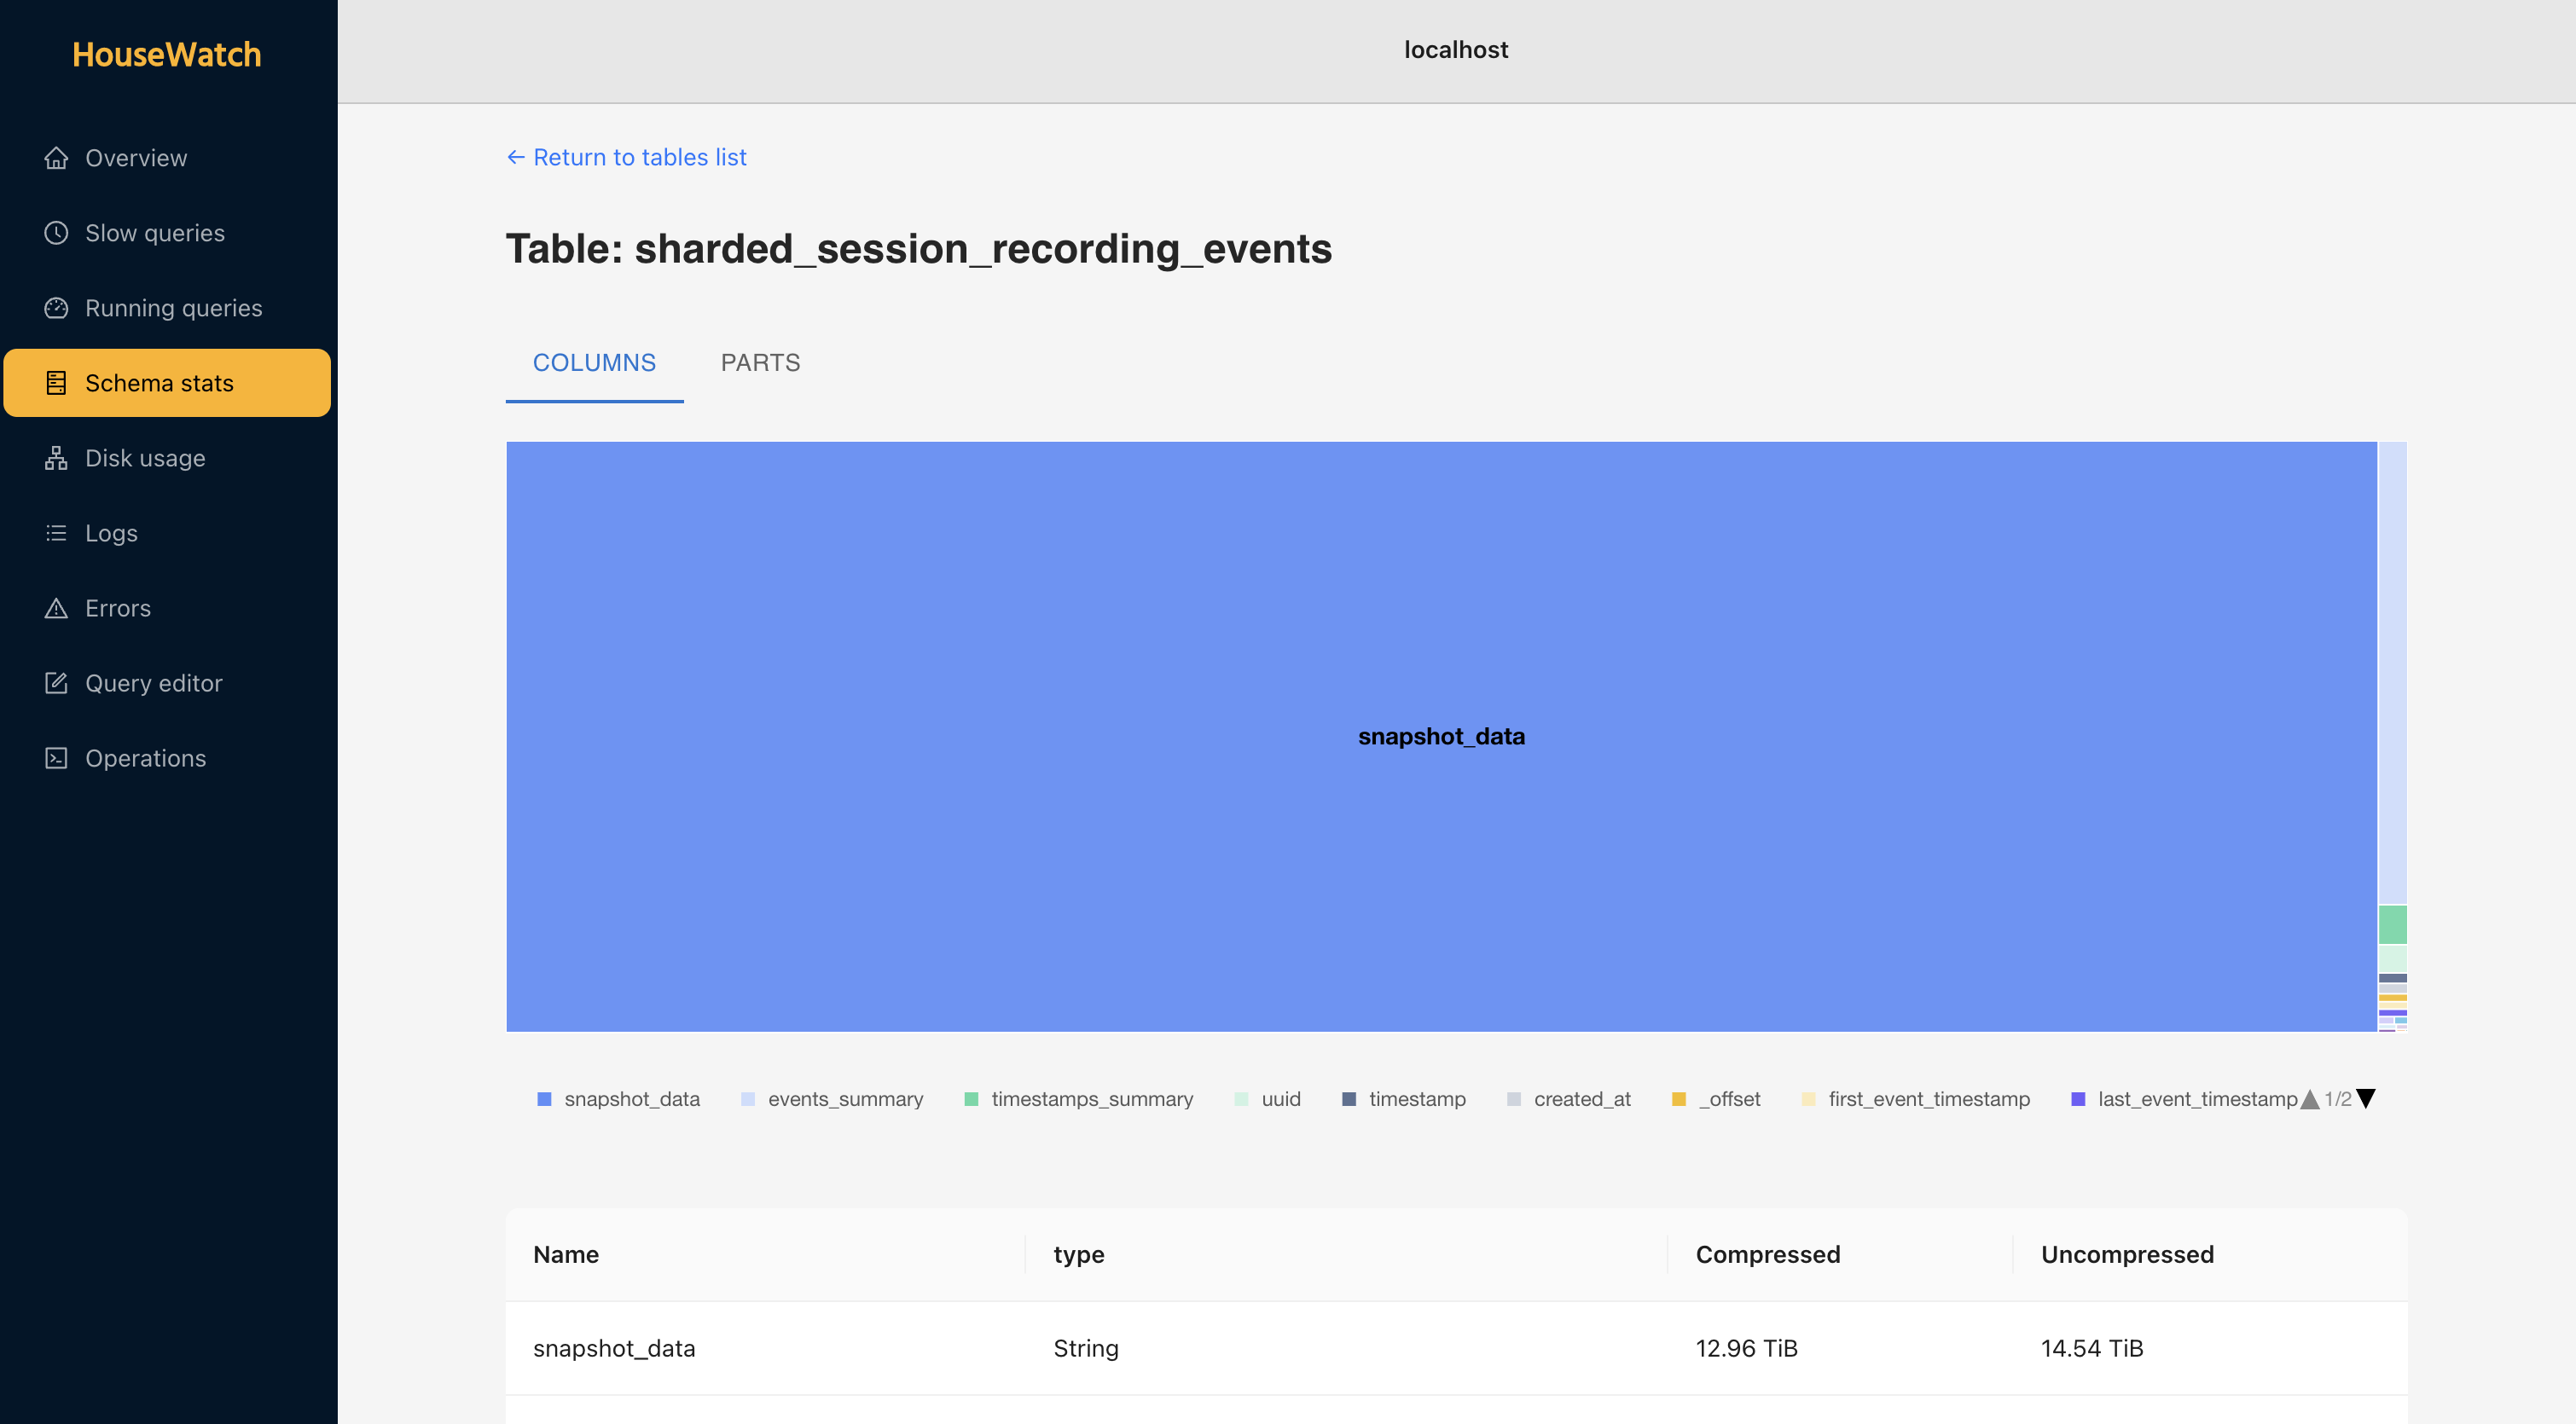
HouseWatch provides stats for all the tables for your cluster and lets you dive into the details for each of them. For each table, you can see columns, parts, compressed and uncompressed disk space sizes, disk usage, and more.
Schema

Query editing and benchmarking

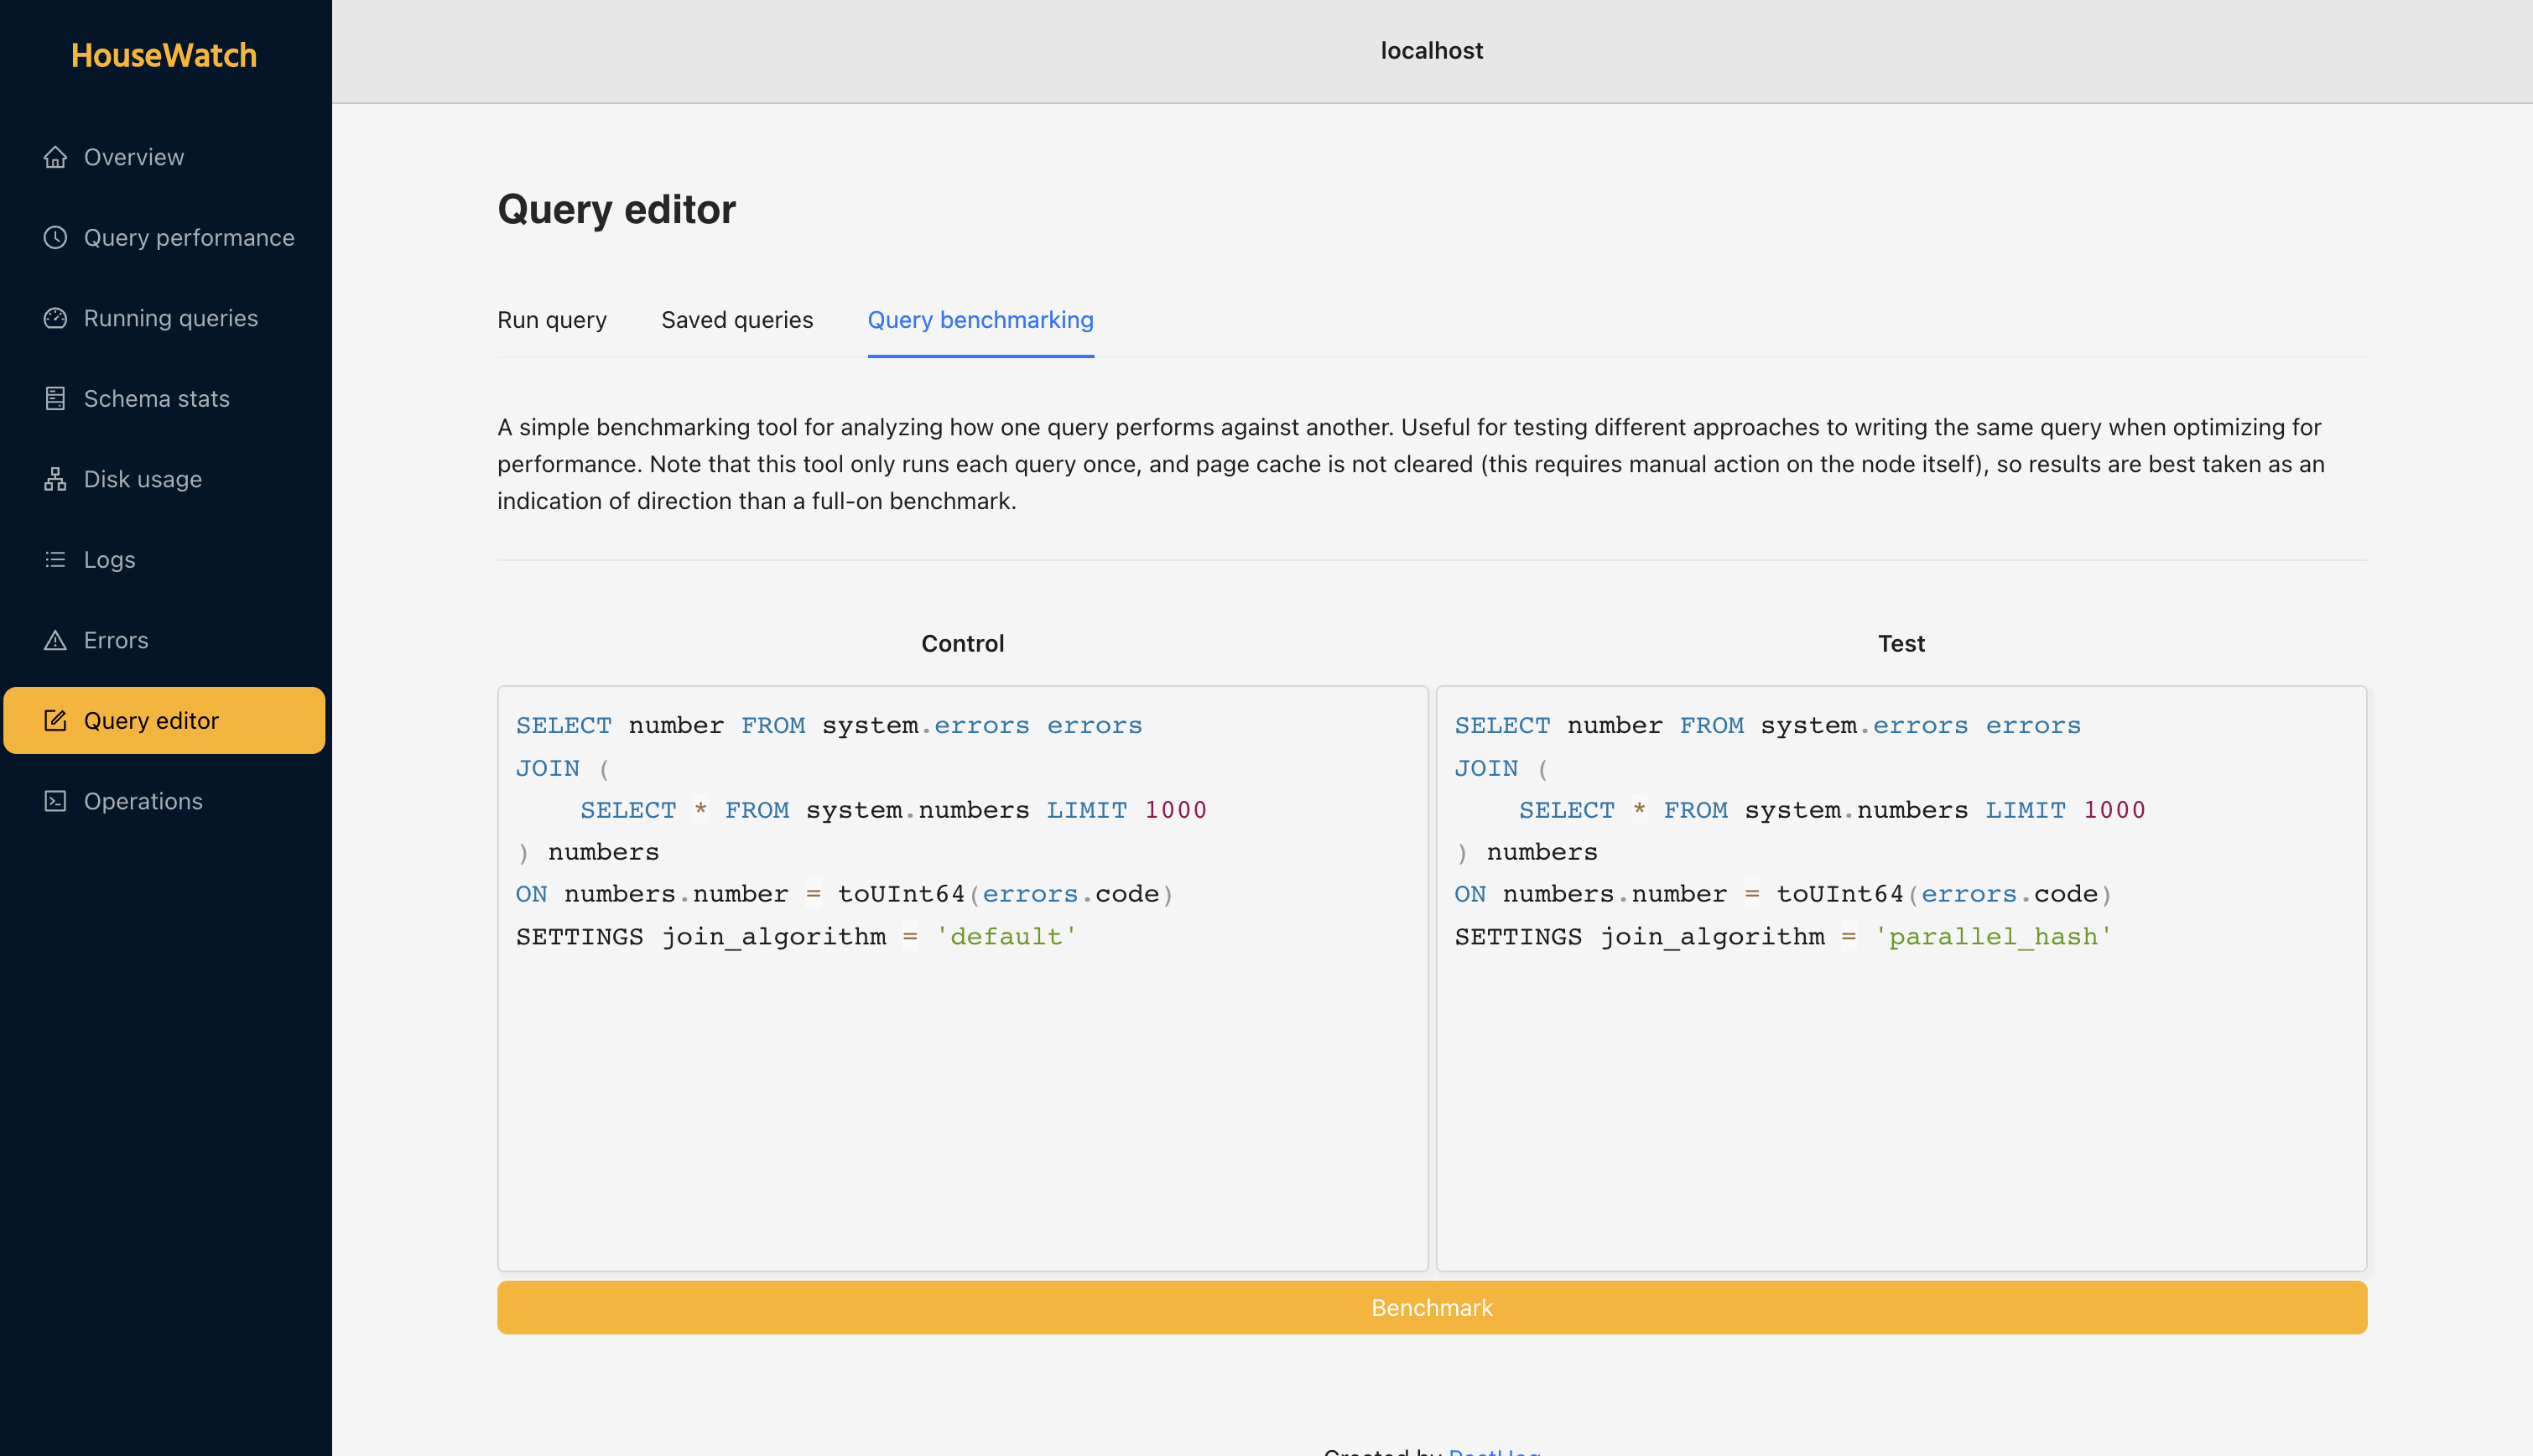
With the size of data ClickHouse stores and processes, optimizing your queries is critical. To help you do this, you can run and edit queries in HouseWatch, as well as test and compare them.

You can run queries on your ClickHouse cluster and receive results visualized in HouseWatch. For query comparisons, you can write two queries, run them, and then get metrics on performance across the duration, read bytes, CPU usage, memory usage, and more.
Compare

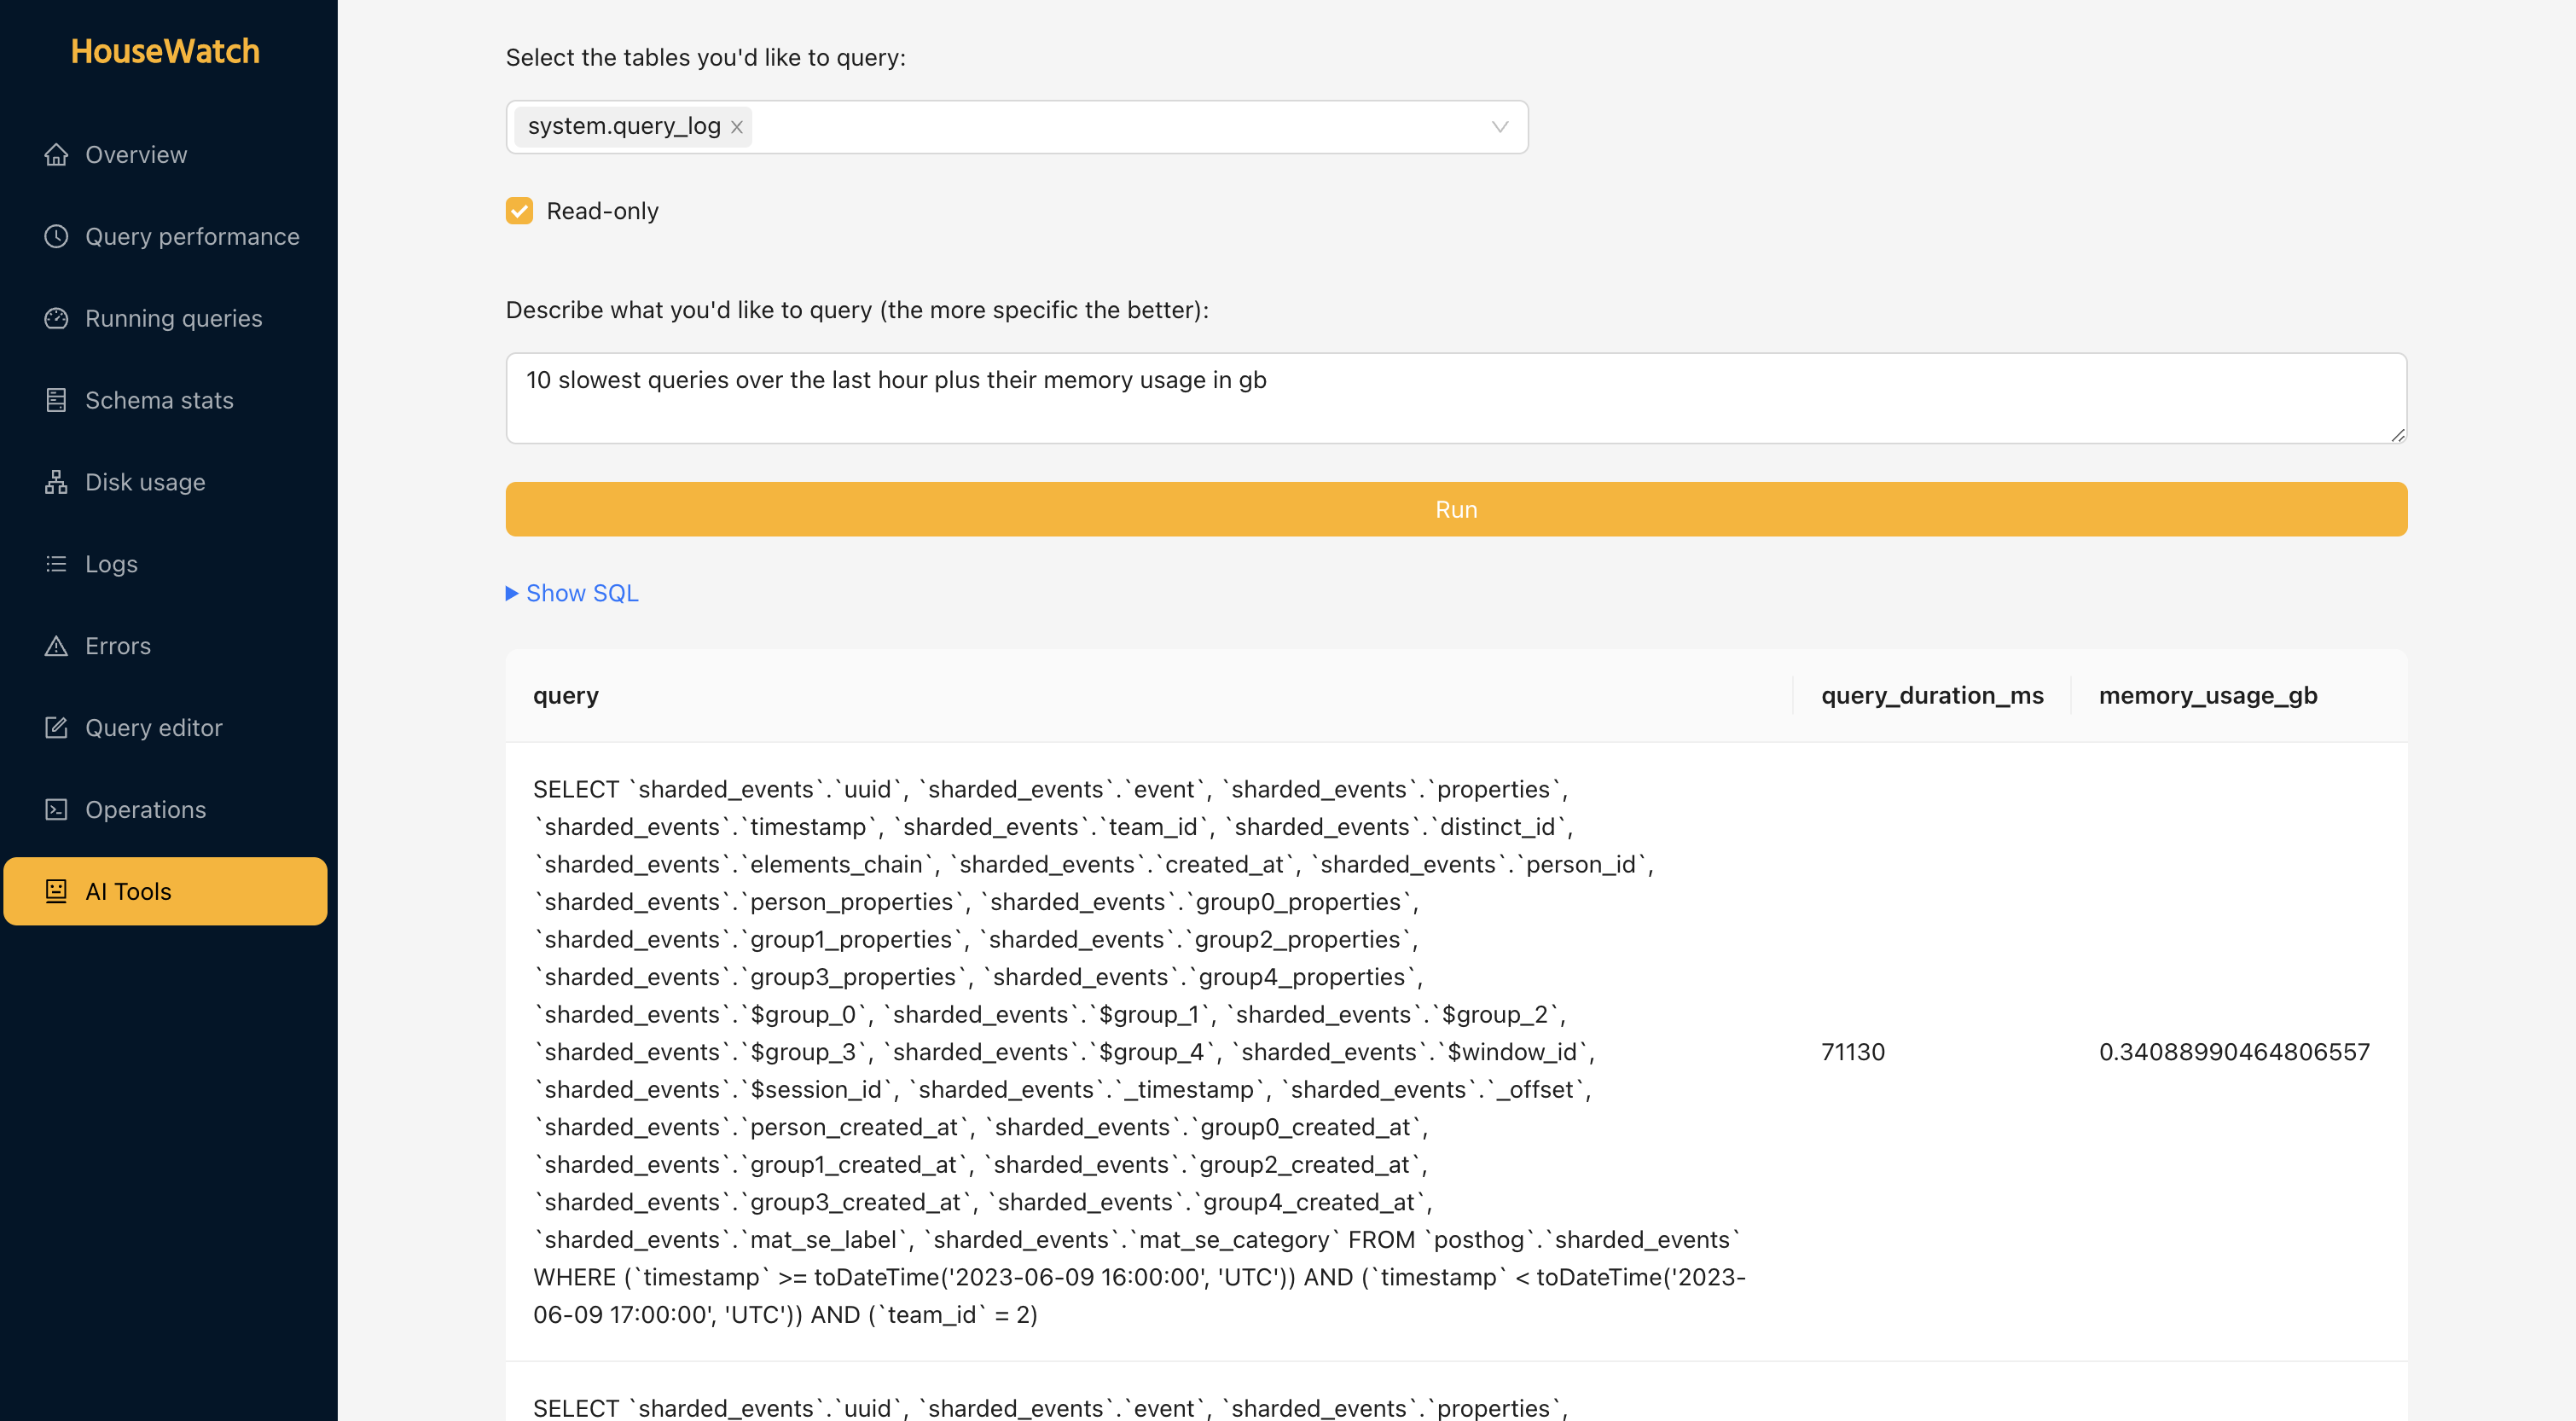
We’ve also built a natural language query editor that uses GPT to create ClickHouse queries based on the table and instructions you provide.
AI

Logs and errors

Like any good monitoring tool, HouseWatch provides access to logs and errors from ClickHouse. For both, you can search for specific ones, as well as see the number of and most recent occurrences.
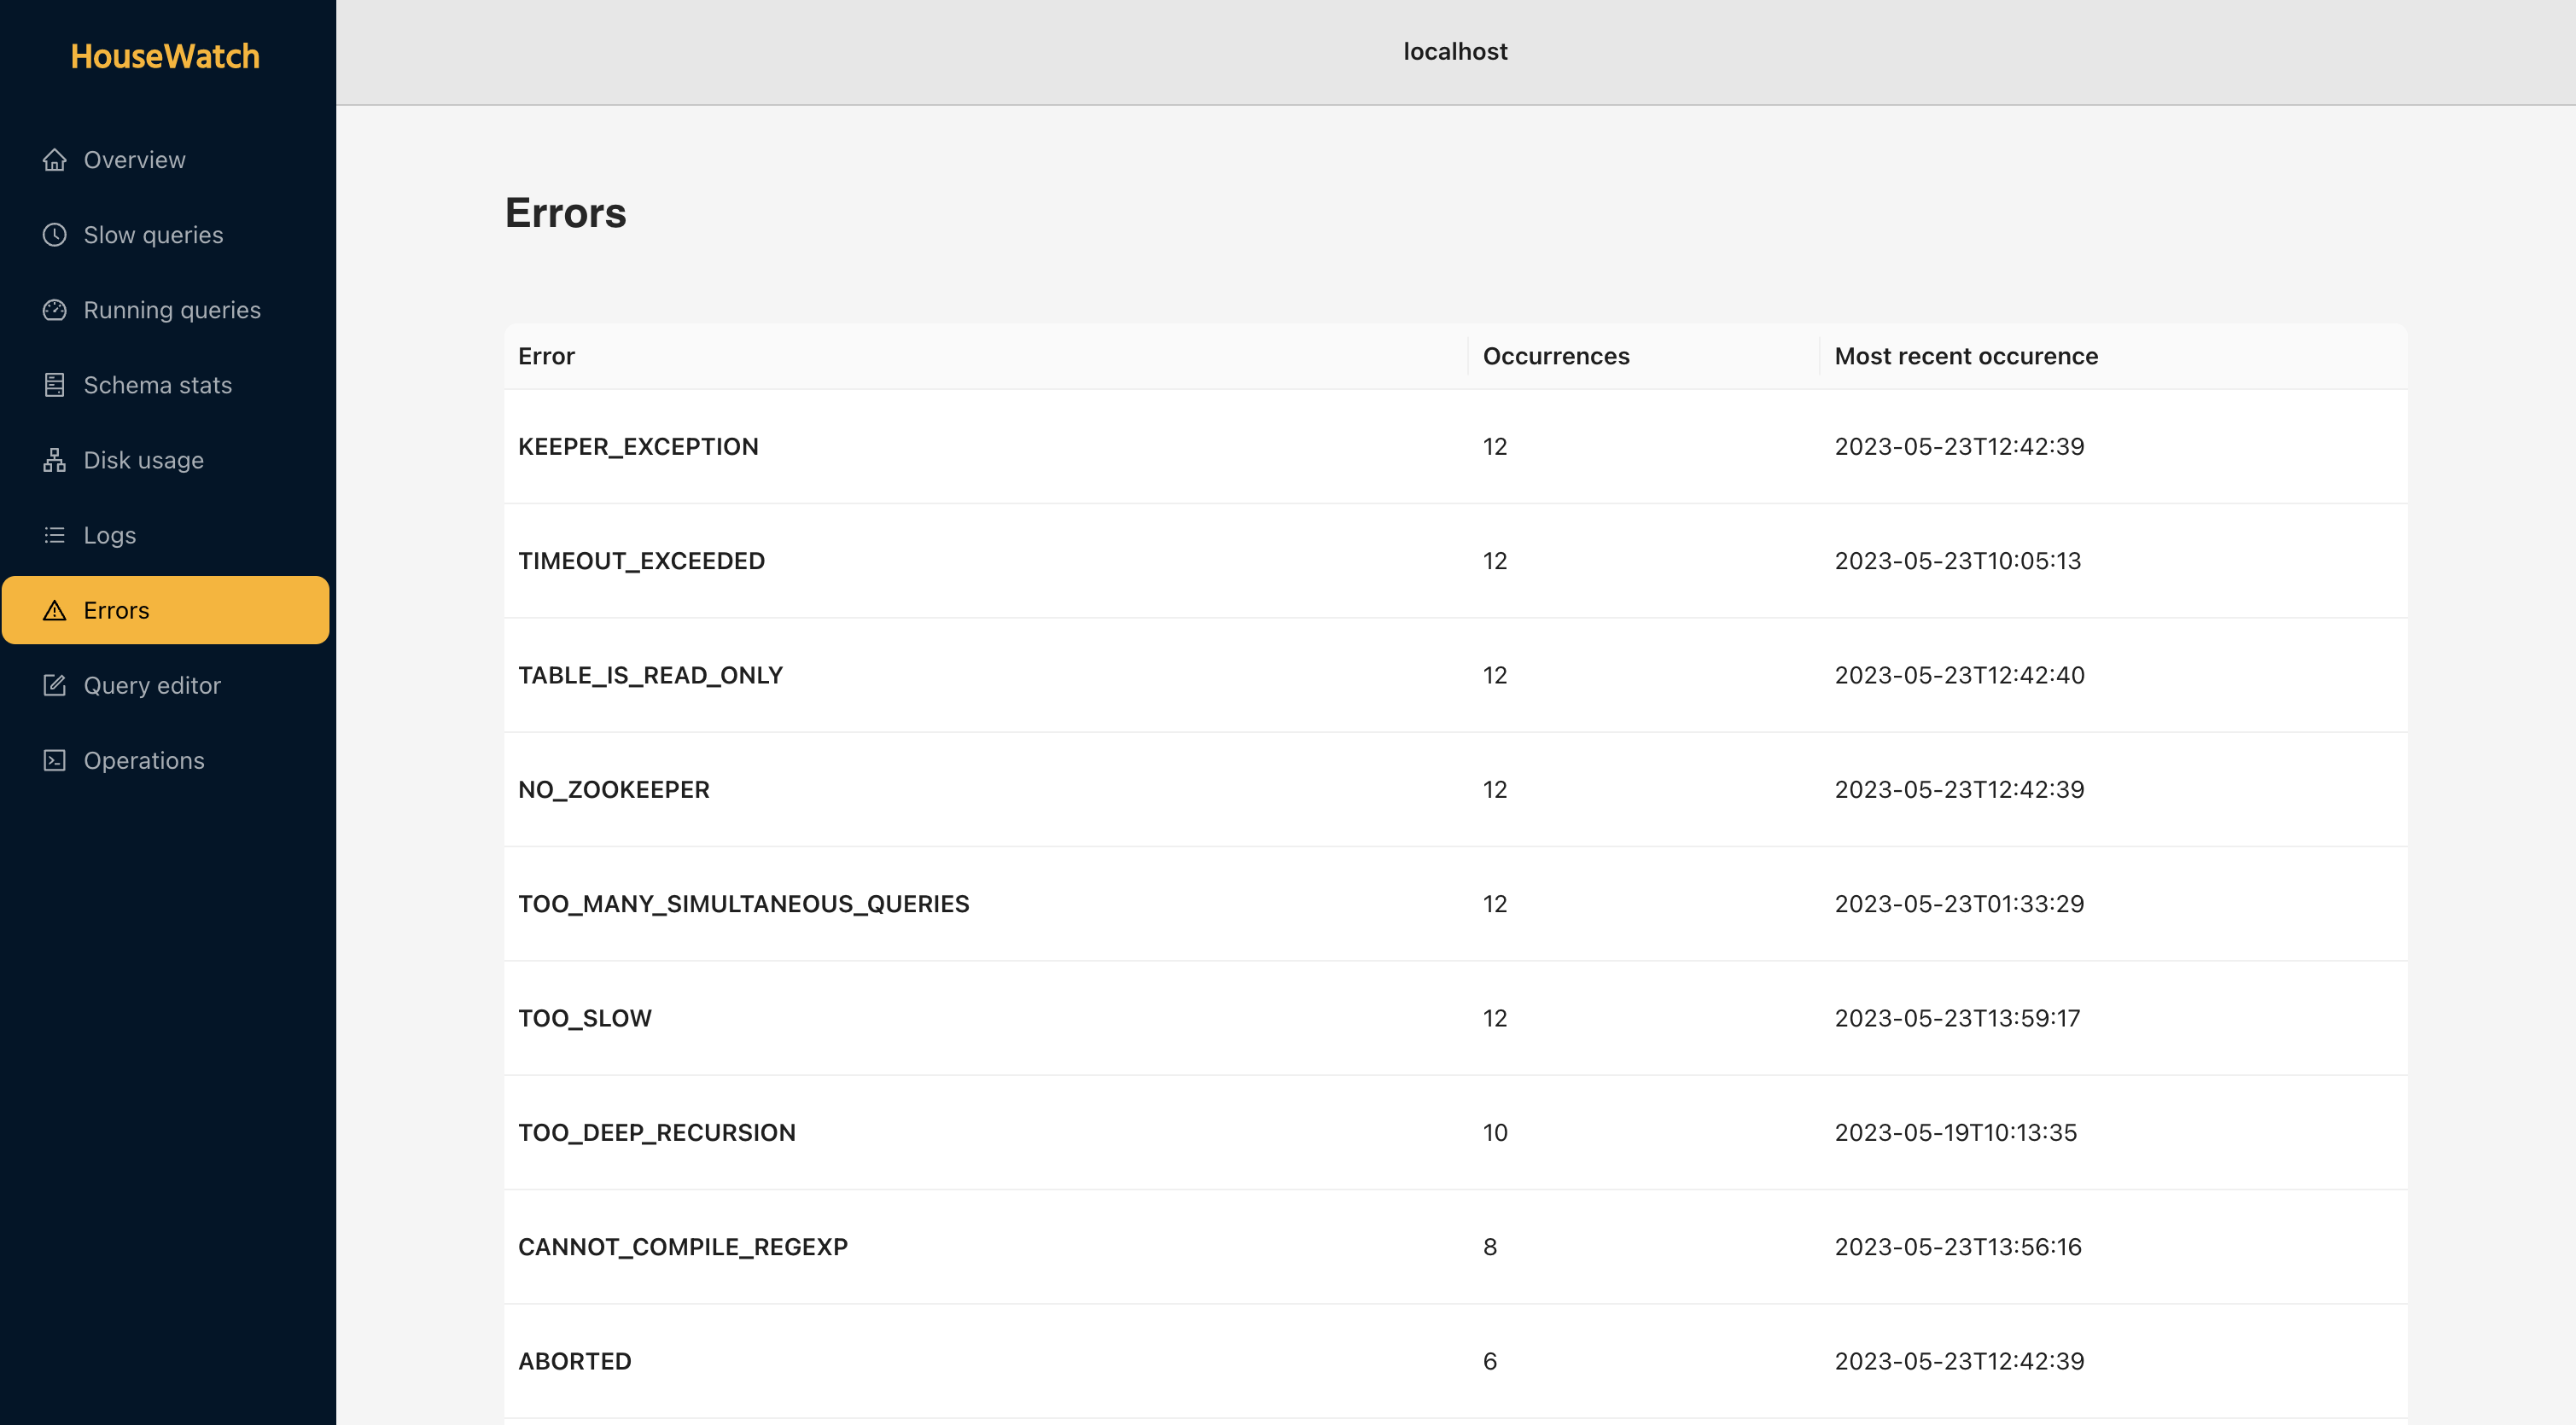
Errors

Operations

Last but not least is our operations tool. This is inspired by our async migrations tool, which we've used in production for over a year. It enables you to run and monitor long-running operations like migrations or SQL commands. You can monitor their status, pause or stop them, and retry them if they fail. Failures come with automatic rollbacks as well.
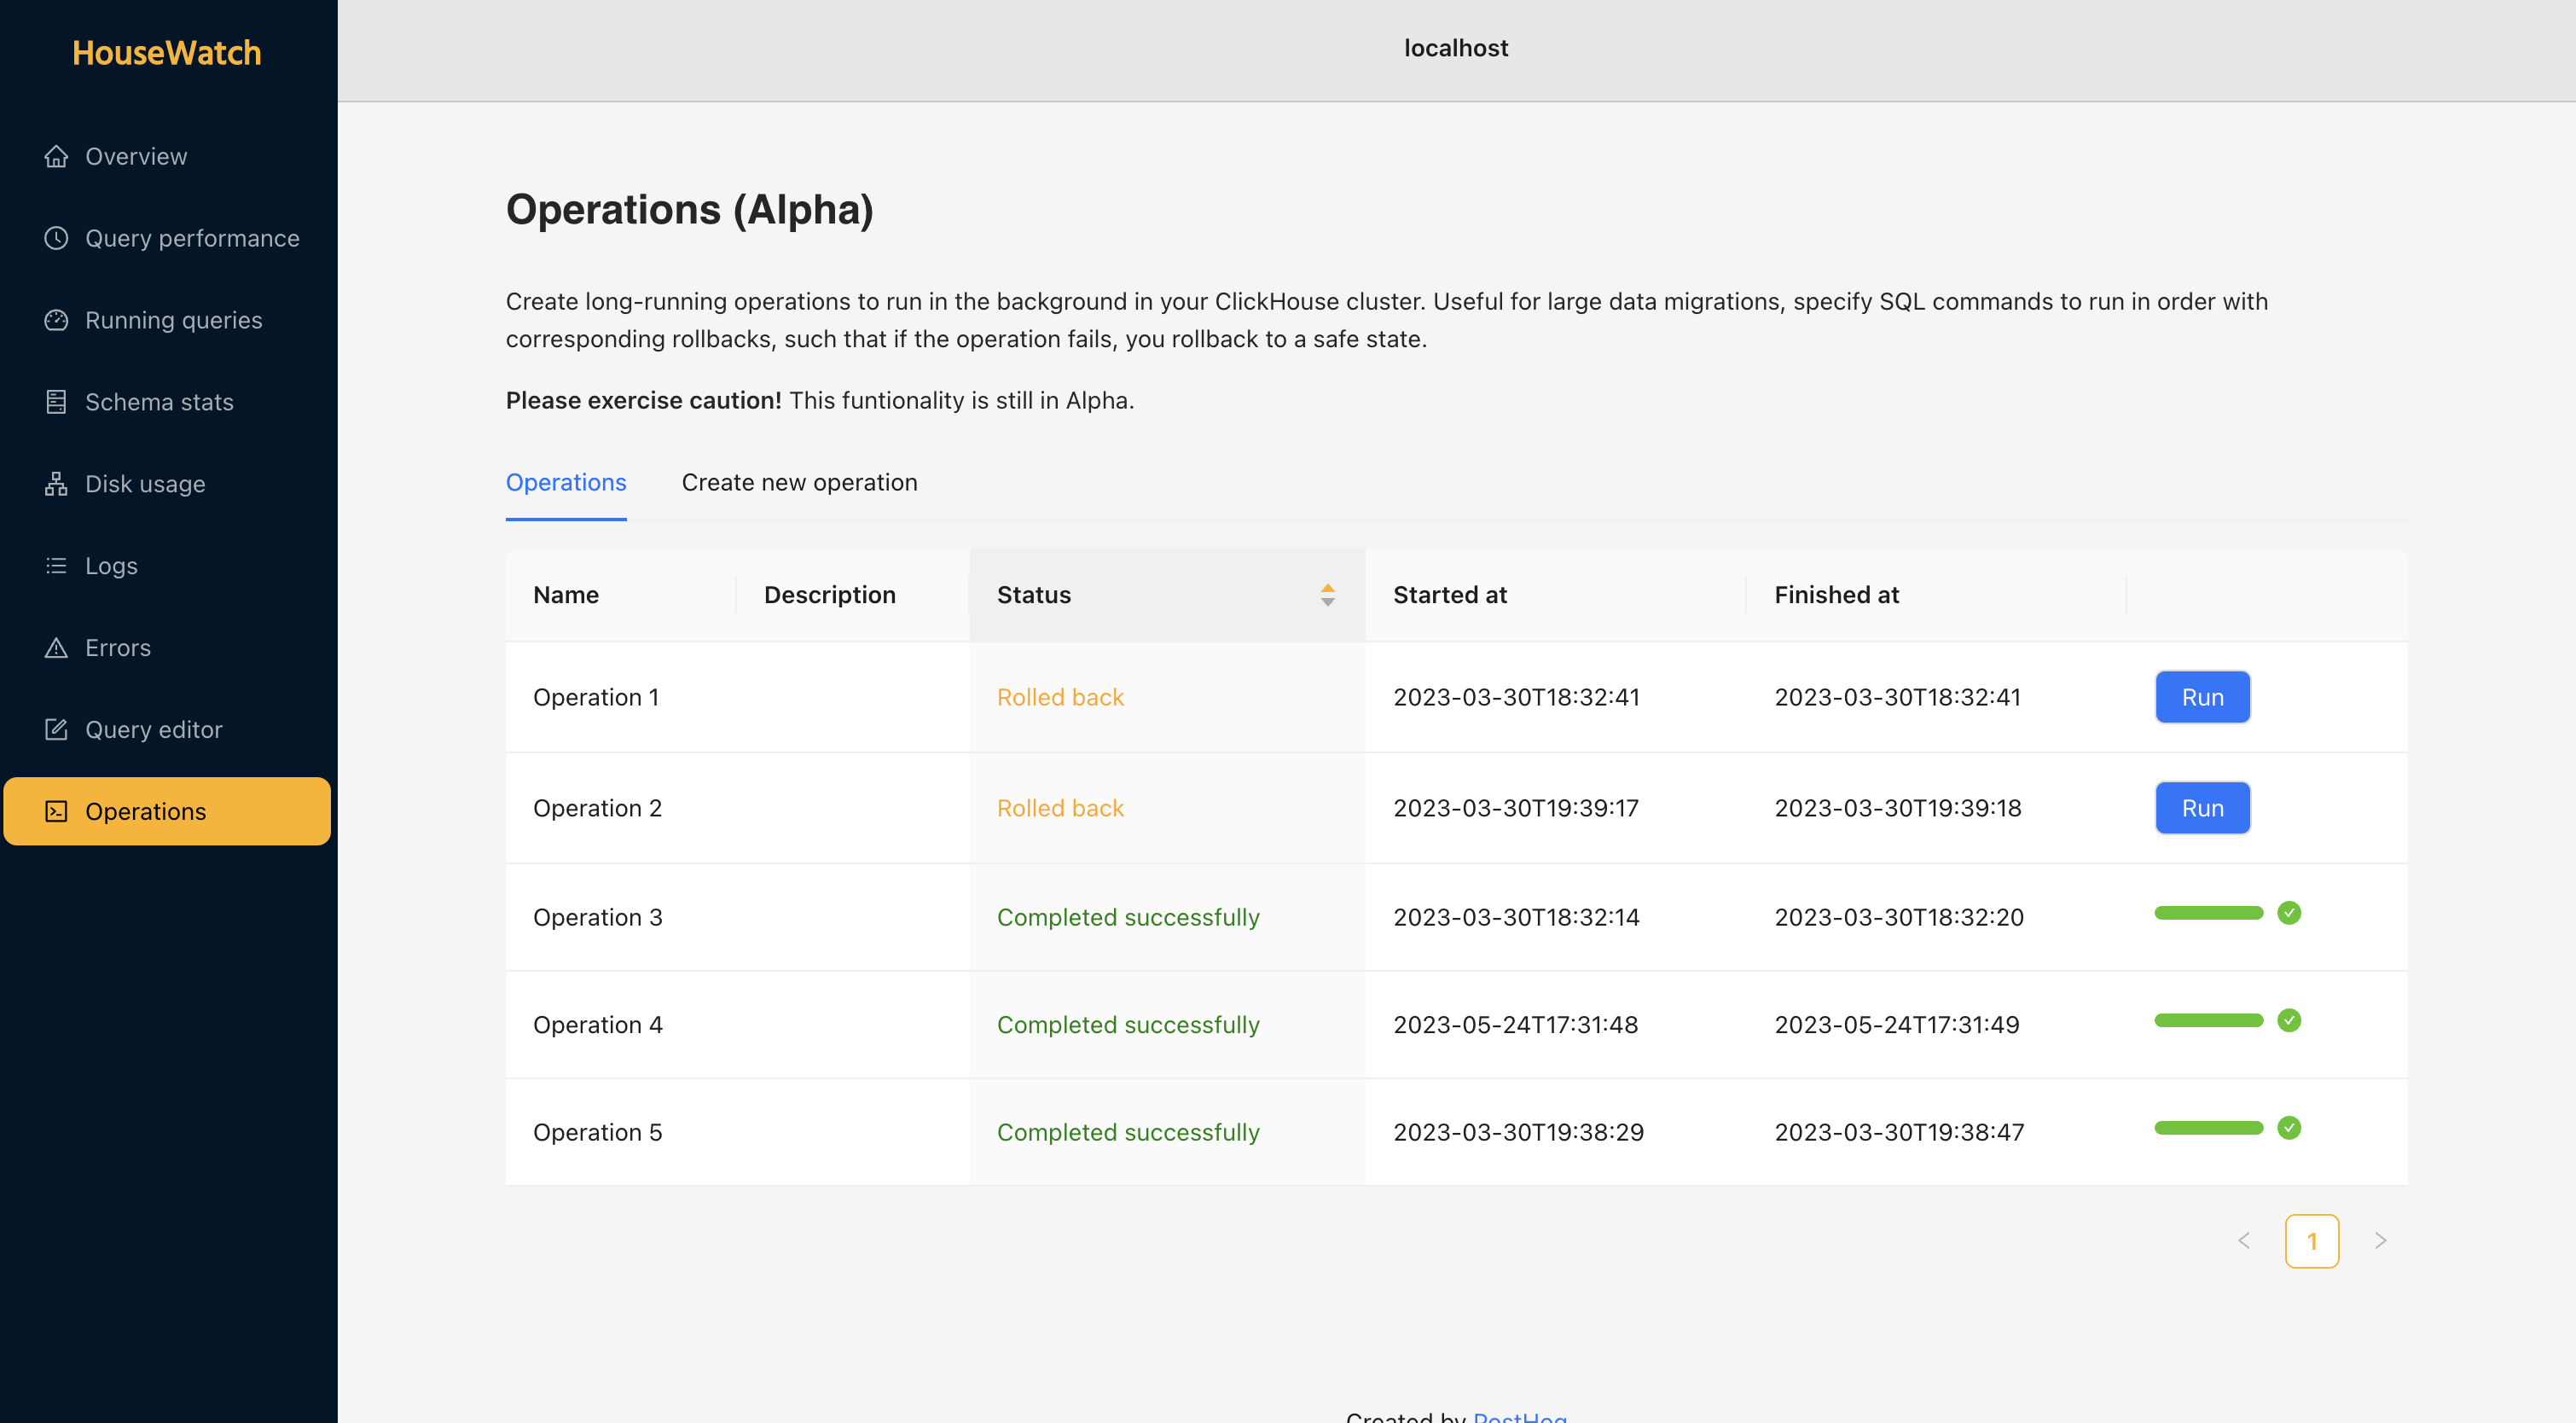
Operations

First, clone the repo.

Next, create a .env file and add the following environment variables.

Finally, run Docker Compose.

We aspire for HouseWatch to be like pganalyze for ClickHouse. There is more to build to make this a reality including:

  • An index advisor tool
  • A visualizer for EXPLAIN statements
  • Support for monitoring multiple instances
  • Automatic surfacing of known system issues

You can see our full to-do list, suggest a feature, find installation details, or contribute by going to the HouseWatch repo.

Subscribe to our newsletter

Product for Engineers

Read by 100,000+ founders and builders

We'll share your email with Substack