






by Manuel Schiller and Florian Pellet on Mar 17, 2026.

We improved TanStack Start's SSR performance dramatically. Under sustained load (using our links-100 stress benchmark with 100 concurrent connections, 30 seconds):
For SSR-heavy deployments, this translates directly to lower hosting costs, the ability to handle traffic spikes without scaling, and eliminating user-facing errors.
This work started after v1.154.4 and targets server-side rendering performance. The goal was to increase throughput and reduce server CPU time per request.
We did it with a repeatable process, not a single clever trick:
We highlight the highest-impact patterns below:
We are not claiming that any single line of code is "the" reason. This work spanned over 20 PRs, with still more to come. Every change was validated by:
We did not benchmark "a representative app page". We used endpoints that exaggerate a feature so the profile is unambiguous:
This is transferable: isolate the subsystem you want to improve, and benchmark that.
To capture a CPU profile of the server under load, we start the built server with @platformatic/flame:
This produces:
While @platformatic/flame is running in one terminal, we used autocannon in another terminal to generate a 30s sustained load. We tracked:
Example command (adjust concurrency and route):
To improve SSR performance, we repeated the same loop:
Our benchmarks were stable enough to produce very similar results on a range of setups. However, here are the exact environment details we used to run most of the benchmarks:
The exact benchmark code is available in our repository.
In our SSR profiles, URL construction/parsing showed up as significant self-time in the hot path on link-heavy endpoints. The cost comes from doing real work (parsing/normalization) and allocating objects. When you do it once, it does not matter. When you do it per link, per request, it dominates.
Use cheap predicates first, then fall back to heavyweight parsing only when needed.
The isSafeInternal check can be orders of magnitude cheaper than constructing a URL object1. It's meant to be a cheap predicate, so it is okay if some URLs that would be internal are classified as external and go through the slower path.
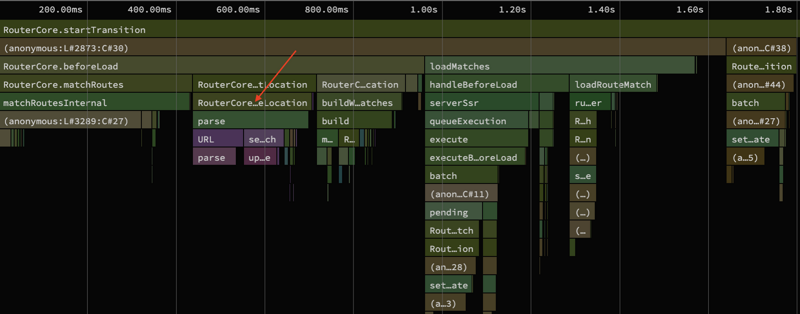
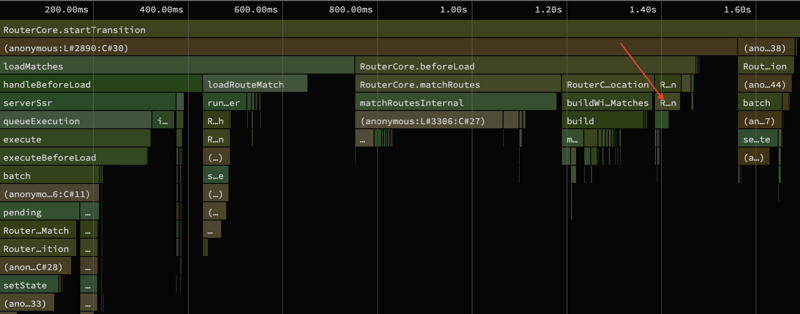
Like every PR in this series, this change was validated by profiling the impacted method before and after. For example we can see in the example below that the buildLocation method went from being one of the major bottlenecks of a navigation to being a very small part of the overall cost:
SSR renders once per request.2 There is no ongoing UI to reactively update, so on the server:
If your code supports both client reactivity and SSR, gate the reactive machinery so the server can skip it entirely:
This is the difference between "server = a function" and "client = a reactive system".
isServer is a build-time constant. This means that the above code is not violating the rules of hooks in React. At runtime, the code will always execute the same branch.
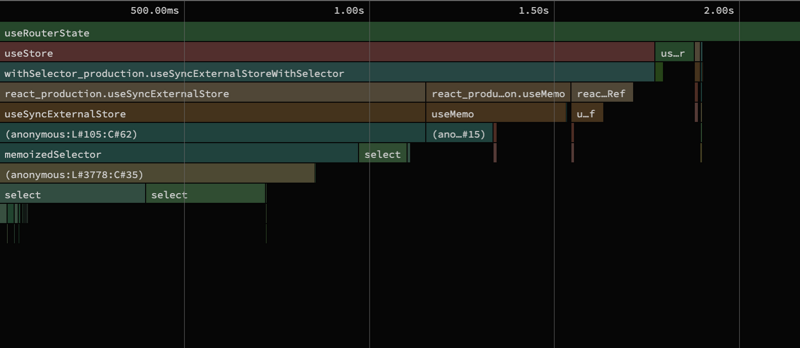
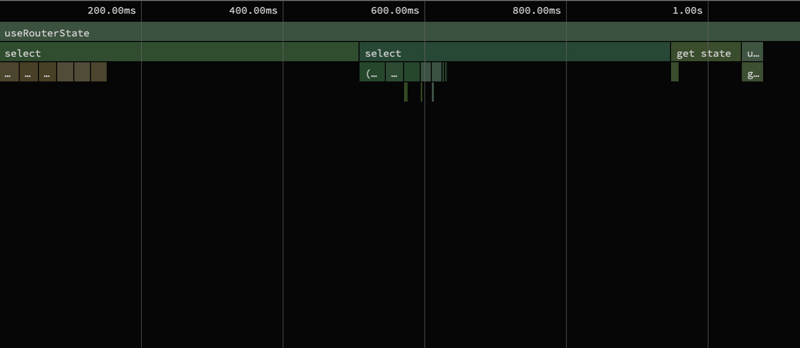
Taking the example of the useRouterState hook, we can see that most of the client-only work was removed from the SSR pass, leading to a ~2x improvement in the total CPU time of this hook.
As a general rule, client code cares about bundle size, while server code cares about CPU time per request. Those constraints are different.
If you can guard a branch with a build-time constant like isServer, you can:
In TanStack Start, isServer is provided via build-time resolution of export conditions4 (client: false, server: true, dev/test: undefined with fallback). Modern bundlers like Vite, Rollup, and esbuild perform dead code elimination (DCE)5, removing unreachable branches when the condition is a compile-time constant.
Write two implementations:
And gate them behind a build-time constant so you don't inflate the bundle size for clients.
Taking the example of the matchRoutesInternal method, we can see that its children's total CPU time was reduced by ~25%.
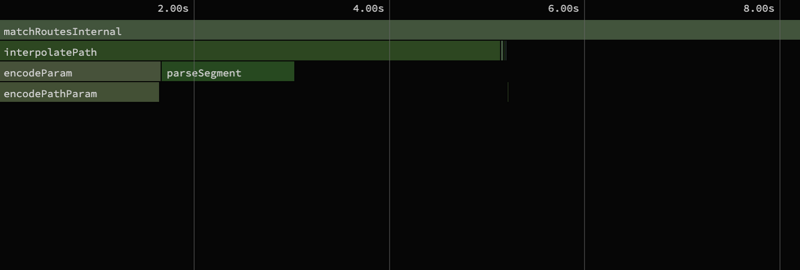
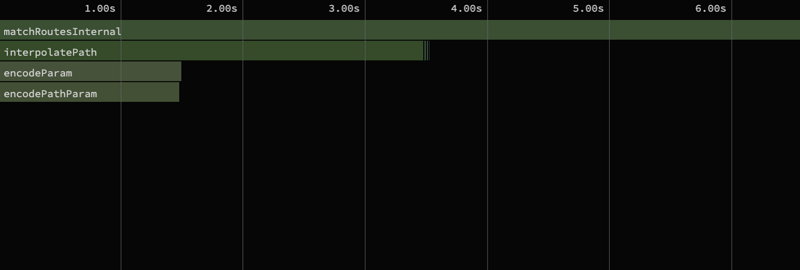
Modern engines optimize property access using object "shapes" (e.g. V8 HiddenClasses6 / JSC Structures7) and inline caches. delete changes an object's shape and can force a slower internal representation (e.g. dictionary/slow properties), which can disable or degrade those optimizations and deopt optimized code.
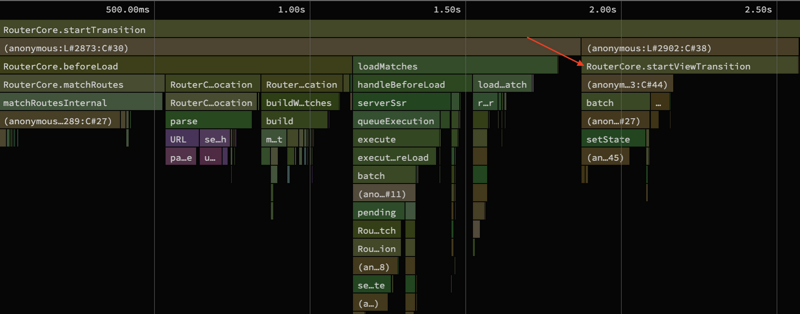
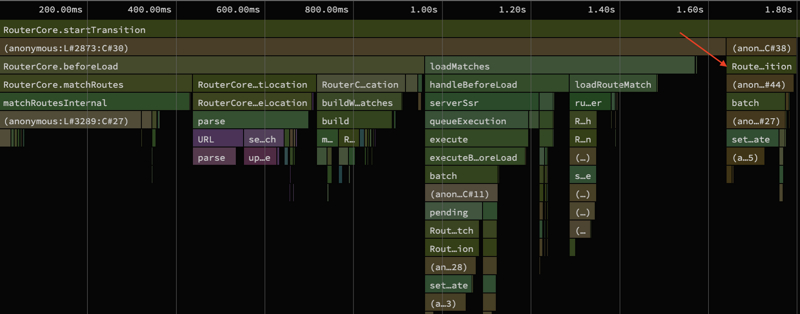
Avoid delete in hot paths. Prefer patterns that don't mutate object shapes in-place:
Taking the example of the startViewTransition method, we can see that the total CPU time of this method was reduced by >50%.
Matteo Collina independently benchmarked Start's SSR performance as part of his article investigating SSR performance across React meta-frameworks and observed significant improvements after our optimizations. The following table summarizes the before/after results under sustained load:
| Metric | Before | After | Improvement |
|---|---|---|---|
| Success rate | 75.52% | 100% | does not fail under load |
| Throughput | 477 req/s | 1041 req/s | +118% (2.2x) |
| Average latency | 3,171ms | 13.7ms | 231x faster |
| p90 latency | 10,001ms | 23.0ms | 435x faster |
| p95 latency | 10,001ms | 28.1ms | 370x faster |
The "before" numbers show a server under severe stress: 25% of requests failed (likely timeouts), and p90/p95 hit the 10s timeout ceiling. After the optimizations, the server handles the same load comfortably with sub-30ms tail latency and zero failures.
To be clear: TanStack Start was not broken before these changes. Under normal traffic, SSR worked fine. These numbers reflect behavior under sustained heavy load (the kind you see during traffic spikes or load testing). The optimizations increase headroom. At this same load, the server no longer drops requests, and it only starts failing at substantially higher load than before.
The following graphs show event-loop utilization8 against throughput for each feature-focused endpoint, before and after the optimizations. Lower utilization at the same req/s means more headroom; higher req/s at the same utilization means more capacity.
For reference, the machine on which these were measured reaches 100% event-loop utilization at 100k req/s on an empty Node HTTP server9.
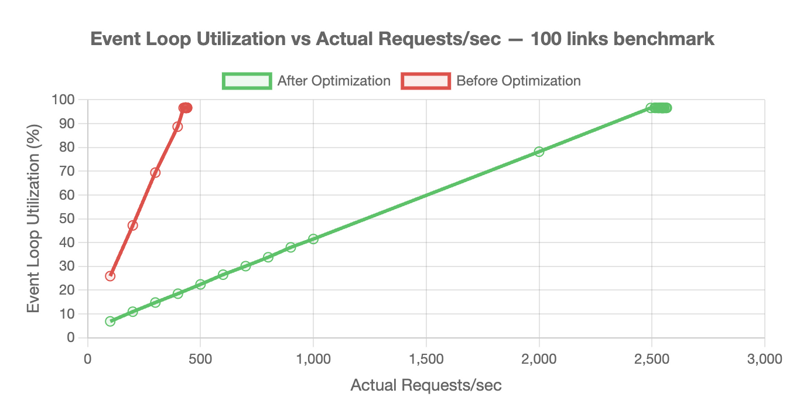
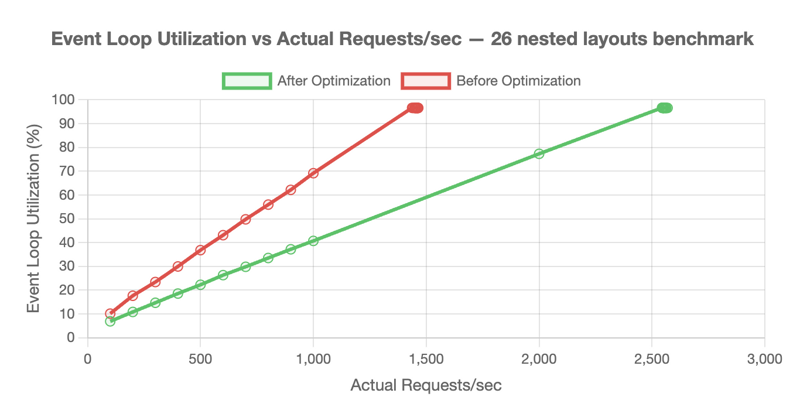
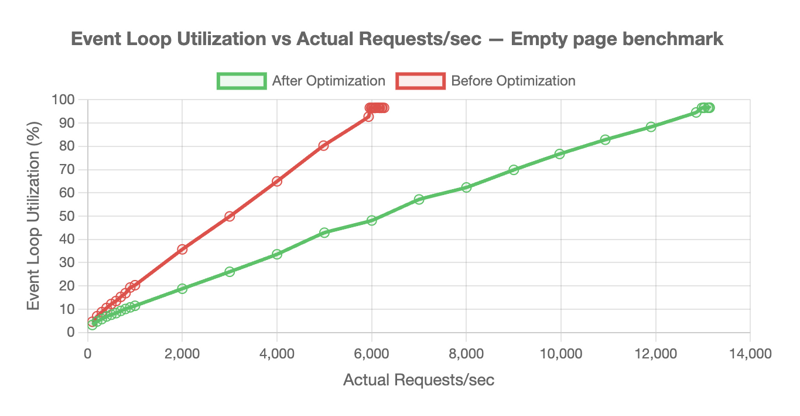
The biggest gains came from removing whole categories of work from the server hot path. Throughput improves when you eliminate repeated work, allocations, and unnecessary generality in the steady state.
There were many other improvements (client and server) not covered here. SSR performance work is ongoing.
The WHATWG URL Standard requires significant parsing work: scheme detection, authority parsing, path normalization, query string handling, and percent-encoding. See the URL parsing algorithm for the full state machine. ↩
With streaming SSR and Suspense, the server may render multiple chunks, but each chunk is still a single-pass render with no reactive updates. See renderToPipeableStream in the React documentation. ↩
Structural sharing is a pattern from immutable data libraries (Immer, React Query, TanStack Store) where unchanged portions of data structures are reused by reference to enable cheap equality checks. See Structural Sharing in the TanStack Query documentation. ↩
Conditional exports are a Node.js feature that allows packages to define different entry points based on environment or import method. See Conditional exports in the Node.js documentation. ↩
Dead code elimination is a standard compiler optimization. See esbuild's documentation on tree shaking, Rollup's tree-shaking guide and Rich Harris's article on dead code elimination. ↩
V8 team, Fast properties in V8. Great article, but 9 years old so things might have changed. ↩
WebKit, A Tour of Inline Caching with Delete ↩
Event-loop utilization is the percentage of time the event loop is busy utilizing the CPU. See this nodesource blog post for more details. ↩
To get a reference for the values we were measuring, we ran a similar autocannon benchmark on the smallest possible Node HTTP server: require('http').createServer((q,s)=>s.end()).listen(3000). This tells us the theoretical maximum throughput of the machine and test setup. ↩
此内容由惯性聚合(RSS阅读器)自动聚合整理,仅供阅读参考。 原文来自 — 版权归原作者所有。