


Hi everyone,
I am investigating an issue with a 3-node Proxmox/Ceph cluster and would like to ask if anyone has seen a similar failure mode before.
Environment
- 3 Proxmox nodes
- PVE: 9.2.2
- Ceph version: 19.2.3
- Ceph network: 10.0.50.0/24
- public_network and cluster_network are currently on the same network
- Ceph interface: bond1
- bond1 is 2 × 10G LACP / 802.3ad
- MTU 9000 on the Proxmox side
- NICs: Broadcom BCM57412 NetXtreme-E 10GbE, driver: bnxt_en
- Switch: Huawei S6730-H48X6C stack
- Pools are size=3, min_size=2
Current Linux bonding status on all three nodes looks clean from a LACP point of view:
Bonding Mode: IEEE 802.3ad Dynamic link aggregation
Transmit Hash Policy: layer2 (0)
MII Status: up
LACP active: on
LACP rate: slow
Number of ports: 2
Both slaves: 10000 Mbps/full
Aggregator ID: same on both slaves
Actor/Partner Churn State: none
Link Failure Count: 0
# begin crush map
tunable choose_local_tries 0
tunable choose_local_fallback_tries 0
tunable choose_total_tries 50
tunable chooseleaf_descend_once 1
tunable chooseleaf_vary_r 1
tunable chooseleaf_stable 1
tunable straw_calc_version 1
tunable allowed_bucket_algs 54
# devices
device 0 osd.0 class nvme
device 1 osd.1 class nvme
device 2 osd.2 class nvme
device 3 osd.3 class nvme
device 4 osd.4 class nvme
device 5 osd.5 class nvme
device 6 osd.6 class nvme
device 7 osd.7 class nvme
device 8 osd.8 class nvme
device 9 osd.9 class nvme
device 10 osd.10 class nvme
device 11 osd.11 class nvme
# types
type 0 osd
type 1 host
type 2 chassis
type 3 rack
type 4 row
type 5 pdu
type 6 pod
type 7 room
type 8 datacenter
type 9 zone
type 10 region
type 11 root
# buckets
host server1 {
id -3 # do not change unnecessarily
id -4 class nvme # do not change unnecessarily
# weight 27.94519
alg straw2
hash 0 # rjenkins1
item osd.0 weight 6.98630
item osd.1 weight 6.98630
item osd.2 weight 6.98630
item osd.3 weight 6.98630
}
host server2 {
id -5 # do not change unnecessarily
id -6 class nvme # do not change unnecessarily
# weight 27.94519
alg straw2
hash 0 # rjenkins1
item osd.4 weight 6.98630
item osd.5 weight 6.98630
item osd.6 weight 6.98630
item osd.7 weight 6.98630
}
host server3 {
id -7 # do not change unnecessarily
id -8 class nvme # do not change unnecessarily
# weight 27.94519
alg straw2
hash 0 # rjenkins1
item osd.8 weight 6.98630
item osd.9 weight 6.98630
item osd.10 weight 6.98630
item osd.11 weight 6.98630
}
root default {
id -1 # do not change unnecessarily
id -2 class nvme # do not change unnecessarily
# weight 83.83557
alg straw2
hash 0 # rjenkins1
item server1 weight 27.94519
item server2 weight 27.94519
item server3 weight 27.94519
}
# rules
rule replicated_rule {
id 0
type replicated
step take default
step chooseleaf firstn 0 type host
step emit
}
# end crush map
What happened
During maintenance we upgraded/rebooted the nodes one after another.
The order was roughly:
- server1 was upgraded/rebooted first.
- server2 was upgraded/rebooted next.
- The outage happened shortly after server2 came back.
- server3 had not yet been upgraded/rebooted at the time the outage started.
After server2 rejoined, Ceph/RBD I/O became stuck. VMs froze. Logs showed Ceph OSD heartbeat problems between server1 and server2.
Examples from the syslog:
heartbeat_check: no reply from 10.0.50.11
heartbeat_check: no reply from 10.0.50.10
slow ops
Eventually all hosts were rebooted and the cluster recovered.
Interesting observations
1. One LACP member per server has carried almost no traffic for at least a year
We checked interface graphs for the physical Ceph NICs.
For each node, one of the two LACP member interfaces has basically no useful traffic on it for at least a year. The graph shows only a few hundred bit/s average and occasional tiny kbit/s spikes, which looks like LACP/LLDP/control traffic only.
So although the Ceph network is physically 2 × 10G per node, it appears to have been effectively using only one 10G member per node.
The Linux bonding policy is currently: Transmit Hash Policy: layer2 (0)
This may explain the poor distribution, because with only three Ceph nodes there are very few MAC pairs. However, I am surprised that the pattern is so consistent over such a long time.
2. The active Ceph ports seem to be on the same stack member
LLDP shows that the Ceph NICs are connected like this:
server1:
enp194s0f0np0 -> XGigabitEthernet1/0/48 -> PortAggregID 21
enp194s0f1np1 -> XGigabitEthernet0/0/1 -> PortAggregID 21
server2:
enp194s0f0np0 -> XGigabitEthernet1/0/46 -> PortAggregID 22
enp194s0f1np1 -> XGigabitEthernet0/0/3 -> PortAggregID 22
server3:
enp194s0f0np0 -> XGigabitEthernet1/0/1 -> PortAggregID 23
enp194s0f1np1 -> XGigabitEthernet0/0/48 -> PortAggregID 23
So each server has one Ceph link on stack member 1 and one Ceph link on stack member 0.
Based on our monitoring, it looks like the useful Ceph traffic has historically been on the same side/member, while the other physical link is mostly idle.
3. Switch output drops were reported, but the traffic graph does not show a clear spike at the outage time
The data center reported Huawei switch logs with output queue drops / congestion messages on one of the Ceph member ports.
However, when looking at traffic graphs around the outage time, we do not see a clear bandwidth spike. In fact, the interface traffic seems to drop to zero shortly after the problem starts.
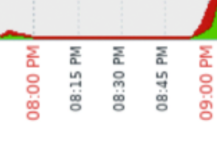
This makes me unsure whether simple port congestion is really the root cause. It feels more like a temporary forwarding/blackhole/LACP/stack/NIC issue than just “the 10G link was overloaded”.
4. MTU
On the Proxmox side, bond1 is configured with MTU 9000. LLDP from the Huawei switch shows: MFS: 9216 on the relevant Ceph ports.
Jumbo ping tests with DF have worked without any problems.
5. Broadcom bnxt_en messages
On boot, the Broadcom NICs show messages like:
hwrm_tunnel_dst_port_alloc failed. rc:-95
UDP tunnel port sync failed port 4789 type vxlan: -95
These appear on the Broadcom interfaces. Ceph itself is not using VXLAN, so I am not sure whether this is relevant or just an unrelated offload/firmware warning.
Flow control is disabled.
Questions
Has anyone seen a similar issue?
Any suggestions for specific counters or tests would be appreciated.