



Summary: VictoriaMetrics created the Prometheus-benchmark tool to compare versions and other systems that use the remote_write protocol. It uses node_exporter to generate realistic metrics, an nginx proxy to manage heavy scraping loads, and vmagent to send data to multiple destinations. The tool has proven valuable for internal testing and can help the community evaluate performance across observability solutions, though real-world validation remains essential.
Some time ago, Aliaksandr Valialkin published a medium post about comparing VictoriaMetrics and Prometheus resource usage when scraping metrics from thousands of targets. He used node_exporter as a source for metrics to scrape, which is very close to most real-world scenarios. However, the benchmark itself was just a bunch of scripts and a lot of manual work for every test.
For running internal comparisons between different VictoriaMetrics versions or between VictoriaMetrics and other solutions with Prometheus remote_write protocol support we created Prometheus-benchmark. The idea behind this is very simple:
node_exporter is used as a source of production-like metrics;nginx is used as caching proxy in front of node_exporter. It reduces the load on node_exporter when too many concurrent scrapes are happening;vmagent is used for scraping node_exporter metrics and forwarding them via Prometheus remote_write protocol to the configured
destinations. If multiple destinations are set multiple vmagent instances independently push the scraped data to these destinations.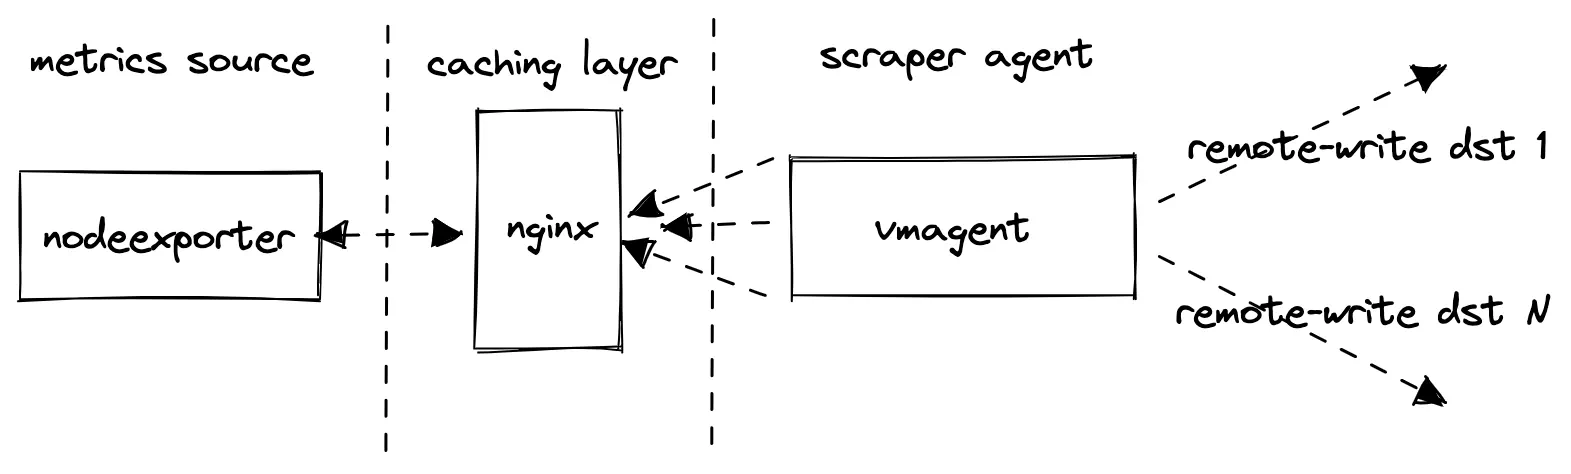
Please note, the benchmark does not collect metrics from the configured remote_write destinations.
It collects metrics for its internal components - vmagent and vmalert, so they can be inspected later.
It is assumed that the monitoring of the tested Prometheus storage systems is done separately - see these docs.
Let’s go through the most important configuration settings.
targetsCount
defines how many node_exporter scrape targets are added to vmagent’s scrape config (each with unique instance label).
This param affects the volume of scraped metrics and cardinality. Typically, one node_exporter produces around 800 unique metrics.
scrapeInterval defines how frequently to scrape each target. This param affects data ingestion rate. The lower the interval, the higher the data ingestion rate is.
remoteStorages contains a list of tested systems where to push the scraped metrics. If multiple destinations are set multiple vmagent instances individually push the same data to multiple destinations.
scrapeConfigUpdatePercent and scrapeConfigUpdateInterval can be used for generating non-zero time series churn rate, which is typical in Kubernetes monitoring.
A typical scenario is to run multiple VictoriaMetrics installations and list their addresses
in remoteStorages section.
The default config for such tests is targetsCount=1000 and scrapeInterval=10s which results in about 80k samples/s:
800 metrics-per-target * 1k targets / 10s = 80k samples/s
We have separate monitoring for every remote-write destination, so later we can compare the resource usage, data compression and overall performance via the official Grafana dashboards for VictoriaMetrics.
As a bonus, the helm chart also contains a vmalert configuration for running read queries. These are standard alerting rules for node_exporter. Running vmalert is optional and allows generating a more production-like workload, where metrics storage receives production-like read requests additionally to data ingestion. The alerting rules file can be easily replaced with custom set of rules. The frequency of rules evaluation is controlled by the queryInterval parameter.
The benchmark proved to be useful for our internal tests. We believe that the community may also benefit from it when comparing different solutions or versions of the same solution, which accept data via Prometheus remote_write protocol. For example, Prometheus itself, Cortex, Thanos, M3DB and TimescaleDB. However, we always recommend to not simply believe synthetic benchmarks, but validate the numbers and resource usage on production-like data.
We use vmagent to scrape metrics and forward them through the Prometheus remote_write protocol. This lets teams test VictoriaMetrics and other compatible backends consistently while comparing ingestion, resource usage, compression, and performance.
Custom protocols can improve efficiency, but they may reduce portability if other systems do not support them. For broad compatibility, we support Prometheus remote_write, which makes it easier to integrate with existing Prometheus-based monitoring stacks.
Our benchmark uses node_exporter metrics, scrape intervals, target counts, and optional churn to model production-like workloads. Still, we recommend validating results with your own data, cardinality, churn, query load, and retention needs.
It can. Ingestion efficiency, compression, scrape interval, cardinality, and storage design all affect resource usage, query performance, and retention costs. We recommend testing both write and read workloads together before making production decisions.
Yes. We built the open-source Prometheus-benchmark project so teams can run similar tests using node_exporter, nginx, vmagent, remote_write destinations, and optional vmalert read queries. Adjust targets, scrape intervals, churn, and storage backends.
此内容由惯性聚合(RSS阅读器)自动聚合整理,仅供阅读参考。 原文来自 — 版权归原作者所有。