惯性聚合 高效追踪和阅读你感兴趣的博客、新闻、科技资讯
阅读原文 在惯性聚合中打开

推荐订阅源

S
Security @ Cisco Blogs
Microsoft Security Blog
GbyAI
GbyAI
Google DeepMind News
WordPress大学
WordPress大学
L
LangChain Blog
爱范儿
爱范儿
N
Netflix TechBlog - Medium
The Register - Security
Jina AI
Jina AI
V
V2EX
Hugging Face - Blog
Hugging Face - Blog
I
InfoQ
罗磊的独立博客
Stack Overflow Blog
Stack Overflow Blog
Microsoft Azure Blog
Last Week in AI
Last Week in AI
Recorded Future
Recorded Future
D
DataBreaches.Net
Project Zero
Project Zero
博客园 - 【当耐特】
宝玉的分享
宝玉的分享
T
The Exploit Database - CXSecurity.com
A
Arctic Wolf
freeCodeCamp Programming Tutorials: Python, JavaScript, Git & More
Engineering at Meta
Engineering at Meta
D
Docker
F
Fortinet All Blogs
P
Palo Alto Networks Blog
Cyber Security Advisories - MS-ISAC
T
Tailwind CSS Blog
S
Schneier on Security
博客园 - 司徒正美
Threat Intelligence Blog | Flashpoint
Scott Helme
Scott Helme
Security Latest
Security Latest
V
Visual Studio Blog
T
Tor Project blog
I
Intezer
T
Threat Research - Cisco Blogs
MyScale Blog
MyScale Blog
月光博客
月光博客
MongoDB | Blog
MongoDB | Blog
P
Privacy International News Feed
云风的 BLOG
云风的 BLOG
C
Cisco Blogs
The Cloudflare Blog
Simon Willison's Weblog
Vercel News
Vercel News
S
Securelist

VictoriaMetrics: Simple & Reliable Monitoring for Everyone on VictoriaMetrics

Operator now has Long-Term Support (LTS) version Multi-tiered Observability: A Practical Way to Handle Diverse Workloads VictoriaMetrics April 2026 Ecosystem Updates Not All Telemetry Requires Premium Pricing VictoriaMetrics at KubeCon Amsterdam: Community Highlights What's new in VictoriaMetrics Anomaly Detection (Q1 2026) What's New in VictoriaMetrics Cloud Q1 2026? Logs, MCP Server, Better Alerting, and... a Secret Project VictoriaMetrics at KubeCon: Optimizing Tail Sampling in OpenTelemetry with Retroactive Sampling VictoriaMetrics March 2026 Ecosystem Updates Observability Lessons From OpenAI Benchmarking Kubernetes Log Collectors: vlagent, Vector, Fluent Bit, OpenTelemetry Collector, and more VictoriaMetrics February 2026 Ecosystem Updates VictoriaMetrics at FOSDEM, Cloud Native Days France, and CfgMgmtCamp Ghent VictoriaLogs in VictoriaMetrics Cloud: Fast, Cost-Effective Log Management is Here What’s new in VictoriaMetrics Anomaly Detection (2025) VictoriaMetrics January 2026 Ecosystem Updates VictoriaLogs Basics: What You Need to Know, with Examples & Visuals What's New in VictoriaMetrics Cloud Q4 2025? New tiers, more deployment options, IaC and alerting rules. Vibe coding tools observability with VictoriaMetrics Stack and OpenTelemetry How a US Software Provider Improved Traffic Alerting with VictoriaMetrics Anomaly Detection VictoriaMetrics 2025 Developer Experience: A Year in Review Spotify’s performance & control across large monitoring environments with VictoriaMetrics VictoriaMetrics Achieves Red Hat OpenShift Operator Certification Our latest updates across the VictoriaMetrics Observability ecosystem New Capacity Tiers in VictoriaMetrics Cloud Announcing 1B+ Downloads & Product Development With Logs, Traces, Metrics AI Agents Observability with OpenTelemetry and the VictoriaMetrics Stack Discarding gRPC-Go: The Story Behind OTLP/gRPC Support in VictoriaTraces What's New in VictoriaMetrics Cloud Q3 2025? From new region in Asia to proactive alerts How DreamHost Slashed Memory Usage by 80% and Scaled to 76 Million Time Series Upcoming Conferences & Meetups: Where to Meet Our Team VictoriaMetrics Long-Term Support (LTS): H2 2025 Update Creating a Sustainable Open Source Business Model - Introduction Full-Stack Observability with VictoriaMetrics in the OTel Demo Alerting Best Practices vmanomaly Deep Dive: Smarter Alerting with AI (Tech Talk Companion) VictoriaLogs Practical Ingestion Guide for Message, Time and Streams Monotonic and Wall Clock Time in the Go time package Hello Singapore! VictoriaMetrics Cloud Expands to Asia Pacific MCP Server Integration & Much More: What's New in VictoriaMetrics Cloud Q2 2025 FIPS 140-3 Compatible Builds for VictoriaMetrics Enterprise Components VictoriaLogs Unleashed: Cluster Version Now Available for Exceptional, Linear Scaling Integrations made easy with VictoriaMetrics Cloud Developer's Note: Research on Distributed Tracing, Comparing With Tempo and ClickHouse vmagent: Key Features Explained in Under 15 Minutes Go synctest: Solving Flaky Tests vmalert: Maximize Your Monitoring (Tech Talk Companion) Celebrating 14K Stars on GitHub: Spring Update vmalert: Maximize Your Monitoring VictoriaMetrics Connects with the Open Source Community at LinuxFest Northwest 2025 Graceful Shutdown in Go: Practical Patterns VictoriaLogs: Gaps, Gains & Growth Prometheus Monitoring: Functions, Subqueries, Operators, and Modifiers VictoriaMetrics Cloud: What's New in Q1 2025? Don’t default to microservices: You’ll thank us later! Container CPU Requests & Limits Explained with GOMAXPROCS Tuning gRPC in Go: Streaming RPCs, Interceptors, and Metadata From Chaos to Clarity with VictoriaLogs Prometheus Alerting 101: Rules, Recording Rules, and Alertmanager Heading to London: Meet Our Team at KubeCon Europe 2025 Inside vmselect: The Query Processing Engine of VictoriaMetrics Meet Our Team at Scale 22x Practical Protobuf - From Basic to Best Practices VictoriaLogs Status Update: Heading Towards the Cluster Version 24th of February 2025 Statement: VictoriaMetrics Stands with Ukraine! Prometheus Metrics Explained: Counters, Gauges, Histograms & Summaries Prometheus Monitoring: Instant Queries and Range Queries Explained 300%+ Growth in 2024: Join Our Team in 2025! FOSDEM 2025 recap How Protobuf Works—The Art of Data Encoding OpenTelemetry, Prometheus, and More: Which Is Better for Metrics Collection and Propagation? How vmstorage Handles Query Requests From vmselect How vmstorage's IndexDB Works VictoriaMetrics Tech Talk Stream: A Deep Dive into Blackbox Monitoring How HTTP/2 Works and How to Enable It in Go VictoriaMetrics Cloud: What's New in Q4 2024? How vmstorage Processes Data: Retention, Merging, Deduplication,... How vmstorage Handles Data Ingestion From vminsert When Metrics Meet vminsert: A Data-Delivery Story From net/rpc to gRPC in Go Applications Piros | VictoriaMetrics Partner Allenta | VictoriaMetrics Partner CloudRaft | VictoriaMetrics Partner Sensedia & VictoriaMetrics: API-compatible Efficient Storage Scalable Prometheus: Why DSV Chose VictoriaMetrics Sensor Factory | VictoriaMetrics Partner Erythix | VictoriaMetrics Partner Groove X & VictoriaMetrics: Faster Device Health Monitoring Scaled & Performant Monitoring at Spotify with VictoriaMetrics Grammarly & VictoriaMetrics: 10× Lower Costs & Direct Access Zelarsoft | VictoriaMetrics Partner DFKI & VictoriaMetrics: Efficient Long-Term Metric Storage Niubits | VictoriaMetrics Partner Megazone Cloud | VictoriaMetrics Partner Cogito Software | VictoriaMetrics Partner Bajau | VictoriaMetrics Partner Find Out Why Dig Security Chose VictoriaMetrics! Ness | VictoriaMetrics Partner Alpha Data | VictoriaMetrics Partner SIOS Technology | VictoriaMetrics Partner
Benchmarking Prometheus-compatible time series databases
Roman Khavronenko · 2022-01-17 · via VictoriaMetrics: Simple & Reliable Monitoring for Everyone on VictoriaMetrics

Summary: VictoriaMetrics created the Prometheus-benchmark tool to compare versions and other systems that use the remote_write protocol. It uses node_exporter to generate realistic metrics, an nginx proxy to manage heavy scraping loads, and vmagent to send data to multiple destinations. The tool has proven valuable for internal testing and can help the community evaluate performance across observability solutions, though real-world validation remains essential.

Prometheus remote_write benchmark

#

Some time ago, Aliaksandr Valialkin published a medium post about comparing VictoriaMetrics and Prometheus resource usage when scraping metrics from thousands of targets. He used node_exporter as a source for metrics to scrape, which is very close to most real-world scenarios. However, the benchmark itself was just a bunch of scripts and a lot of manual work for every test.

For running internal comparisons between different VictoriaMetrics versions or between VictoriaMetrics and other solutions with Prometheus remote_write protocol support we created Prometheus-benchmark. The idea behind this is very simple:

  • node_exporter is used as a source of production-like metrics;
  • nginx is used as caching proxy in front of node_exporter. It reduces the load on node_exporter when too many concurrent scrapes are happening;
  • vmagent is used for scraping node_exporter metrics and forwarding them via Prometheus remote_write protocol to the configured destinations. If multiple destinations are set multiple vmagent instances independently push the scraped data to these destinations.

benchmark architecture

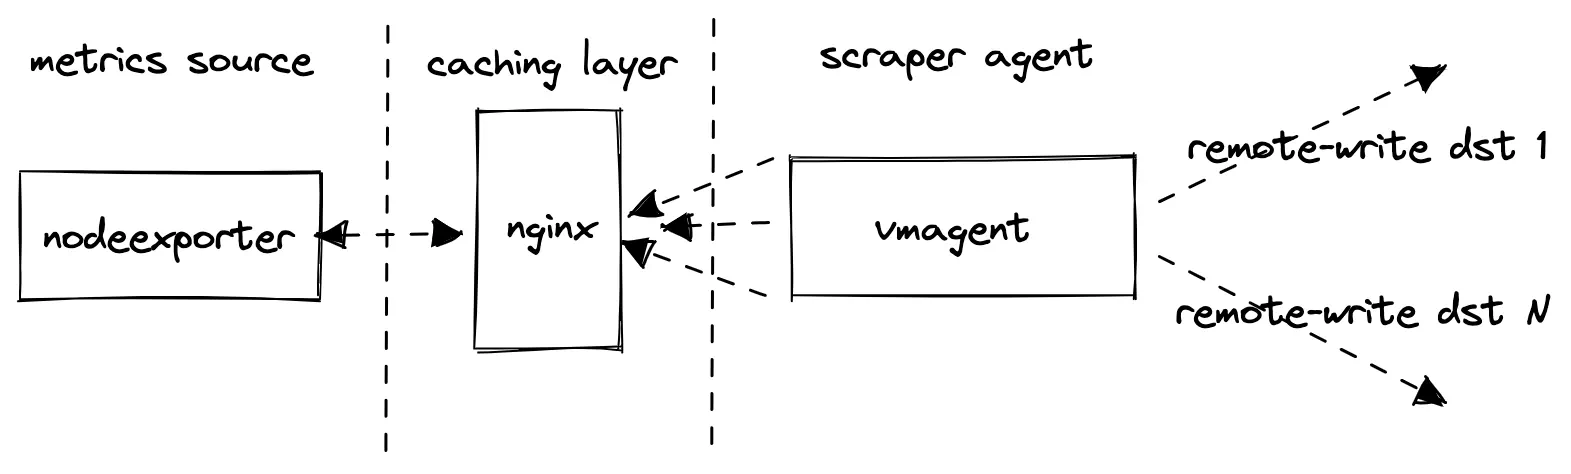
Please note, the benchmark does not collect metrics from the configured remote_write destinations. It collects metrics for its internal components - vmagent and vmalert, so they can be inspected later. It is assumed that the monitoring of the tested Prometheus storage systems is done separately - see these docs.

Let’s go through the most important configuration settings.

Targets count

#

targetsCount defines how many node_exporter scrape targets are added to vmagent’s scrape config (each with unique instance label). This param affects the volume of scraped metrics and cardinality. Typically, one node_exporter produces around 800 unique metrics.

Scrape interval

#

scrapeInterval defines how frequently to scrape each target. This param affects data ingestion rate. The lower the interval, the higher the data ingestion rate is.

Remote storages

#

remoteStorages contains a list of tested systems where to push the scraped metrics. If multiple destinations are set multiple vmagent instances individually push the same data to multiple destinations.

Churn rate

#

scrapeConfigUpdatePercent and scrapeConfigUpdateInterval can be used for generating non-zero time series churn rate, which is typical in Kubernetes monitoring.

How do we use it?

#

A typical scenario is to run multiple VictoriaMetrics installations and list their addresses in remoteStorages section. The default config for such tests is targetsCount=1000 and scrapeInterval=10s which results in about 80k samples/s:

800 metrics-per-target * 1k targets / 10s = 80k samples/s

We have separate monitoring for every remote-write destination, so later we can compare the resource usage, data compression and overall performance via the official Grafana dashboards for VictoriaMetrics.

Bonus: read load

#

As a bonus, the helm chart also contains a vmalert configuration for running read queries. These are standard alerting rules for node_exporter. Running vmalert is optional and allows generating a more production-like workload, where metrics storage receives production-like read requests additionally to data ingestion. The alerting rules file can be easily replaced with custom set of rules. The frequency of rules evaluation is controlled by the queryInterval parameter.

Conclusion

#

The benchmark proved to be useful for our internal tests. We believe that the community may also benefit from it when comparing different solutions or versions of the same solution, which accept data via Prometheus remote_write protocol. For example, Prometheus itself, Cortex, Thanos, M3DB and TimescaleDB. However, we always recommend to not simply believe synthetic benchmarks, but validate the numbers and resource usage on production-like data.

Frequently Asked Questions

#

In what ways does VictoriaMetrics implementation of the remote write protocol differ from the standard protocol, and what advantages does that bring?

#

We use vmagent to scrape metrics and forward them through the Prometheus remote_write protocol. This lets teams test VictoriaMetrics and other compatible backends consistently while comparing ingestion, resource usage, compression, and performance.

What are the limitations or trade-offs of using a custom remote write protocol in large-scale deployments?

#

Custom protocols can improve efficiency, but they may reduce portability if other systems do not support them. For broad compatibility, we support Prometheus remote_write, which makes it easier to integrate with existing Prometheus-based monitoring stacks.

How representative is this Prometheus benchmark of real-world workloads (e.g. churn, cardinality, scrape intervals)?

#

Our benchmark uses node_exporter metrics, scrape intervals, target counts, and optional churn to model production-like workloads. Still, we recommend validating results with your own data, cardinality, churn, query load, and retention needs.

Does optimizing write performance affect query performance or data retention costs?

#

It can. Ingestion efficiency, compression, scrape interval, cardinality, and storage design all affect resource usage, query performance, and retention costs. We recommend testing both write and read workloads together before making production decisions.

Can these benchmark results be replicated, and if so, how?

#

Yes. We built the open-source Prometheus-benchmark project so teams can run similar tests using node_exporter, nginx, vmagent, remote_write destinations, and optional vmalert read queries. Adjust targets, scrape intervals, churn, and storage backends.