





Monitoring with cAdvisor allows you to gather information about individual Docker containers running on your host - be it a virtual machine, Kubernetes cluster, or any other host capable of running containers.
cAdvisor (short for "Container Advisor") is a daemon that collects the data about the resource usage and performance of your containers.
In addition to container usage metrics, cAdvisor can also collect metrics from your applications. If your applications are already emitting metrics, you can configure cAdviser to scrape the endpoint and include which metrics you want to extract.
cAdvisor also features a built-in UI, and it also allows you to export the collected data to different storage driver plugins.
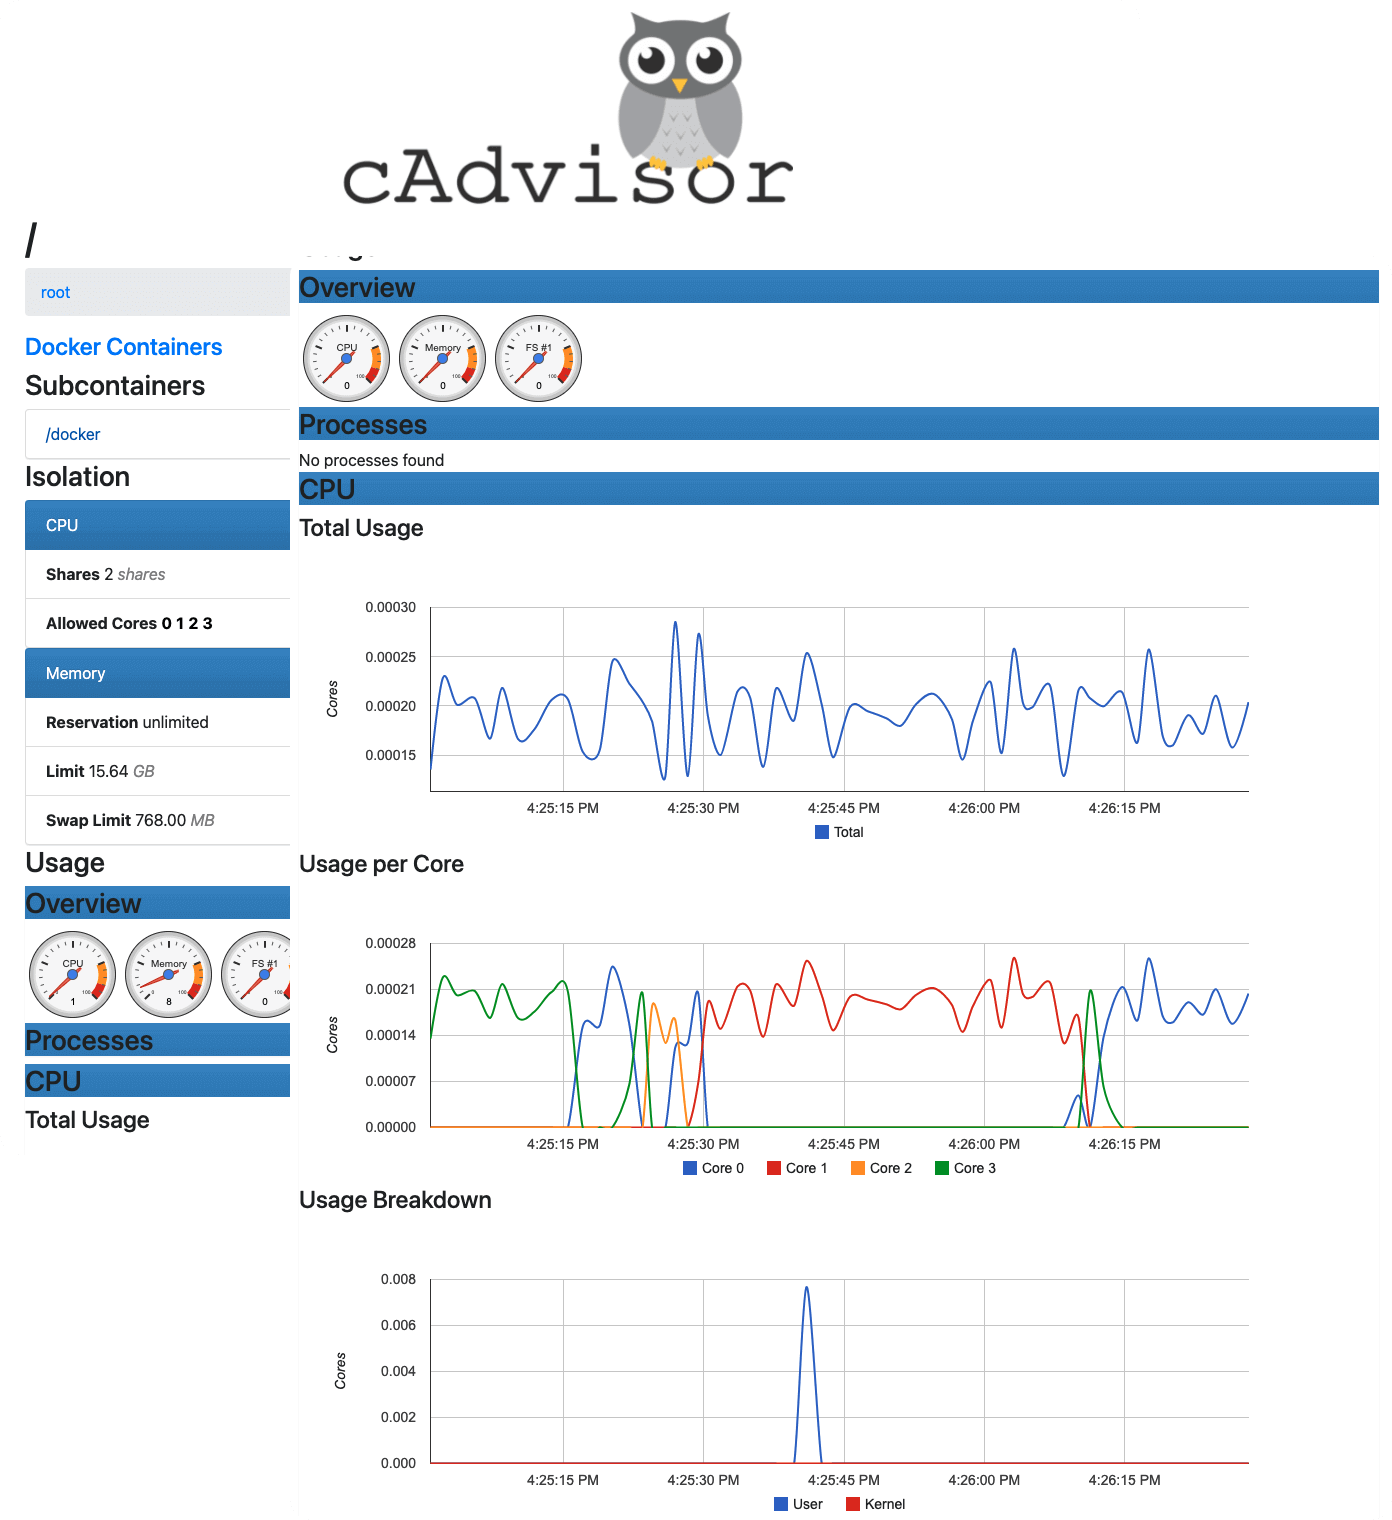
For example, you can export the collected data to:
The easiest way to get started and see the data that gets collected is to run the cAdvisor Docker image locally:
sudo docker run \
  --volume=/:/rootfs:ro \
  --volume=/var/run:/var/run:ro \
  --volume=/sys:/sys:ro \
  --volume=/var/lib/docker/:/var/lib/docker:ro \
  --volume=/dev/disk/:/dev/disk:ro \
  --publish=8080:8080 \
  --detach=true \
  --name=cadvisor \
  --privileged \
  --device=/dev/kmsg \
  gcr.io/cadvisor/cadvisor:v0.37.5
Note
The latest version of cAdvisor at the time of writing this was v0.37.5. Make sure you're always using the latest bits.
In case you're wondering about all those volumes... These are the folders you need to mount inside the cAdvisor image so that the cAdvisor can analyze all the data from them.
Once the cAdvisor is running, it will collect data about all containers running on the same host. Note that there are options you can set to limit which containers get monitored.
cAdvisor is integrated with the kubelet binary, and it exposes the metrics on /metrics/cadvisor endpoint.
Therefore we don't need to install cAdvisor on the Kubernetes cluster explicitly.
Here's an example of how we can use kubectl to retrieve the cluster node metrics and Pod metrics:
$ kubectl get --raw /apis/metrics.k8s.io/v1beta1/nodes/[node-name]
{
  "kind": "NodeMetrics",
  "apiVersion": "metrics.k8s.io/v1beta1",
  "metadata": {
    "name": "[node-name]",
    "selfLink": "/apis/metrics.k8s.io/v1beta1/nodes/[node-name]]",
    "creationTimestamp": "2021-08-26T22:12:26Z"
  },
  "timestamp": "2021-08-26T22:11:53Z",
  "window": "30s",
  "usage": {
    "cpu": "39840075n",
    "memory": "487200Ki"
  }
}
Similarly, we can use the following URL /apis/metrics.k8s.io/v1beta1/namespaces/<NAMESPACE>/pods/<POD_NAME> to get the metrics about a specific pod.
Let's create an httpbin deployment:
kubectl apply -f https://raw.githubusercontent.com/istio/istio/master/samples/httpbin/httpbin.yaml
To retrieve the metrics from the httpbin pod, run the command below (make sure you replace the pod name with the name of your pod running in your cluster):
$ kubectl get --raw /apis/metrics.k8s.io/v1beta1/namespaces/default/pods/httpbin-74fb669cc6-xs74p
{
  "kind": "PodMetrics",
  "apiVersion": "metrics.k8s.io/v1beta1",
  "metadata": {
    "name": "httpbin-74fb669cc6-xs74p",
    "namespace": "default",
    "selfLink": "/apis/metrics.k8s.io/v1beta1/namespaces/default/pods/httpbin-74fb669cc6-xs74p",
    "creationTimestamp": "2021-08-26T22:15:40Z"
  },
  "timestamp": "2021-08-26T22:15:16Z",
  "window": "30s",
  "containers": [
    {
      "name": "httpbin",
      "usage": {
        "cpu": "316267n",
        "memory": "38496Ki"
      }
    }
  ]
}
By default, cAdvisor exposes the Prometheus metrics on the /metrics endpoint.
# HELP cadvisor_version_info A metric with a constant '1' value labeled by kernel version, OS version, docker version, cadvisor version & cadvisor revision.
# TYPE cadvisor_version_info gauge
cadvisor_version_info{cadvisorRevision="de117632",cadvisorVersion="v0.39.0",dockerVersion="20.10.3",kernelVersion="5.4.104+",osVersion="Alpine Linux v3.12"} 1
# HELP container_blkio_device_usage_total Blkio Device bytes usage
# TYPE container_blkio_device_usage_total counter
container_blkio_device_usage_total{container_env_ARG1="",container_env_ARG2="",container_env_CADVISOR_HEALTHCHECK_URL="",container_env_DEFAULT_HTTP_BACKEND_PORT="",container_env_DEFAULT_HTTP_BACKEND_PORT_80_TCP="",container_env_DEFAULT_HTTP_BACKEND_PORT_80_TCP_ADDR="",container_env_DEFAULT_HTTP_BACKEND_PORT_80_TCP_PORT="",container_env_DEFAULT_HTTP_BACKEND_PORT_80_TCP_PROTO="",
...
Because metrics are already in Prometheus format and cAdvisor exports them automatically on a well-known endpoint, we don't need to change the existing cAdvisor deployment. Instead, we can install and configure Prometheus to scrape the metrics from the /metrics endpoint.
I'll use Prometheus Operator to install Prometheus on Kubernetes. We'll install the complete monitoring bundle, including Prometheus, Grafana, and Alert manager.
Start by cloning the kube-prometheus repository:
git clone https://github.com/prometheus-operator/kube-prometheus.git
Then, go to the kube-prometheus folder and deploy the CRDs first:
kubectl apply -f manifests/setup
Wait for a bit for the CRDs to be applied and then create the deployments:
kubectl apply -f manifests/
Once you've deployed everything (you can run kubectl get pod -A to check all pods are up and running), you can open the Prometheus UI:
kubectl port-forward svc/prometheus-k8s 9090 -n monitoring
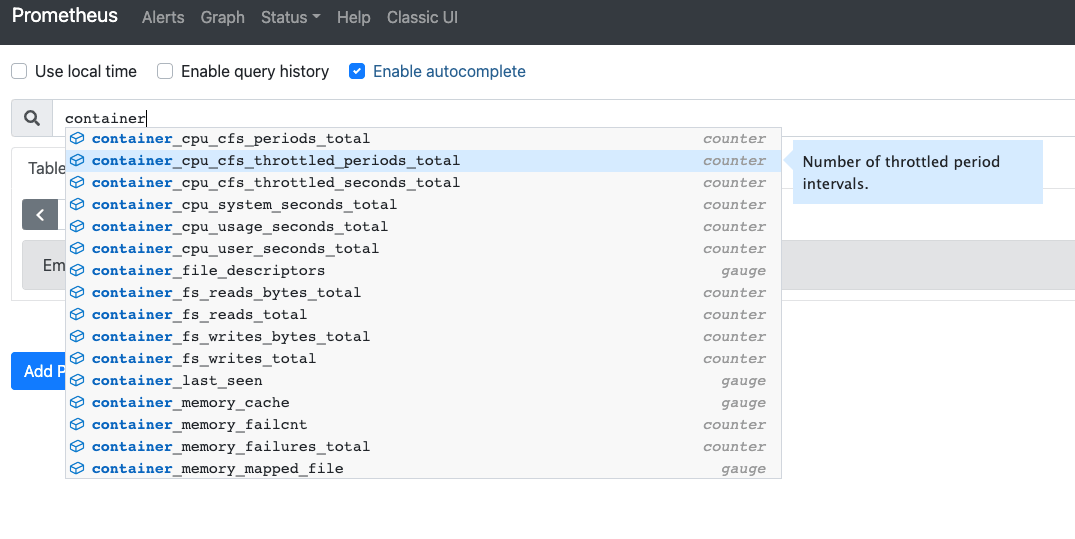
If you open http://localhost:9090, you can now query for any metrics collected by the cAdvisor - e.g., metrics starting with container_* as shown in the figure below.
Grafana gets installed as part of the kube-prometheus operator. We can open the Grafana UI by port-forwarding to port 3000:
kubectl port-forward svc/grafana 5000:3000 -n monitoring
If you open Grafana on http://localhost:5000 you'll notice there's already a set of pre-created dashboards that came with the kube-prometheus operator.
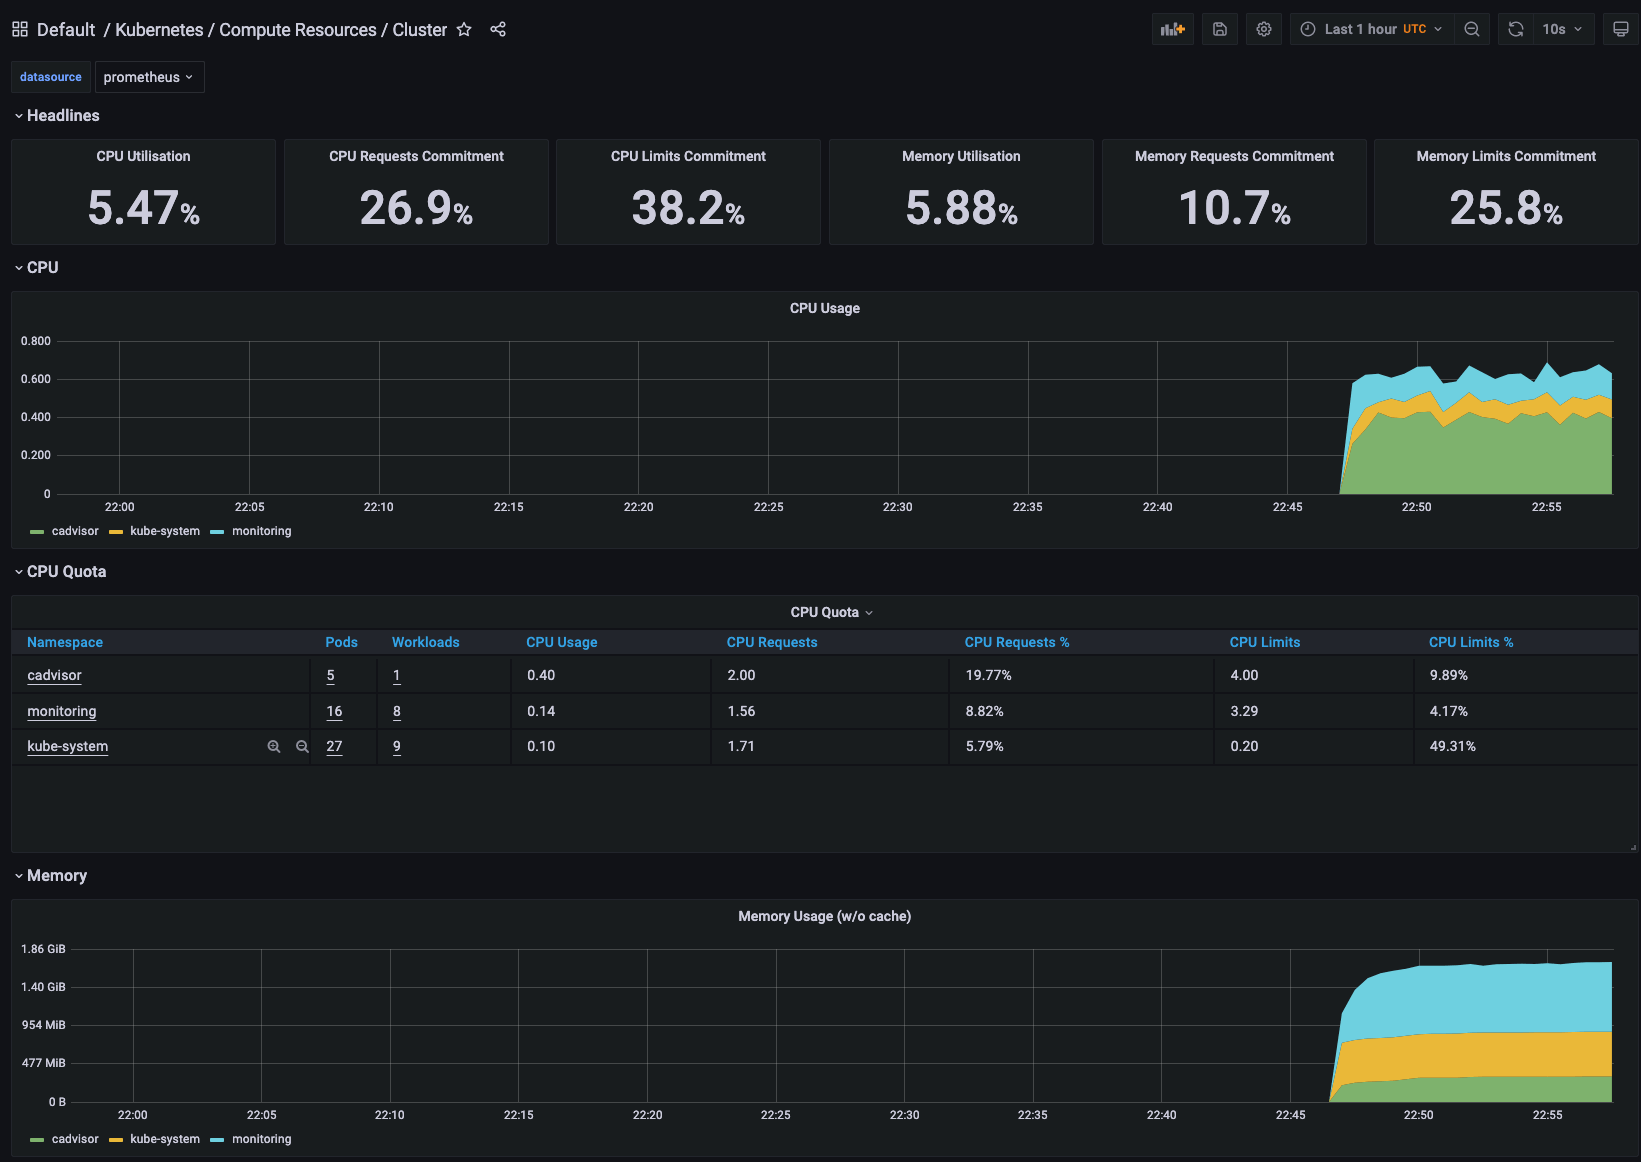
The dashboards show you the information about Kubernetes resources - memory usage, CPU usage, quotas, and so on. These metrics are coming from the node-exporter component.
The node-exporter exports the hardware and OS metrics to Prometheus while cAdvisor collects the metrics about containers.
Installing a dashboard is straightforward.
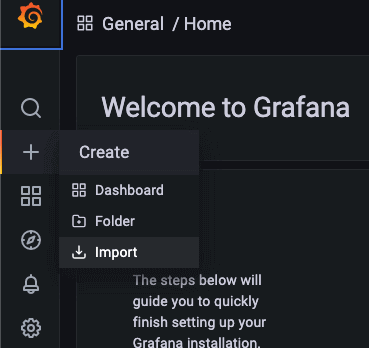
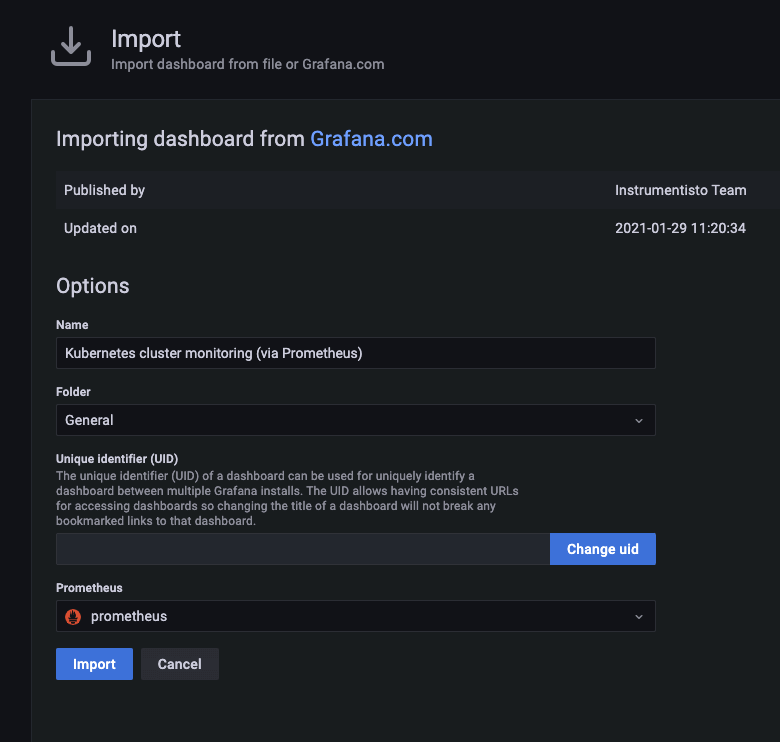
When Grafana imports the dashboard, it will automatically open it. The dashboard features high-level metrics about the total CPU and memory usage and detailed metrics about each specific container.
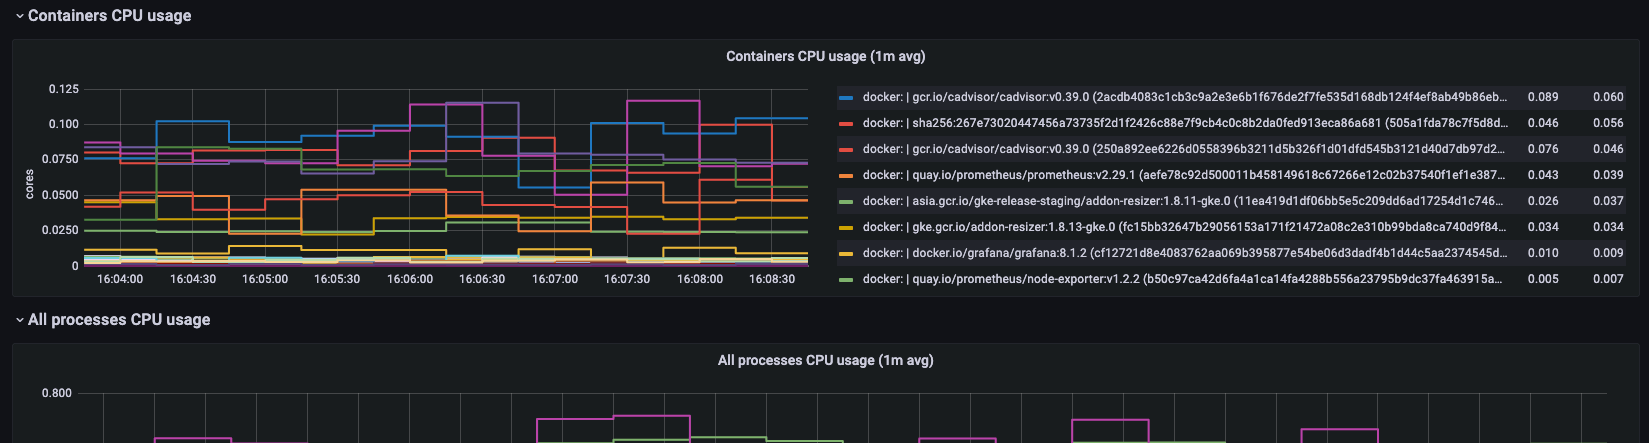
As the next step, you should familiarize yourself with the graphs and data displayed in Grafana and learn how to read them. Find which metrics and dashboards are valuable to you and your system.
Once you've decided that, you might want to set up the alerting. The Prometheus operator includes the Alert manager. You can use the alert manager and configure it to send alerts when specific metrics are not within the defined thresholds. For example, you could configure the system to send a notification to PagerDuty whenever the cluster memory or CPU usage is above a certain threshold.
此内容由惯性聚合(RSS阅读器)自动聚合整理,仅供阅读参考。 原文来自 — 版权归原作者所有。