











In this post, you will learn how to set up and deploy kwatch in your Kubernetes cluster to monitor and receive real-time crash alerts through PagerDuty.
kwatch helps you monitor all changes in your Kubernetes cluster. It detects crashes in real-time and publishes notifications to your favorite channels (Slack, Discord, PagerDuty, Telegram, Microsfot Teams and others) instantly.
To go through this tutorial, you'll need a free PagerDuty account and access to a Kubernetes cluster. To try this out, you can use minikube, kind or any other Kubernetes cluster.
We'll configure a new PagerDuty service through Events API. kwatch will use the events API endpoint and the integration key to send events to PagerDuty.
Follow these steps to configure the PagerDuty service:

PagerDuty dashboard
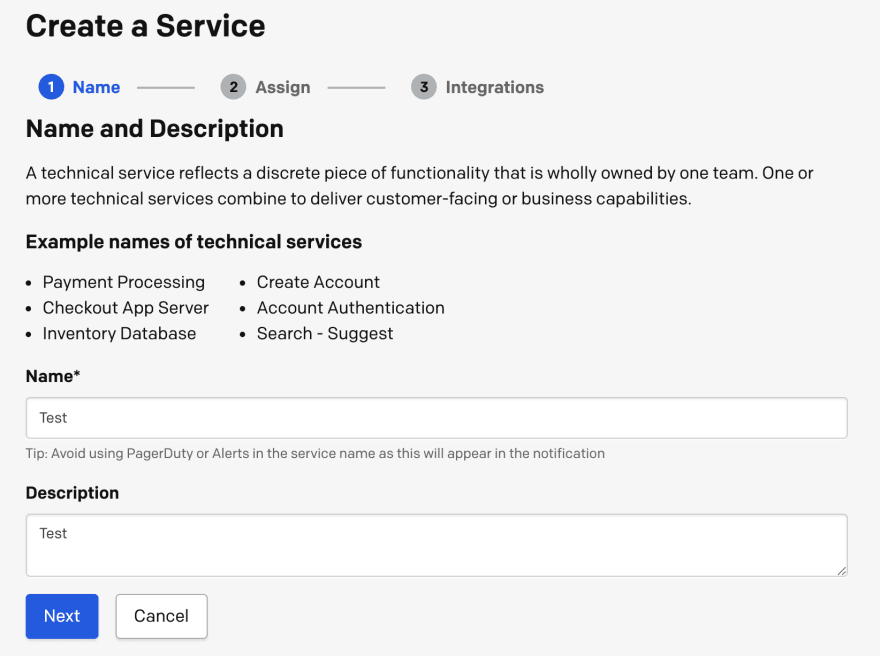
New service
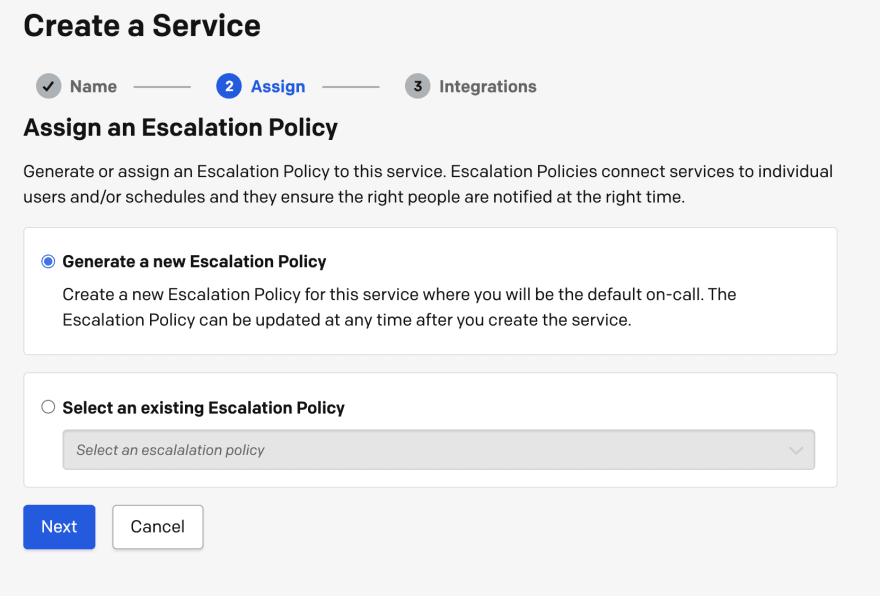
Using the escalation policy, you can connect services to individual users and/or schedules so correct people get notified in case of an escalation.
On the Alert Grouping page, we can leave the Intelligent option selected and click Next. The alert grouping allows you to combine similar alerts into a single incident to reduce notifications.
On the Integrations page, we'll select the Events API V2 integration by clicking on the check box.
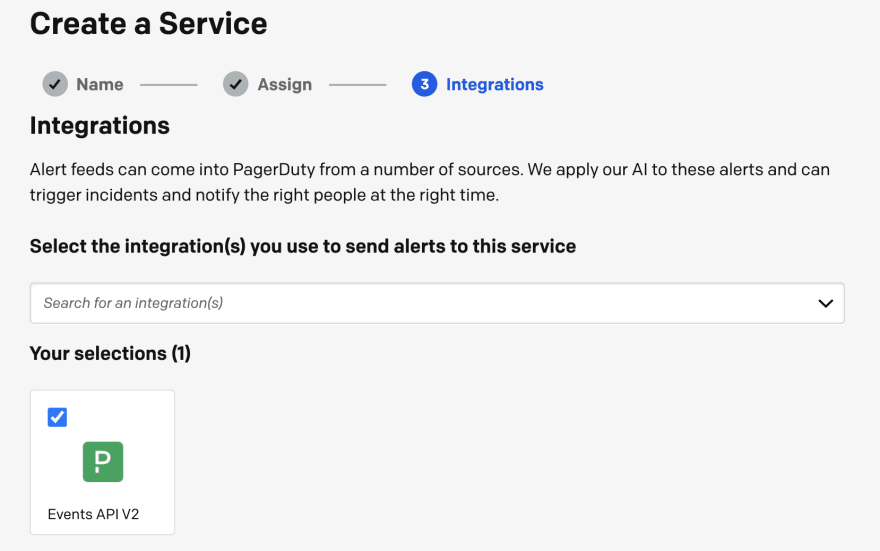
Events API V2 integration
Once the service has been created you'll be presented with the page that shows the integration key and the integration URLs as shown in the image below.
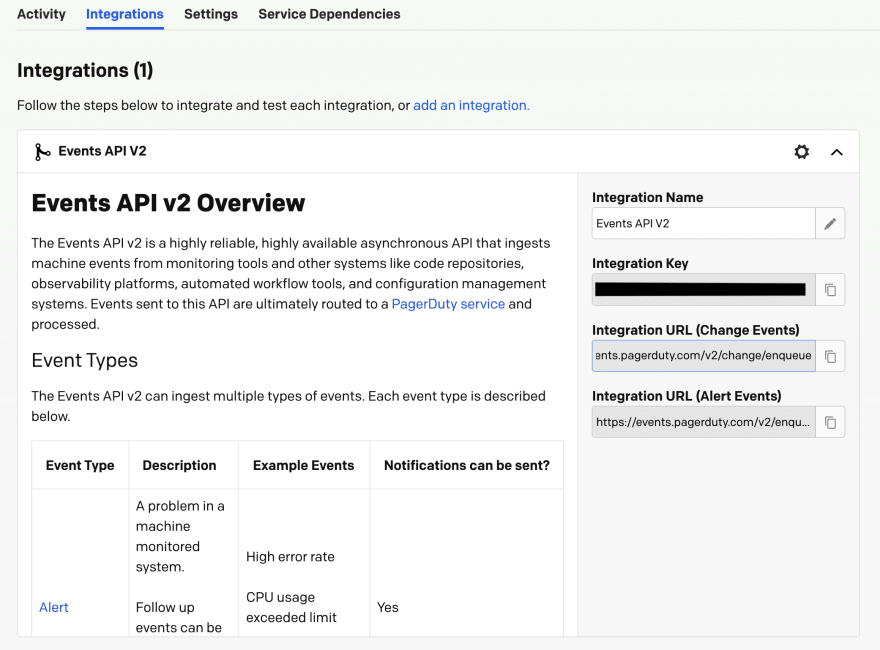
Events API V2 overview
We'll use the integration key to configure kwatch.
To configure kwatch we'll download a template ConfigMap and then configure it to use the PagerDuty integration key.
Let's start by obtaining the configuration template first:
curl -L https://raw.githubusercontent.com/abahmed/kwatch/v0.3.0/deploy/config.yaml -o config.yaml
We can now open the config.yaml and configure the PagerDuty key (remove the remaining fields). The config.yaml should look like this:
apiVersion: v1
kind: Namespace
metadata:
  name: kwatch
---
apiVersion: v1
kind: ConfigMap
metadata:
  name: kwatch
  namespace: kwatch
data:
  config.yaml: |
    alert:
      pagerduty:
        integrationKey: <INTEGRATION_KEY>
Make sure to replace the <INTEGRATION_KEY> with the actual integration key value from PagerDuty.
Assuming you have your Kubernetes cluster up and running, you can apply the above config file:
kubectl apply -f config.yaml
With the configuration in place, we can now deploy kwatch.
kubectl apply -f https://raw.githubusercontent.com/abahmed/kwatch/v0.3.0/deploy/deploy.yaml
You will now start receiving PagerDuty alerts whenever there is a pod crash in your Kubernetes cluster!
Let's try this out by creating a simple deployment (httpbin):
kubectl apply -f https://raw.githubusercontent.com/istio/istio/master/samples/httpbin/httpbin.yaml
Once the Pod is up and running, we can edit the deployment and change the image name to a non-existent image – this is just to force the Pod to crash by failing to pull the (non-existent) image.
We can run kubectl edit deploy httpbin and change the docker.io/kennethreitz/httpbin image name to BLAHdocker.io/kennethreitz/httpbin.
As expected, the Pod will fail, and if you look on your PagerDuty dashboard, you'll notice an open incident that contains the details about the failure.
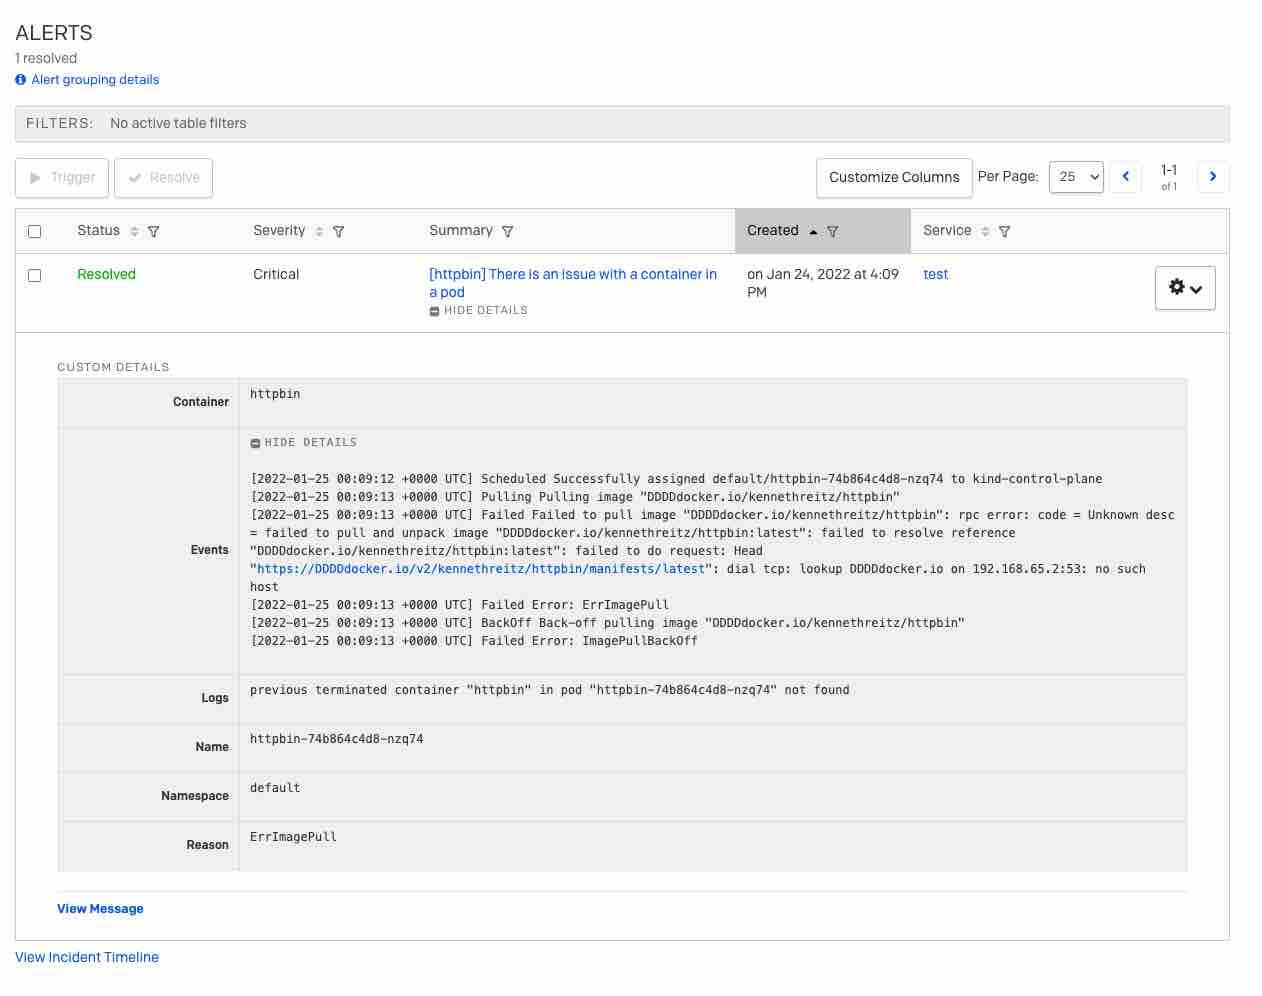
PagerDuty dashboard with an alert
In this blog post, we've introduced a way to use kwatch and PagerDuty to trigger alerts whenever a Pod fails.
We've used the most straightforward configuration to watch all namespaces in the Kubernetes cluster. We could also provide specific namespaces we want to monitor using the' namespaces' field.
In addition to PagerDuty, kwatch also offers integration with Slack, Telegram, Microsoft Teams, Rocket Chat, and Mattermost.
此内容由惯性聚合(RSS阅读器)自动聚合整理,仅供阅读参考。 原文来自 — 版权归原作者所有。