









Circuit breaking is an important pattern that can help with service resiliency. This pattern is used to prevent additional failures by controlling and managing access to the failing services.
The easiest way to explain circuit breakers is with a simple example using a frontend called Hello web and backends called Greeter service. Let's say the greeter service starts failing, and instead of call it continuously, we could detect the failures and either stop or reduce the number of requests made to the service. If we added a database to this example, you could quickly imagine how calling the service could put more stress on different parts of the system and potentially make everything even worse. This scenario is where the circuit breaker comes into play. We define the conditions when we want the circuit breaker to trip (for example, if we get more than 10 failures within a 5 second time period), once circuit breaker trips, we won't be making calls to the underlying service anymore, instead, we will just directly return the error from the circuit breaker. This way, we are preventing additional strain and damage to the system.
In Istio, circuit breakers get defined in the destination rule. Circuit breaker tracks the status of each host, and if any of those hosts start to fail, it will eject it from the pool. Practically speaking, if we have five instances of our pod running, the circuit breaker will eject any of the instances that misbehave, so that the calls won't be made to those hosts anymore. Ejection is controlled by the outlier detection and it can be configured by setting the following properties:
In addition to the outliers, we can also set the connection pool properties - such as the number of connections and requests per connection made to the service.
Let's look at an example for the greeter service:
apiVersion: networking.istio.io/v1alpha3
kind: DestinationRule
metadata:
  name: greeter-service
spec:
  host: greeter-service.default.svc.cluster.local
  trafficPolicy:
    connectionPool:
      http:
        http1MaxPendingRequests: 1
        maxRequestsPerConnection: 1
    outlierDetection:
      consecutiveErrors: 1
      interval: 1s
      baseEjectionTime: 10m
      maxEjectionPercent: 100
The above rule sets the maximum number of pending requests to the service (http1MaxPendingRequests) to a single request. This means if there is more than one request queued for connection, the circuit breaker will trip. Similarly, the circuit breaker trips if there is more than one request per connection (maxRequestsPerConnection setting).
Envoy uses outlier detection to detect when pods are not reliable and it can eject them from the load balancing pool for a period of time (baseEjectionTime setting). If the pod is ejected from the load balancing pool, no requests will be able to reach it. The second setting in play with the ejection is the maxEjectionPercent. This setting represents a threshold that, if reached, causes the circuit breaker to load balance across all pods again.
Let's try to explain this with an example where maxEjectionPercent is set to 50%. If pods are failing, circuit breaker keeps ejecting them from the load balancing pool. With failing pods ejected from the load balancing pool, only healthy pods receive traffic
At some point, even the healthy pods start failing and once the 50% threshold is reached, circuit breaker reverts back to the original load balancing logic and starts load balancing across all pods again (both healthy and failing ones). This setting is used in case of severe outages, so you can start dropping some requests, instead of exhausting the fewer healthy pods that are still available.
The decision to eject a pod or not is controlled by the consecutiveErrors setting. In the above example, if there's more than 1 error (an HTTP 5xx is considered an error), the pod gets ejected from the load balancing pool. Finally, the interval is a time interval between checking if new pods need to be ejected or brought back into the load balancing pool.
Let's deploy the destination rule that configures a simple circuit breaker:
cat <<EOF | kubectl apply -f -
apiVersion: networking.istio.io/v1alpha3
kind: DestinationRule
metadata:
  name: greeter-service
spec:
  host: greeter-service
  trafficPolicy:
    connectionPool:
      http:
        http1MaxPendingRequests: 1
        maxRequestsPerConnection: 1
    outlierDetection:
      consecutiveErrors: 1
      interval: 1s
      baseEjectionTime: 10m
      maxEjectionPercent: 100
EOF
To demonstrate the circuit breaking we will use the load-testing library called Fortio. With Fortio we can easily control the number of connection, concurrency, and delays of the outgoing HTTP calls. Let's deploy Fortio:
cat <<EOF | kubectl create -f -
apiVersion: v1
kind: Service
metadata:
  name: fortio
  labels:
    app: fortio
spec:
  ports:
    - port: 8080
      name: http
  selector:
    app: fortio
---
apiVersion: apps/v1
kind: Deployment
metadata:
  name: fortio-deploy
spec:
  replicas: 1
  selector:
    matchLabels:
      app: fortio
  template:
    metadata:
      annotations:
        sidecar.istio.io/statsInclusionPrefixes: cluster.outbound,cluster_manager,listener_manager,http_mixer_filter,tcp_mixer_filter,server,cluster.xds-grpc
      labels:
        app: fortio
    spec:
      containers:
        - name: fortio
          image: fortio/fortio:latest_release
          imagePullPolicy: Always
          ports:
            - containerPort: 8080
              name: http-fortio
            - containerPort: 8079
              name: grpc-ping
EOF
Next, we will deploy the greeter service:
cat <<EOF | kubectl create -f -
apiVersion: apps/v1
kind: Deployment
metadata:
  name: greeter-service-v1
  labels:
    app: greeter-service
    version: v1
spec:
  replicas: 1
  selector:
    matchLabels:
      app: greeter-service
      version: v1
  template:
    metadata:
      labels:
        app: greeter-service
        version: v1
    spec:
      containers:
        - image: learnistio/greeter-service:1.0.0
          imagePullPolicy: Always
          name: svc
          ports:
            - containerPort: 3000
---
kind: Service
apiVersion: v1
metadata:
  name: greeter-service
  labels:
    app: greeter-service
spec:
  selector:
    app: greeter-service
  ports:
    - port: 3000
      name: http
EOF
Finally, let's make a simple call from the Fortio pod to the greeter service:
export FORTIO_POD=$(kubectl get pod | grep fortio | awk '{ print $1 }')
kubectl exec -it $FORTIO_POD  -c fortio /usr/bin/fortio -- load -curl  http://greeter-service:3000/hello


HTTP/1.1 200 OK
x-powered-by: Express
content-type: application/json; charset=utf-8
content-length: 43
etag: W/"2b-DdO+hdtaORahq7JZ8niOkjoR0XQ"
date: Fri, 04 Jan 2019 00:53:19 GMT
x-envoy-upstream-service-time: 7
server: envoy

{"message":"hello 👋 ","version":"1.0.0"}
With the above command, we are just making one call to the greeter service, and it all works, we get the response back. Let's try to trip the circuit breaker now.
You can use Fortio to make 20 requests with 2 concurrent connections like this:
kubectl exec -it $FORTIO_POD -c fortio /usr/bin/fortio -- load -c 2 -qps 0 -n 20 -loglevel Warning http://greeter-service:3000/hello
In the output, you will notice the following lines:
...
Code 200 : 19 (95.0 %)
Code 503 : 1 (5.0 %)
This result is telling you that all 19 requests succeeded and 5% of them failed. Let's increase the number of concurrent connections to 3:
kubectl exec -it $FORTIO_POD -c fortio /usr/bin/fortio -- load -c 3 -qps 0 -n 50 -loglevel Warning http://greeter-service:3000/hello
Now are getting more failures:
...
Code 200 : 41 (82.0 %)
Code 503 : 9 (18.0 %)
This is telling us that 82% of requests succeded, and the rest was caught by the circuit breaker. Another way to see the calls that we trapped by the circuit breaker is to query the Istio proxy stats:
$ kubectl exec -it $FORTIO_POD  -c istio-proxy  -- sh -c 'curl localhost:15000/stats' | grep greeter-service | grep pending
cluster.outbound|3000||greeter-service.default.svc.cluster.local.upstream_rq_pending_active: 0
cluster.outbound|3000||greeter-service.default.svc.cluster.local.upstream_rq_pending_failure_eject: 107
cluster.outbound|3000||greeter-service.default.svc.cluster.local.upstream_rq_pending_overflow: 9
cluster.outbound|3000||greeter-service.default.svc.cluster.local.upstream_rq_pending_total: 2193
The above stats are showing that 9 calls have been flagged for circuit breaking (which equals the number of failed requests we had with Fortio).
Similarly, you can also check the metrics from Prometheus. You can launch Prometheus with:
istioctl dashboard prometheus
From the Prometheus dashboard, use the following query to get a sum of all requests that went to the greeter-service and group them by response code, flags, and source app:
sum(istio_requests_total{destination_app="greeter-service}) by (response_code, response_flags, source_app)
You should see a result similar to the figure below:
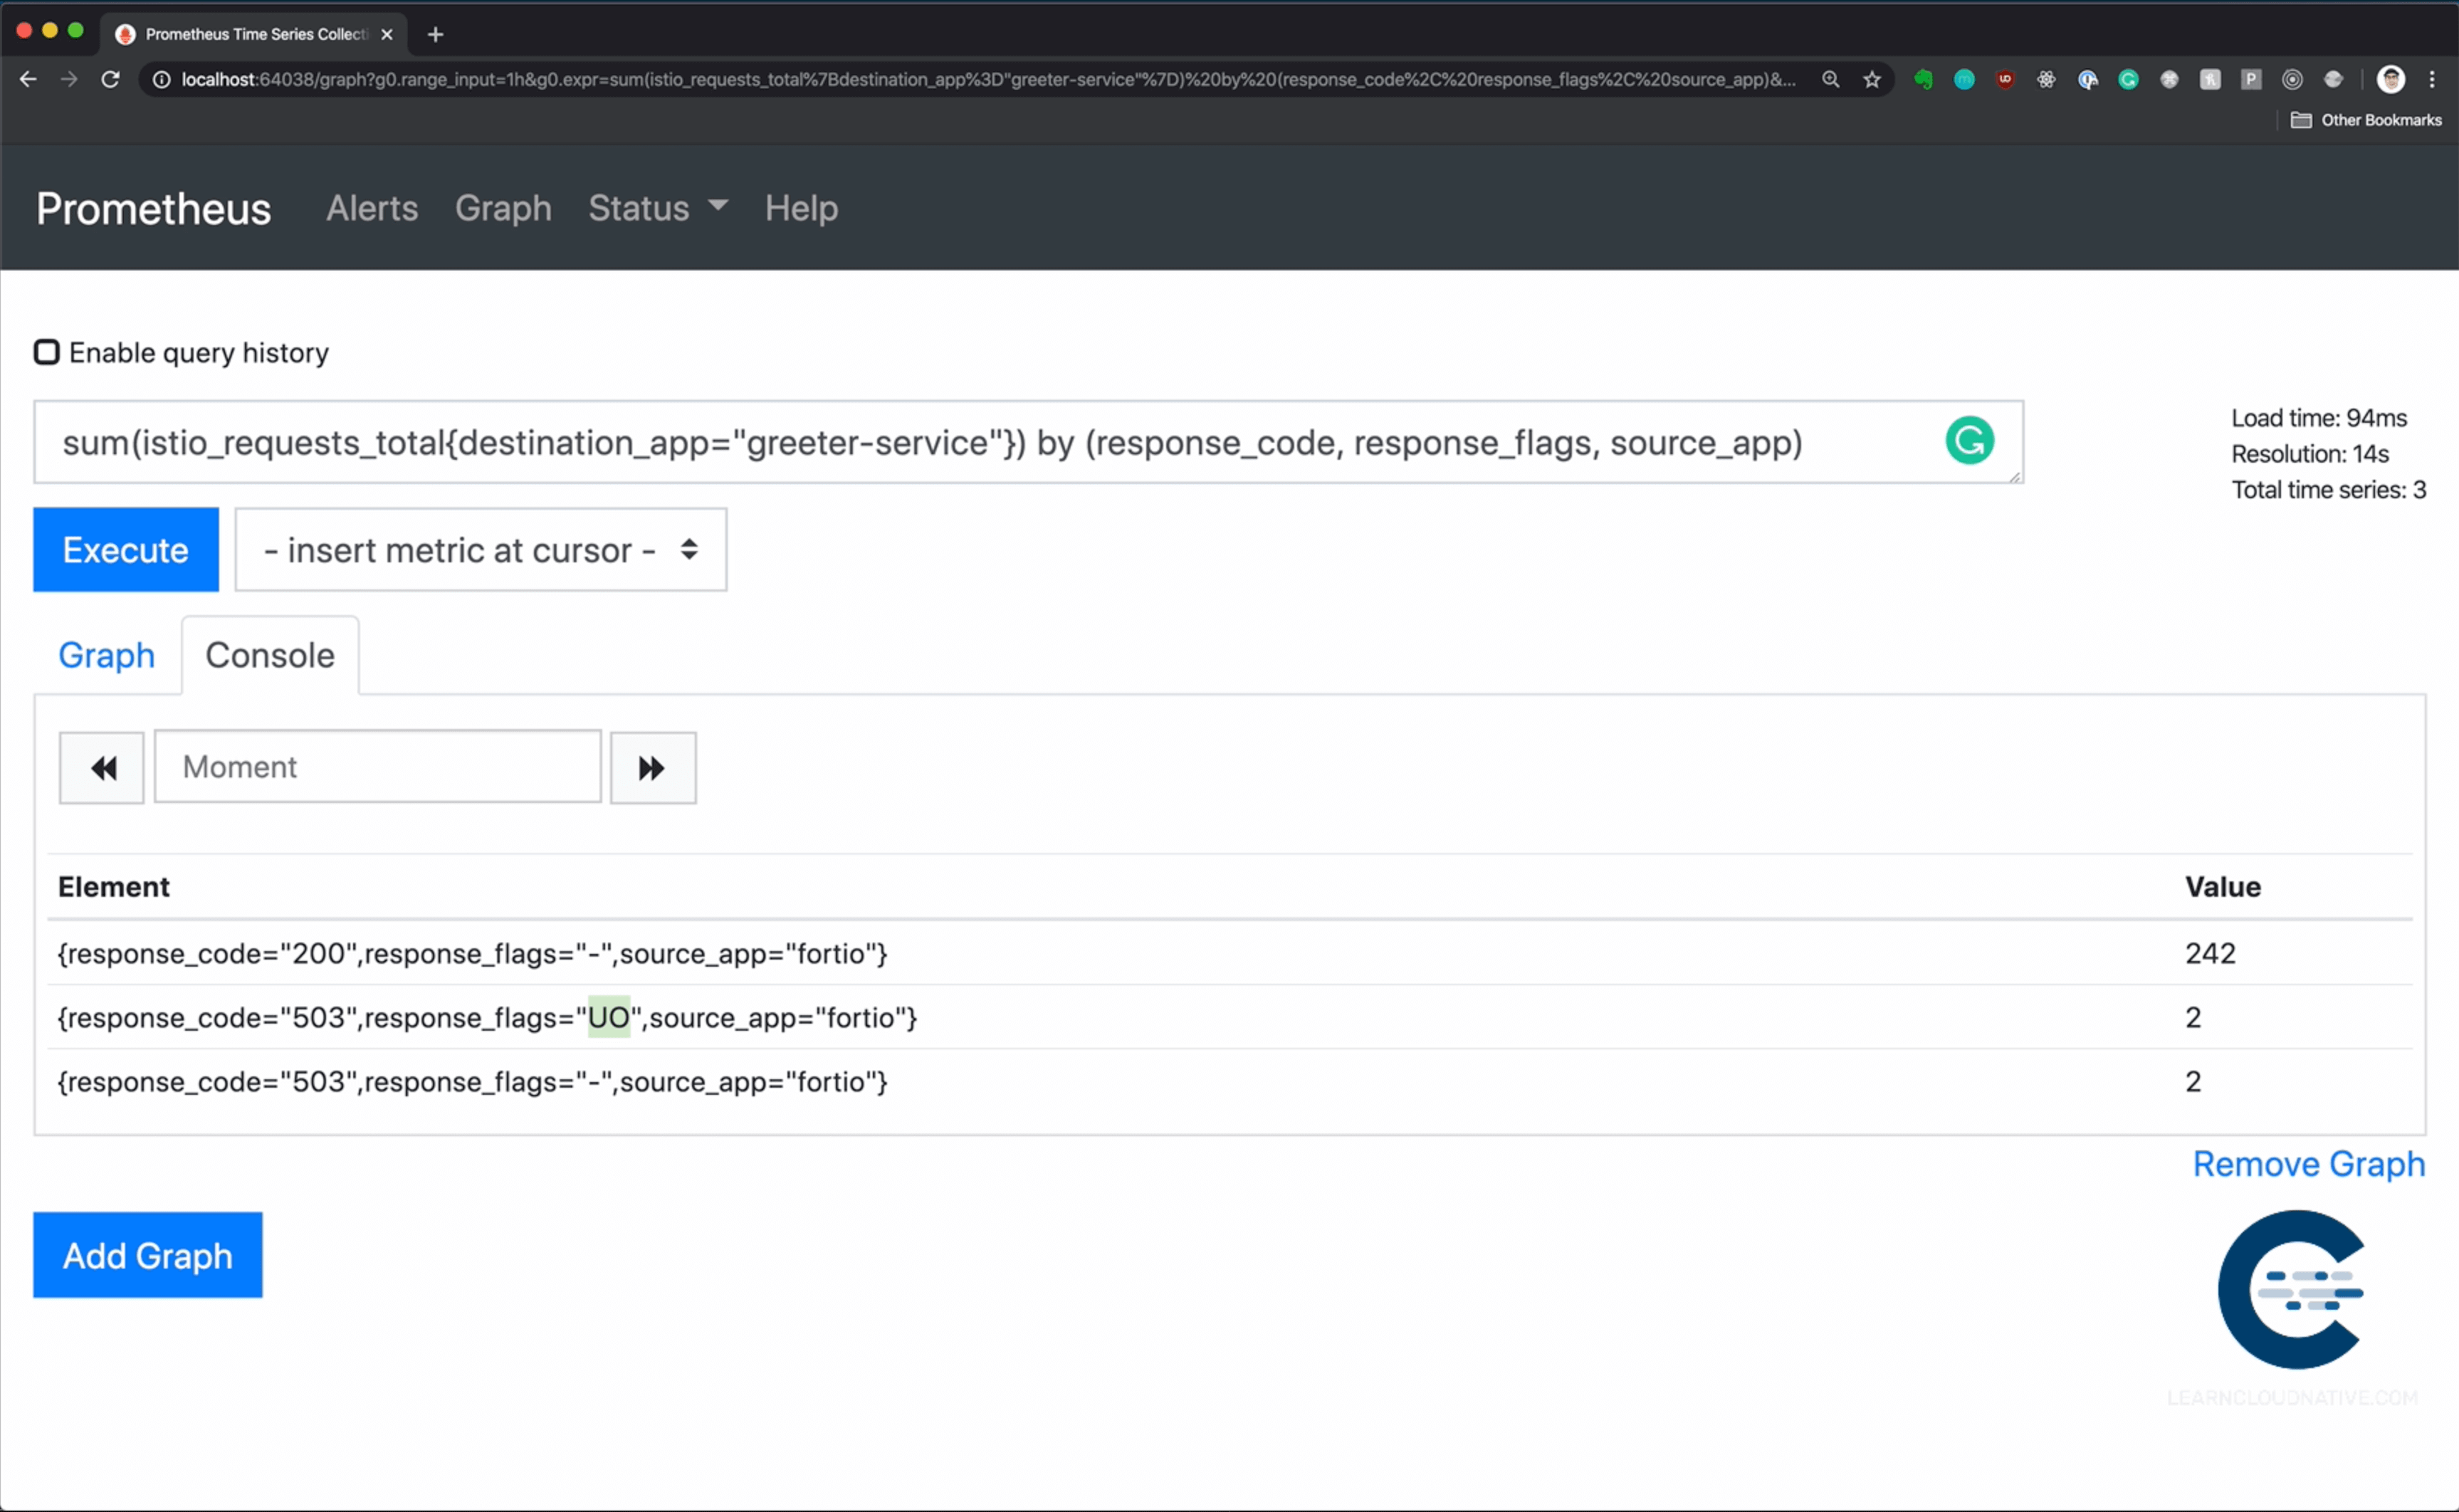
The response flag you are looking for is UO. If you look up this from the Envoy documentation, the code UO stands for upstream overflow - circuit breaker.
此内容由惯性聚合(RSS阅读器)自动聚合整理,仅供阅读参考。 原文来自 — 版权归原作者所有。