



Developers typically need to look at performance bottlenecks in production applications to determine the cause of the problem. You can collect this information through logs and code tools. Unfortunately, this approach is typically time-consuming and does not provide enough details about the underlying problem.
A modern and more advanced approach is to apply and use profiling techniques and tools that highlight the slowest application code, that is, the area consuming most of your resources.
In this blog post, we will discuss continuous profiling and then instrument a couple of microservices running on Kubernetes using an open-source tool called Pyroscope.
Code must be analyzed, debugged, and reviewed to determine the most effective way to make it run faster. Using a profiling tool to examine an application's code helps us locate and fix performance bottlenecks. We can quickly diagnose how an application performs and enable programmers to get down to core details of poor performance using these tools. The result is a streamlined codebase that decreases CPU/memory consumption and improves the user experience!
Profiling is a program analysis that measures the memory, time complexity, or the frequency and duration of function calls. Profiler programs can track each line of code. Profiling information serves to aid program optimization and performance.
Continuous Profilers are used to make troubleshooting even faster and easier. Continuous Profilers are production code profilers that allow you to analyze code-level performance across your environment over time. As profiles are collected continuously, they can reveal the most resource-intensive features (or lines of code) quickly after new code is introduced. Optimization can reduce end-user delays and cloud provider accounts.
Here's a list of some of the profilers you may have come across:
Pyroscope is an open-source platform consisting of a server and an agent. It allows the user to collect, store, and query the profiling data in a CPU and storage-efficient way.
Parca collects, stores, and makes profiles available to be queried over time. It is open source and can be deployed on production environments as Parca focuses on sampling profiling two main types of profiles: tracing and sampling.
Datadog Continuous Profiler analyzes and compares code performance all the time and in any environment, including production. It pinpoints the hard-to-replicate production issues caused by inefficient code. It also has automated code profiling insights.
Cloud Profiler is a statistical, low-overhead profiler that continuously gathers CPU usage and memory-allocation information from your production applications. It has Actionable application profiling, Low-impact production Profilin, and Broad Platform support.
Before we start exploring Pyroscope, let's see how it is different from a few of the other continuous profiling tools available in the market. DataDog and Google Cloud Profiler are widely used in the industry. As pointed out by one of the Reddit users, below are some of the reasons why Pyroscope is better compared to the other two.
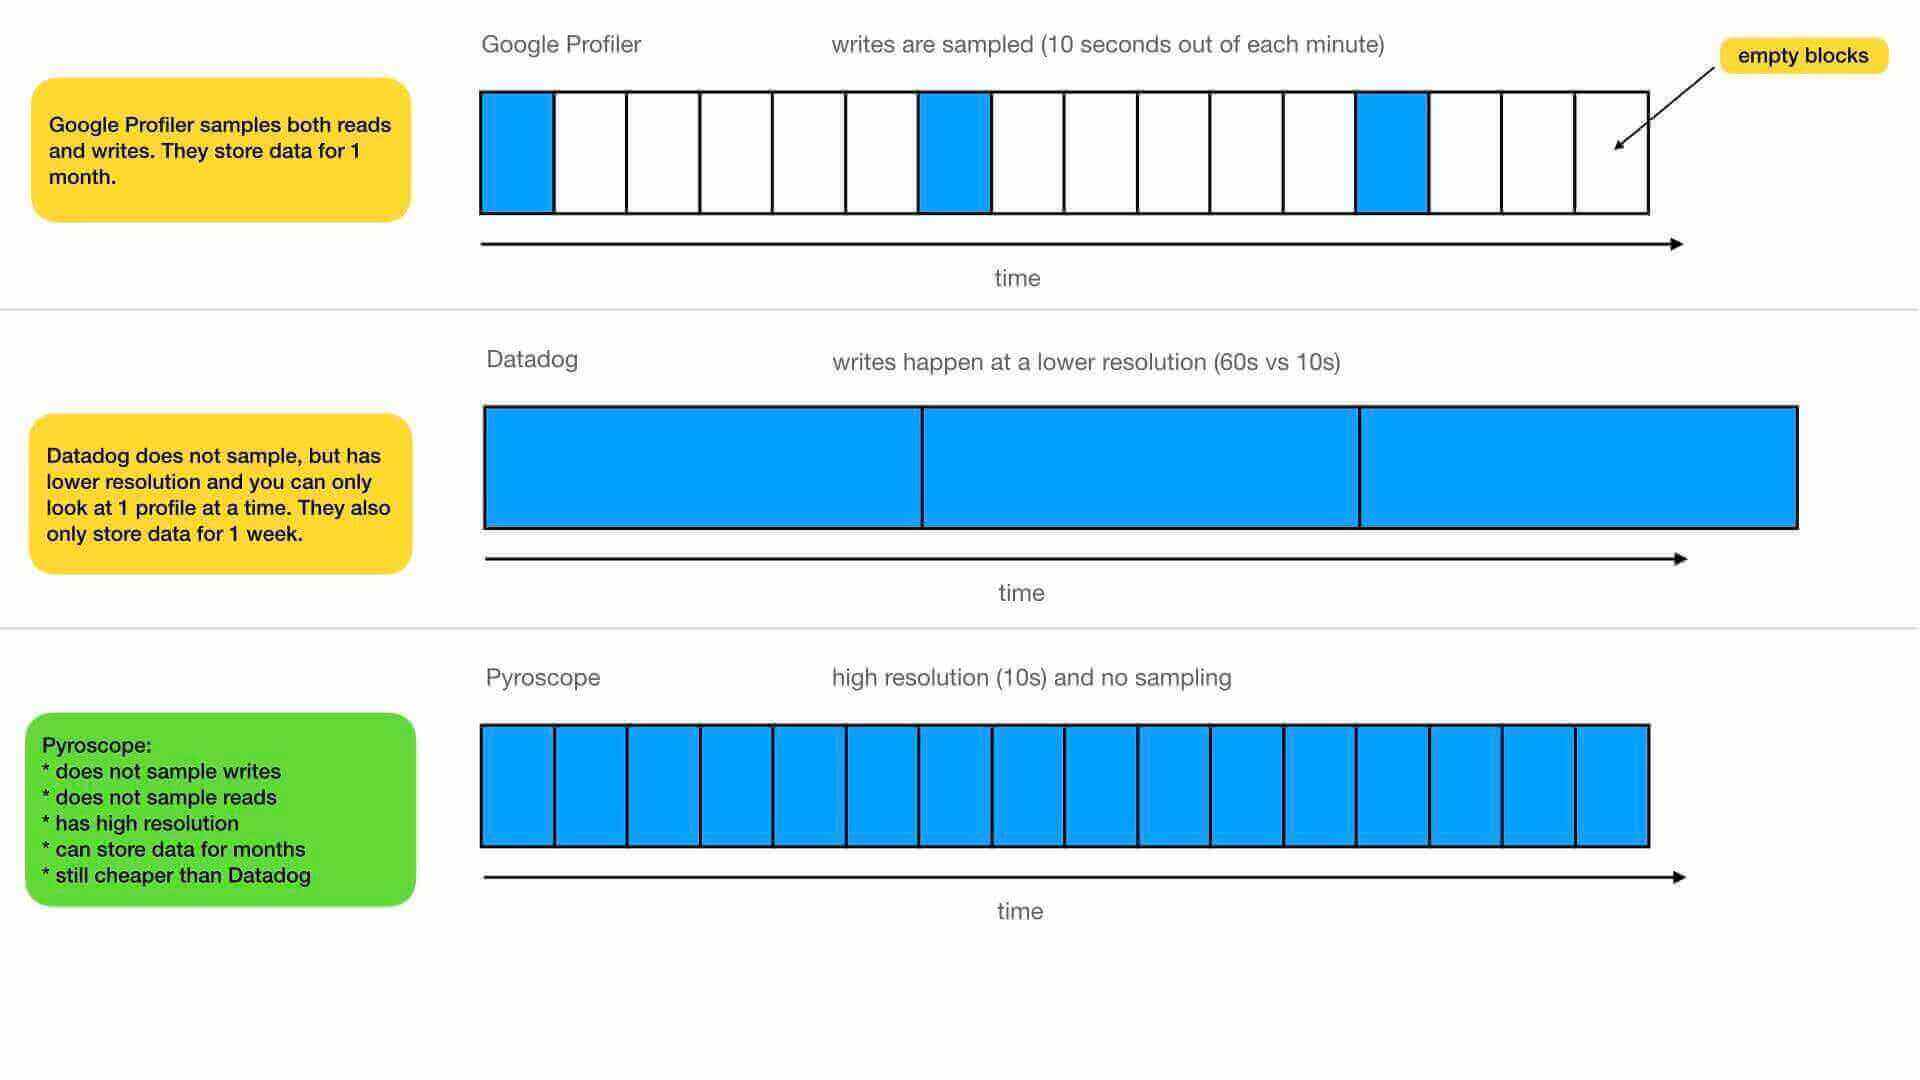
Pyroscope focuses on building a storage engine constructed specifically for profiling data to store and query that data as efficiently as possible. It uses an agent-server model to send the profiles from applications to the Pyroscope server:
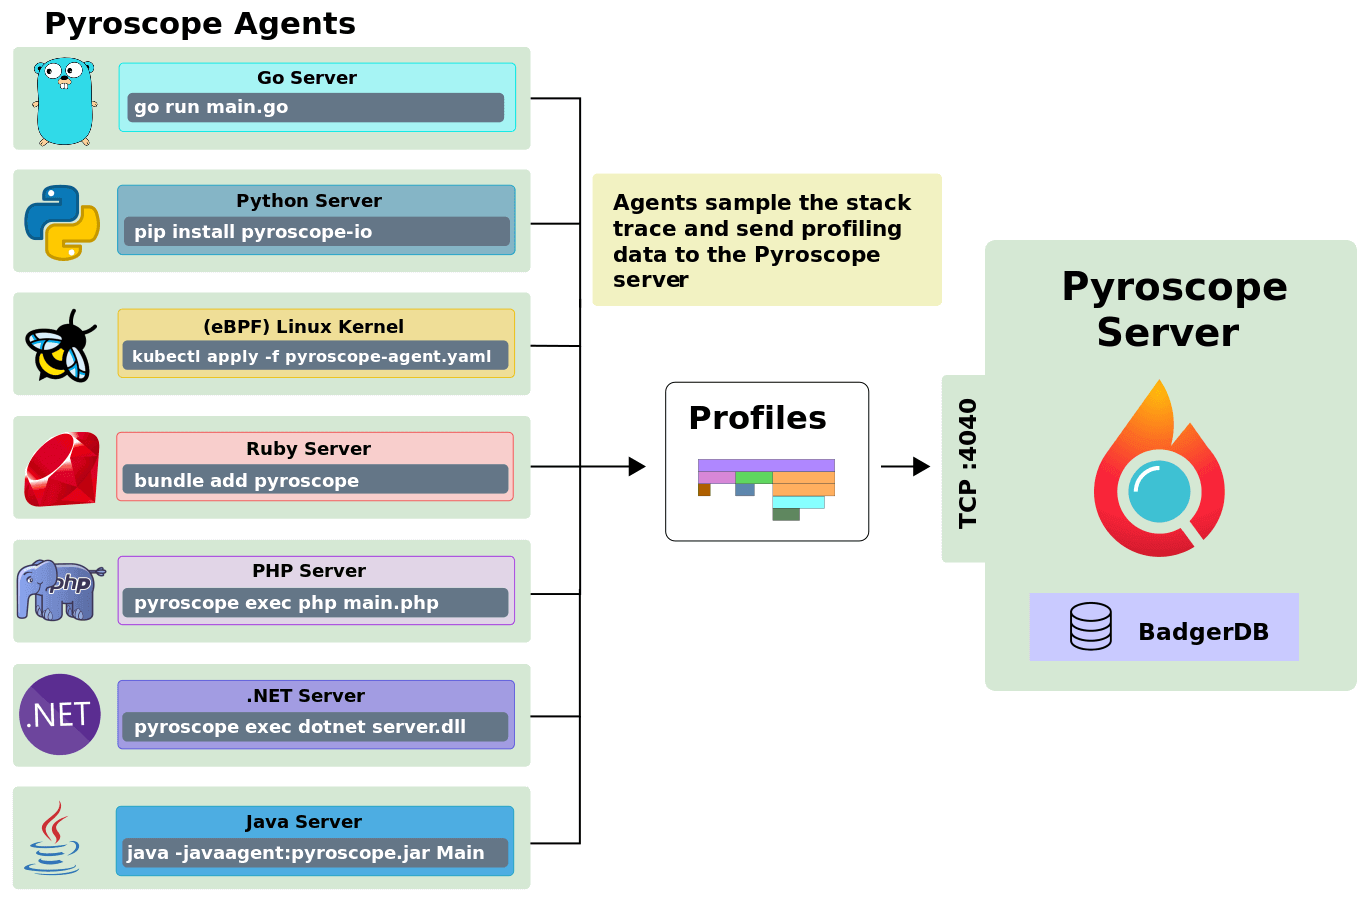
Pyroscope allows profilers from any language to send data to it and efficiently store that data by the storage engine. For example, Pyroscope has language-specific agents for Go, Python, Ruby, eBPF, Java, .NET, PHP, and Rust.
Theoretically, since all these languages eventually compile down and run on the kernel, eBPF should work for any of these languages. However, in practice, if you run eBPF for interpreted languages like Python, function names are unreadable for humans in many cases. This is because symbols are not stored in those languages.
For this reason, Pyroscope supports both language-specific profilers and eBPF profiling. This support comes at the expense of slightly more work integrating language-specific agents than eBPF, which can run at the kernel level. But it also comes with the benefit of having much more actionable and human-readable profiles.
Note
You can start the server followed by the agent no matter what you use, Docker, Linux, or are looking for Ruby or Go docs, Pyroscope covers you. Their custom-designed storage engine makes fast queries even if you aim for ten seconds or ten months of software profiling data. — Pyroscope website
We will use minikube for running a Kubernetes cluster. Create a cluster using minikube:
Add the Helm chart repo:
$ helm repo add pyroscope-io https://pyroscope-io.github.io/helm-chart
"pyroscope-io" has been added to your repositories
Install Helm chart:
helm install pyroscope pyroscope-io/pyroscope --set service.type=NodePort
To check Pyroscope Helm chart installed successfully:
$ helm list
NAME        NAMESPACE   REVISION  UPDATED                                  STATUS    CHART             APP VERSION
pyroscope   default     1         2022-01-13 20:04:47.905124435 +0000 UTC  deployed  pyroscope-0.2.28  0.7.0
Check if Pyroscope Pod is running in the default namespace:
$ kubectl get pods
NAME                        READY   STATUS    RESTARTS   AGE
pyroscope-f5dc8c4bf-qt5jz   1/1     Running   0          83s
Now we have Pyroscope running in our Kubernetes cluster; we will proceed with using the application with it. We will be using Google microservices for this demo.
We will modify our container images to use pyroscope binary. This binary will start our application and inject itself to monitor. You can refer more in this Pyroscope document.
git clone https://github.com/GoogleCloudPlatform/microservices-demo
We will be working on Python, Go, and .NET microservice from the Google microservices repository.
To build and use the container images in minikube, run:
eval $(minikube docker-env)
If you exit or close your terminal window, you will have to re-run the above command. With that command, we're pointing the Docker CLI to the Docker engine inside Minikube. If you are not using Minikube, then you can skip this command.
We'll be working inside the src folder to change the Dockerfiles and code.
Note
Note: You can run the prebuild Docker images by beellzrocks, and jump directly to the Obtaining the profiling data from microservices.
We will make changes to the Email Service microservice written in Python. To modify the Python application and use Pyroscope, we must change the Dockerfile.
Open the Dockerfile in the microservices-demo/src/emailservice folder and add the following lines to it:
COPY --from=pyroscope/pyroscope:latest /usr/bin/pyroscope /usr/bin/pyroscope
CMD [ "pyroscope", "exec", "python", "email_server.py" ]
After editing the Dockerfile we have to rebuild the image and push it to a Docker registry.
docker build . -t <yourRepository/emailservice:version>
docker push <yourRepository/emailservice:version>
Like we updated the Dockerfile for the email service, we'll do the same to the Cart Service.
Open the Dockerfile in the microservices-demo/src/cartservice folder and add the following lines to it:
COPY --from=pyroscope/pyroscope:latest /usr/bin/pyroscope /usr/bin/pyroscope
ENTRYPOINT ["pyroscope", "exec", "-spy-name", "dotnetspy", "/app/cartservice"]
After editing the Dockerfile, we have to rebuild the image and push it to a Docker registry.
docker build . -t <yourRepository/cartservice:version>
docker push <yourRepository/cartservice:version>
We will take the Product Catalog Service application written in Go and make changes to the server.go file.
Open the server.go file in the microservices-demo/src/productcatalogservice folder and add the following code to start Pyroscope:
import (
  pyroscope "github.com/pyroscope-io/pyroscope/pkg/agent/profiler"
)

func main() {
  pyroscope.Start(pyroscope.Config{
    ApplicationName: os.Getenv("APPLICATION_NAME"),
    ServerAddress:   os.Getenv("SERVER_ADDRESS"),
  })
  // Rest of the code here
)
After you've edited the server.go, proceed with building and pushing the Docker image.
docker build . -t <yourRepository/productcatalogservice:version>
docker push <yourRepository/productcatalogservice:version>
Next, we will modify the Kubernetes manifests to use the Pyroscope images.
The release folder contains the kubernetes-manifests.yaml file with resource definitions for all applications. Edit the file and update the image name to use the images we built in the previous steps. Make sure you update all images, i.e. emailservice, cartservice, productcatalogservice.
If you haven't built your images, use the images from the beellzrocks repository. For example:
---
containers:
  - name: server
    image: beellzrocks/emailservice # Change image repository if you built your image
Additionally, we have to make the following changes:
SYS_PTRACE capability---
containers:
- name: server
env:
- name: PYROSCOPE_SERVER_ADDRESS # To change Pyroscope Server Port change the value
value: 'http://pyroscope:4040'
- name: PYROSCOPE_APPLICATION_NAME # Application name shown in the UI
value: 'email.service'
securityContext:
capabilities:
add:
- SYS_PTRACE
Once you've updated the container image names, proceed with applying the config:
kubectl apply -f release/kubernetes-manifests.yaml
To get the service URL for Pyroscope, run:
$ minikube service pyroscope

|-----------|-----------|-------------|---------------------------|
| NAMESPACE |   NAME    | TARGET PORT |            URL            |
|-----------|-----------|-------------|---------------------------|
| default   | pyroscope | http/4040   | http://192.168.49.2:30639 |
|-----------|-----------|-------------|---------------------------|
🎉  Opening service default/pyroscope in default browser
You can now open the Pyroscope UI by going to the URL: http://192.168.49.2:30639 (note that your URL will be different).
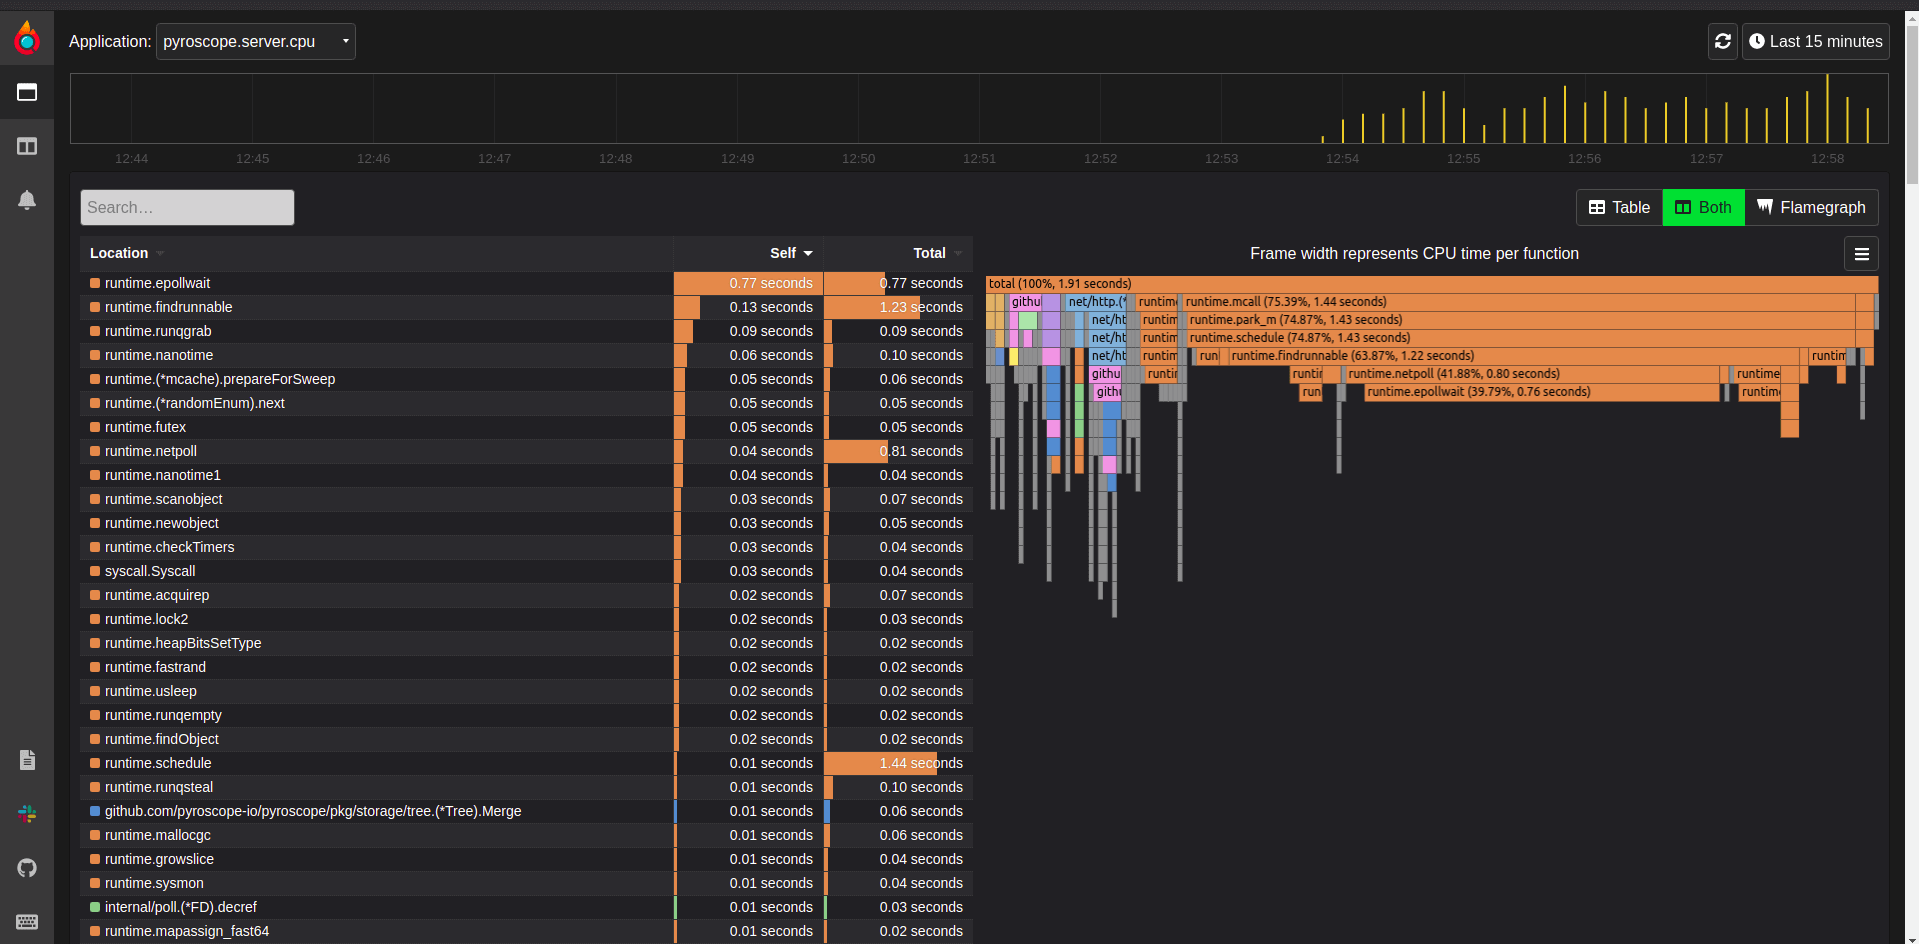
As you can see in the above screenshot, Pyroscope doesn't use a lot of CPU while storing the data locally. It uses Badger database to store data locally.
Monitoring Kubernetes pods is also crucial in the context of resource usage, utilization, and cost control. Pyroscope uses low resources with low overhead.
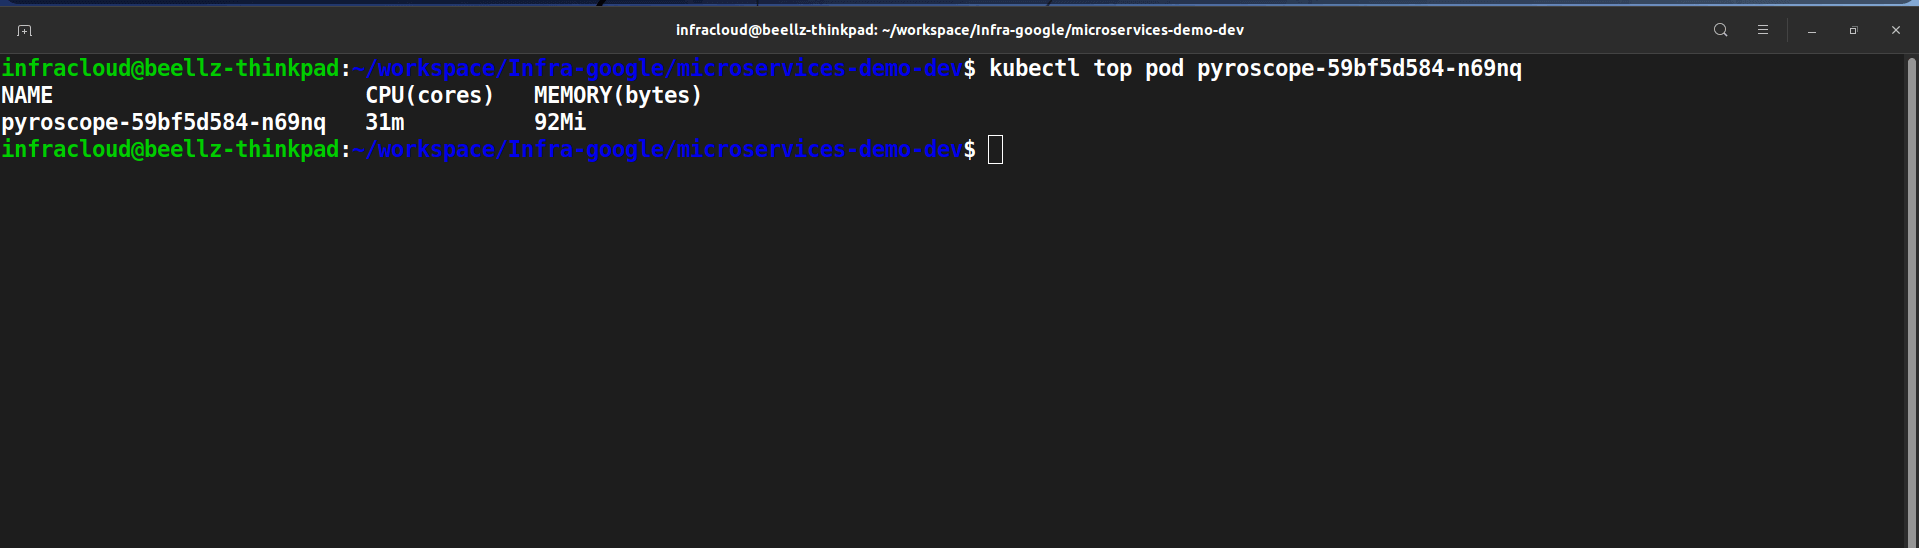
Pyroscope profiles the code using different agents depending upon the programming language. Here are some examples of the profiled application's flame graph using Pyroscope.
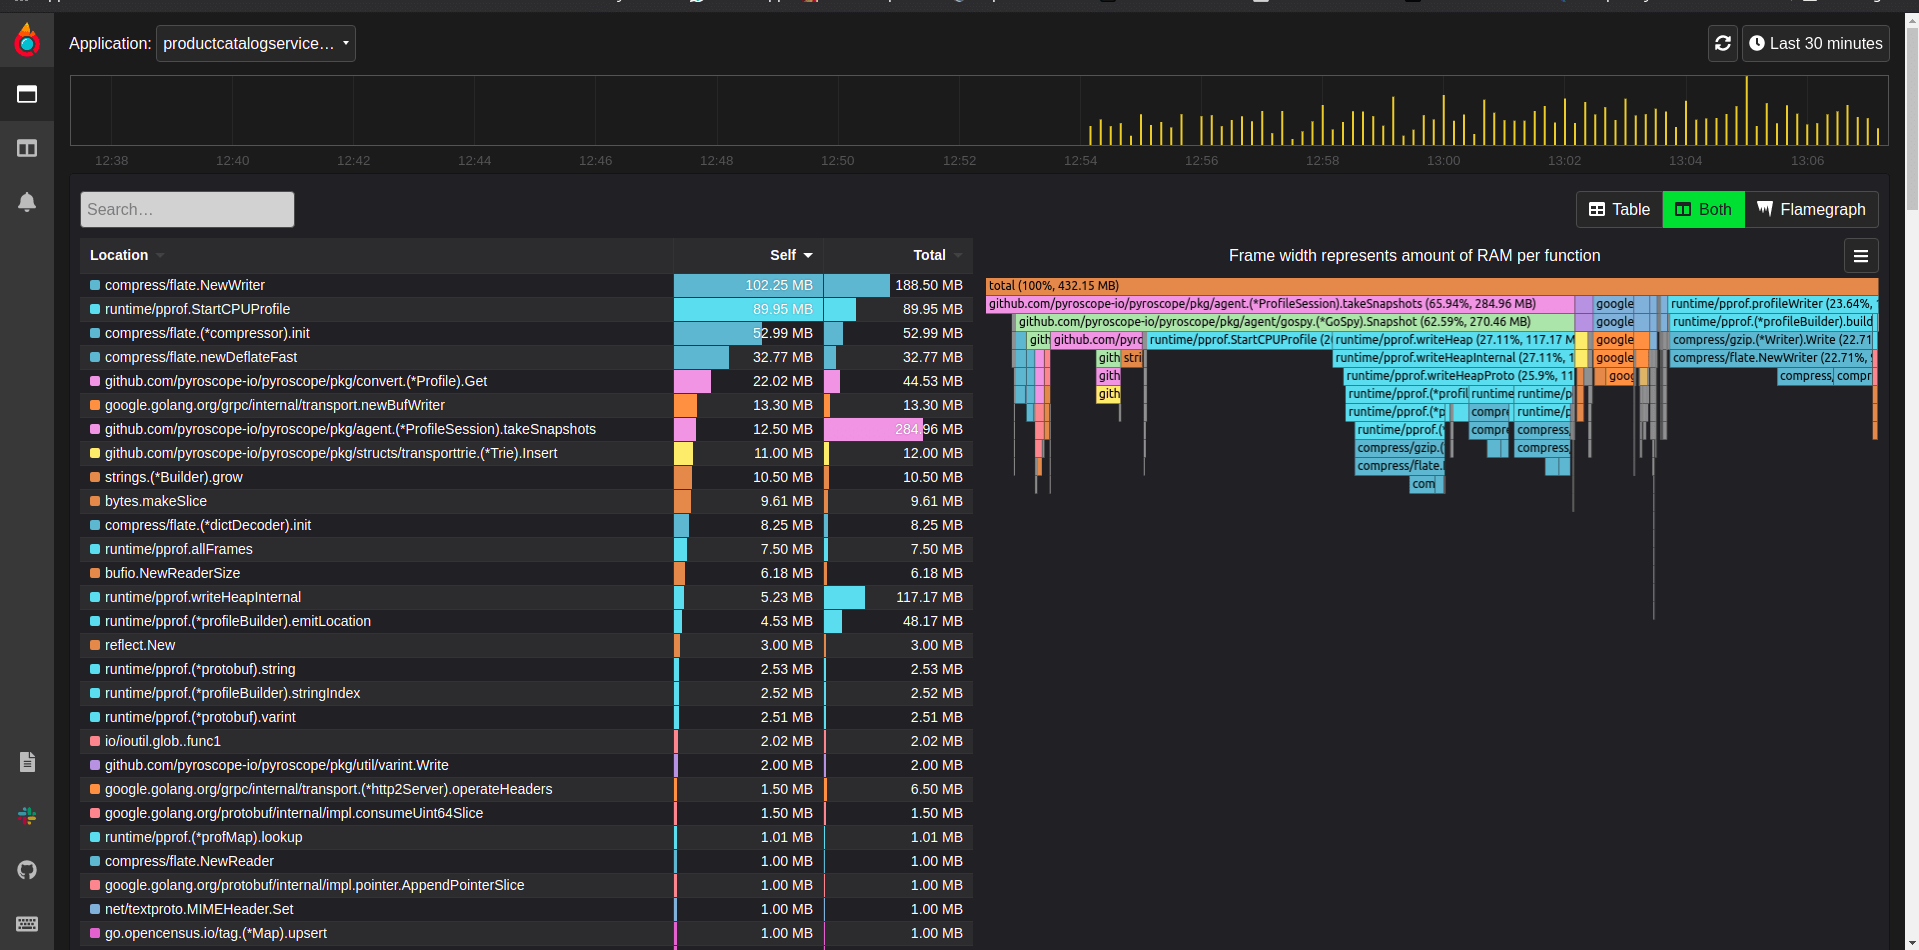
Pyroscope with Go Product Catalog Service application
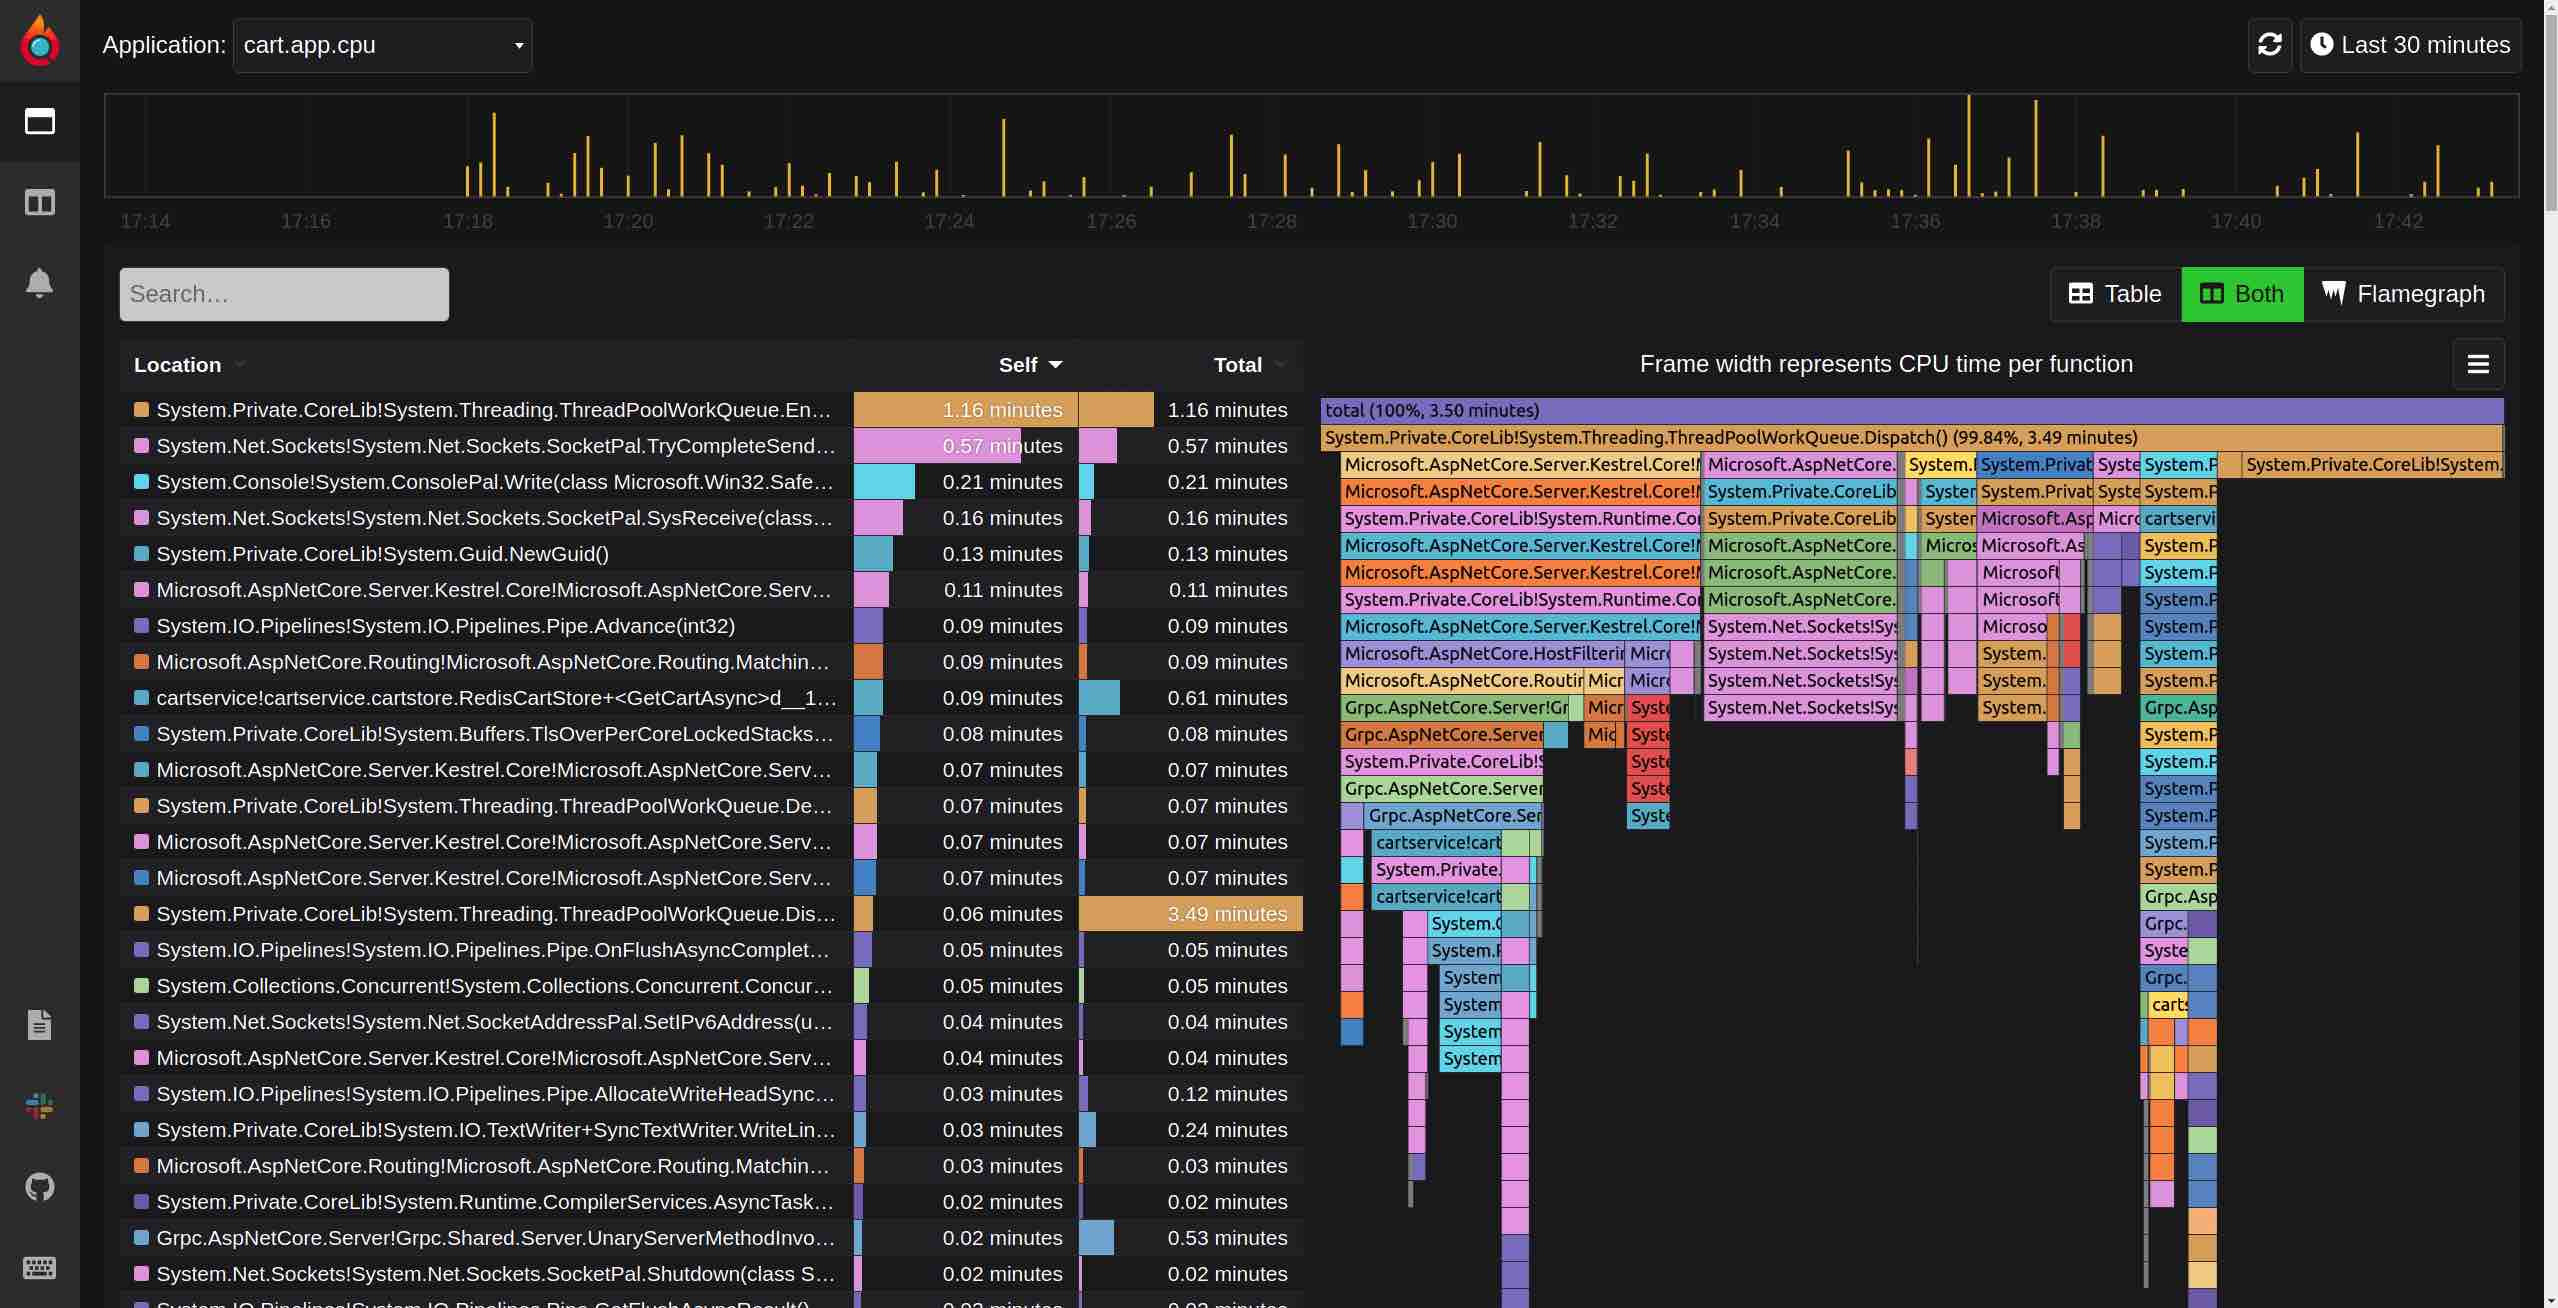
Pyroscope with .Net Cart application
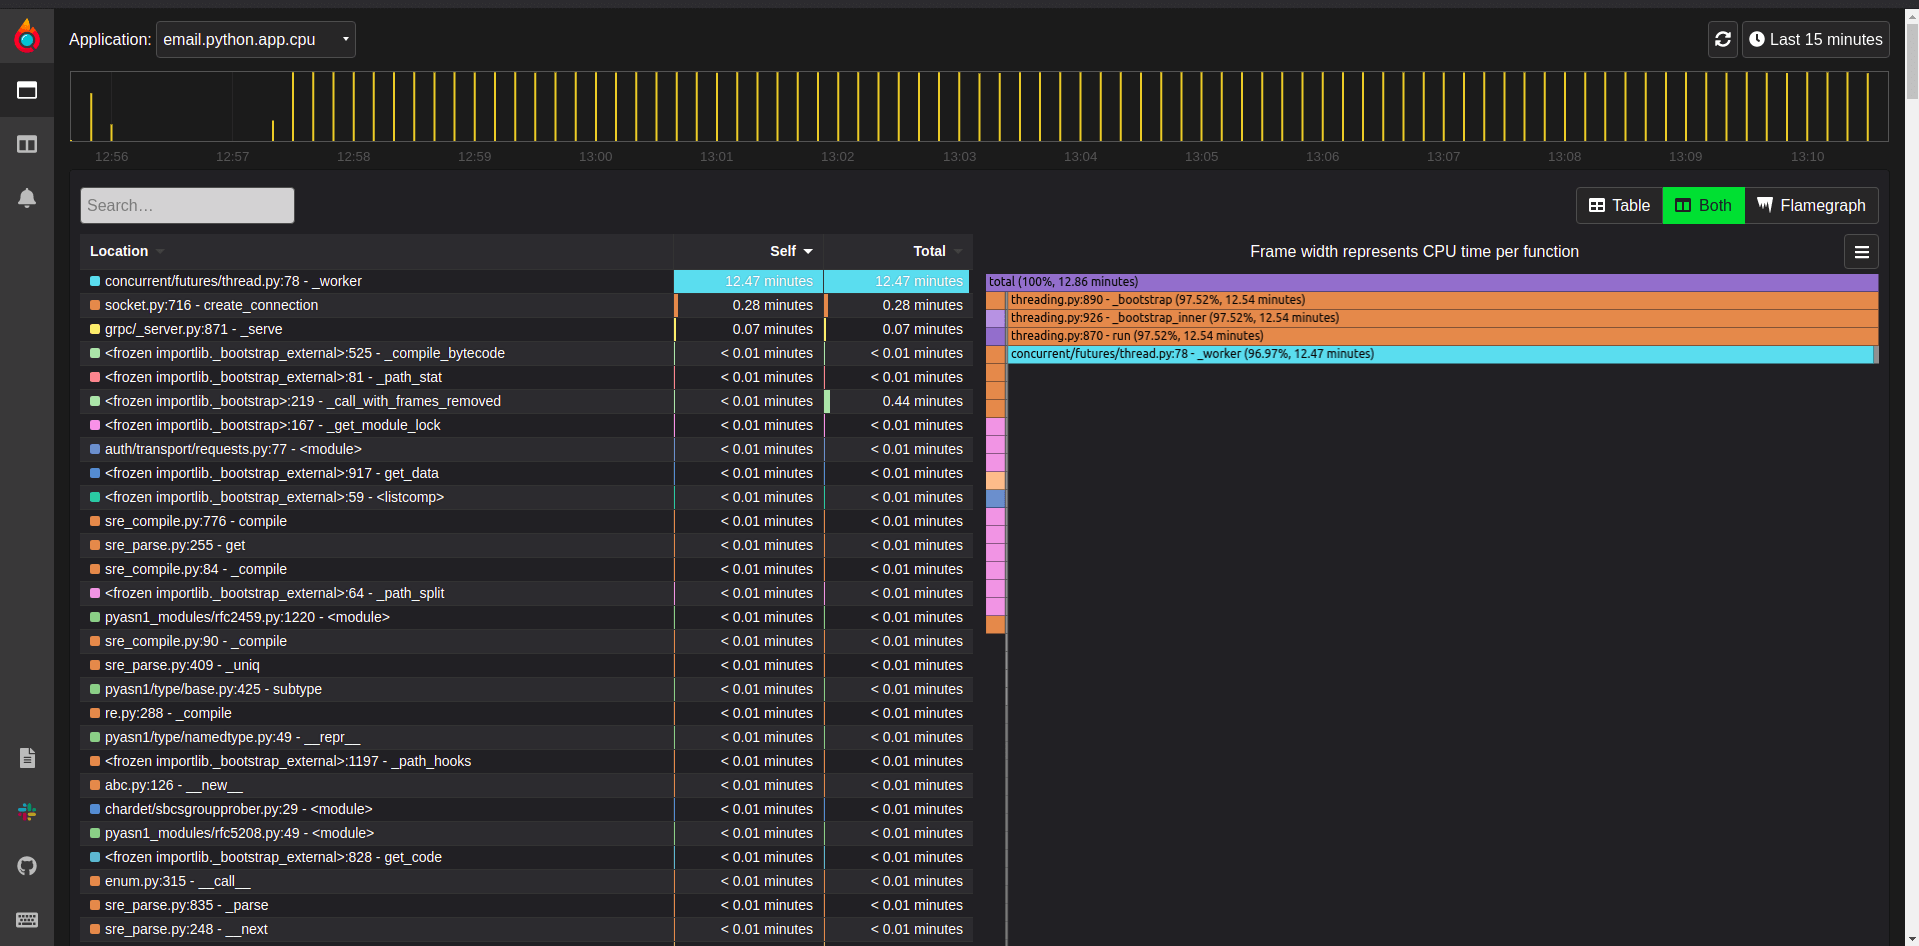
Pyroscope with Python Email application
Continuous profiling performance is a crucial factor in fulfilling the expectation of end-users. And if performance issues occur, you must be ready to diagnose the problem before impacting the end-user experience.
Hence, keep optimizing your applications and fix the issues immediately to continue delivering super-fast application performance using tools like Pyroscope. Pyroscope showcases a layer of visibility to help you understand how to improve the performance of your code in production and reduce cloud infrastructure costs.
此内容由惯性聚合(RSS阅读器)自动聚合整理,仅供阅读参考。 原文来自 — 版权归原作者所有。