







There is an updated version of this map detailed in this updated post.
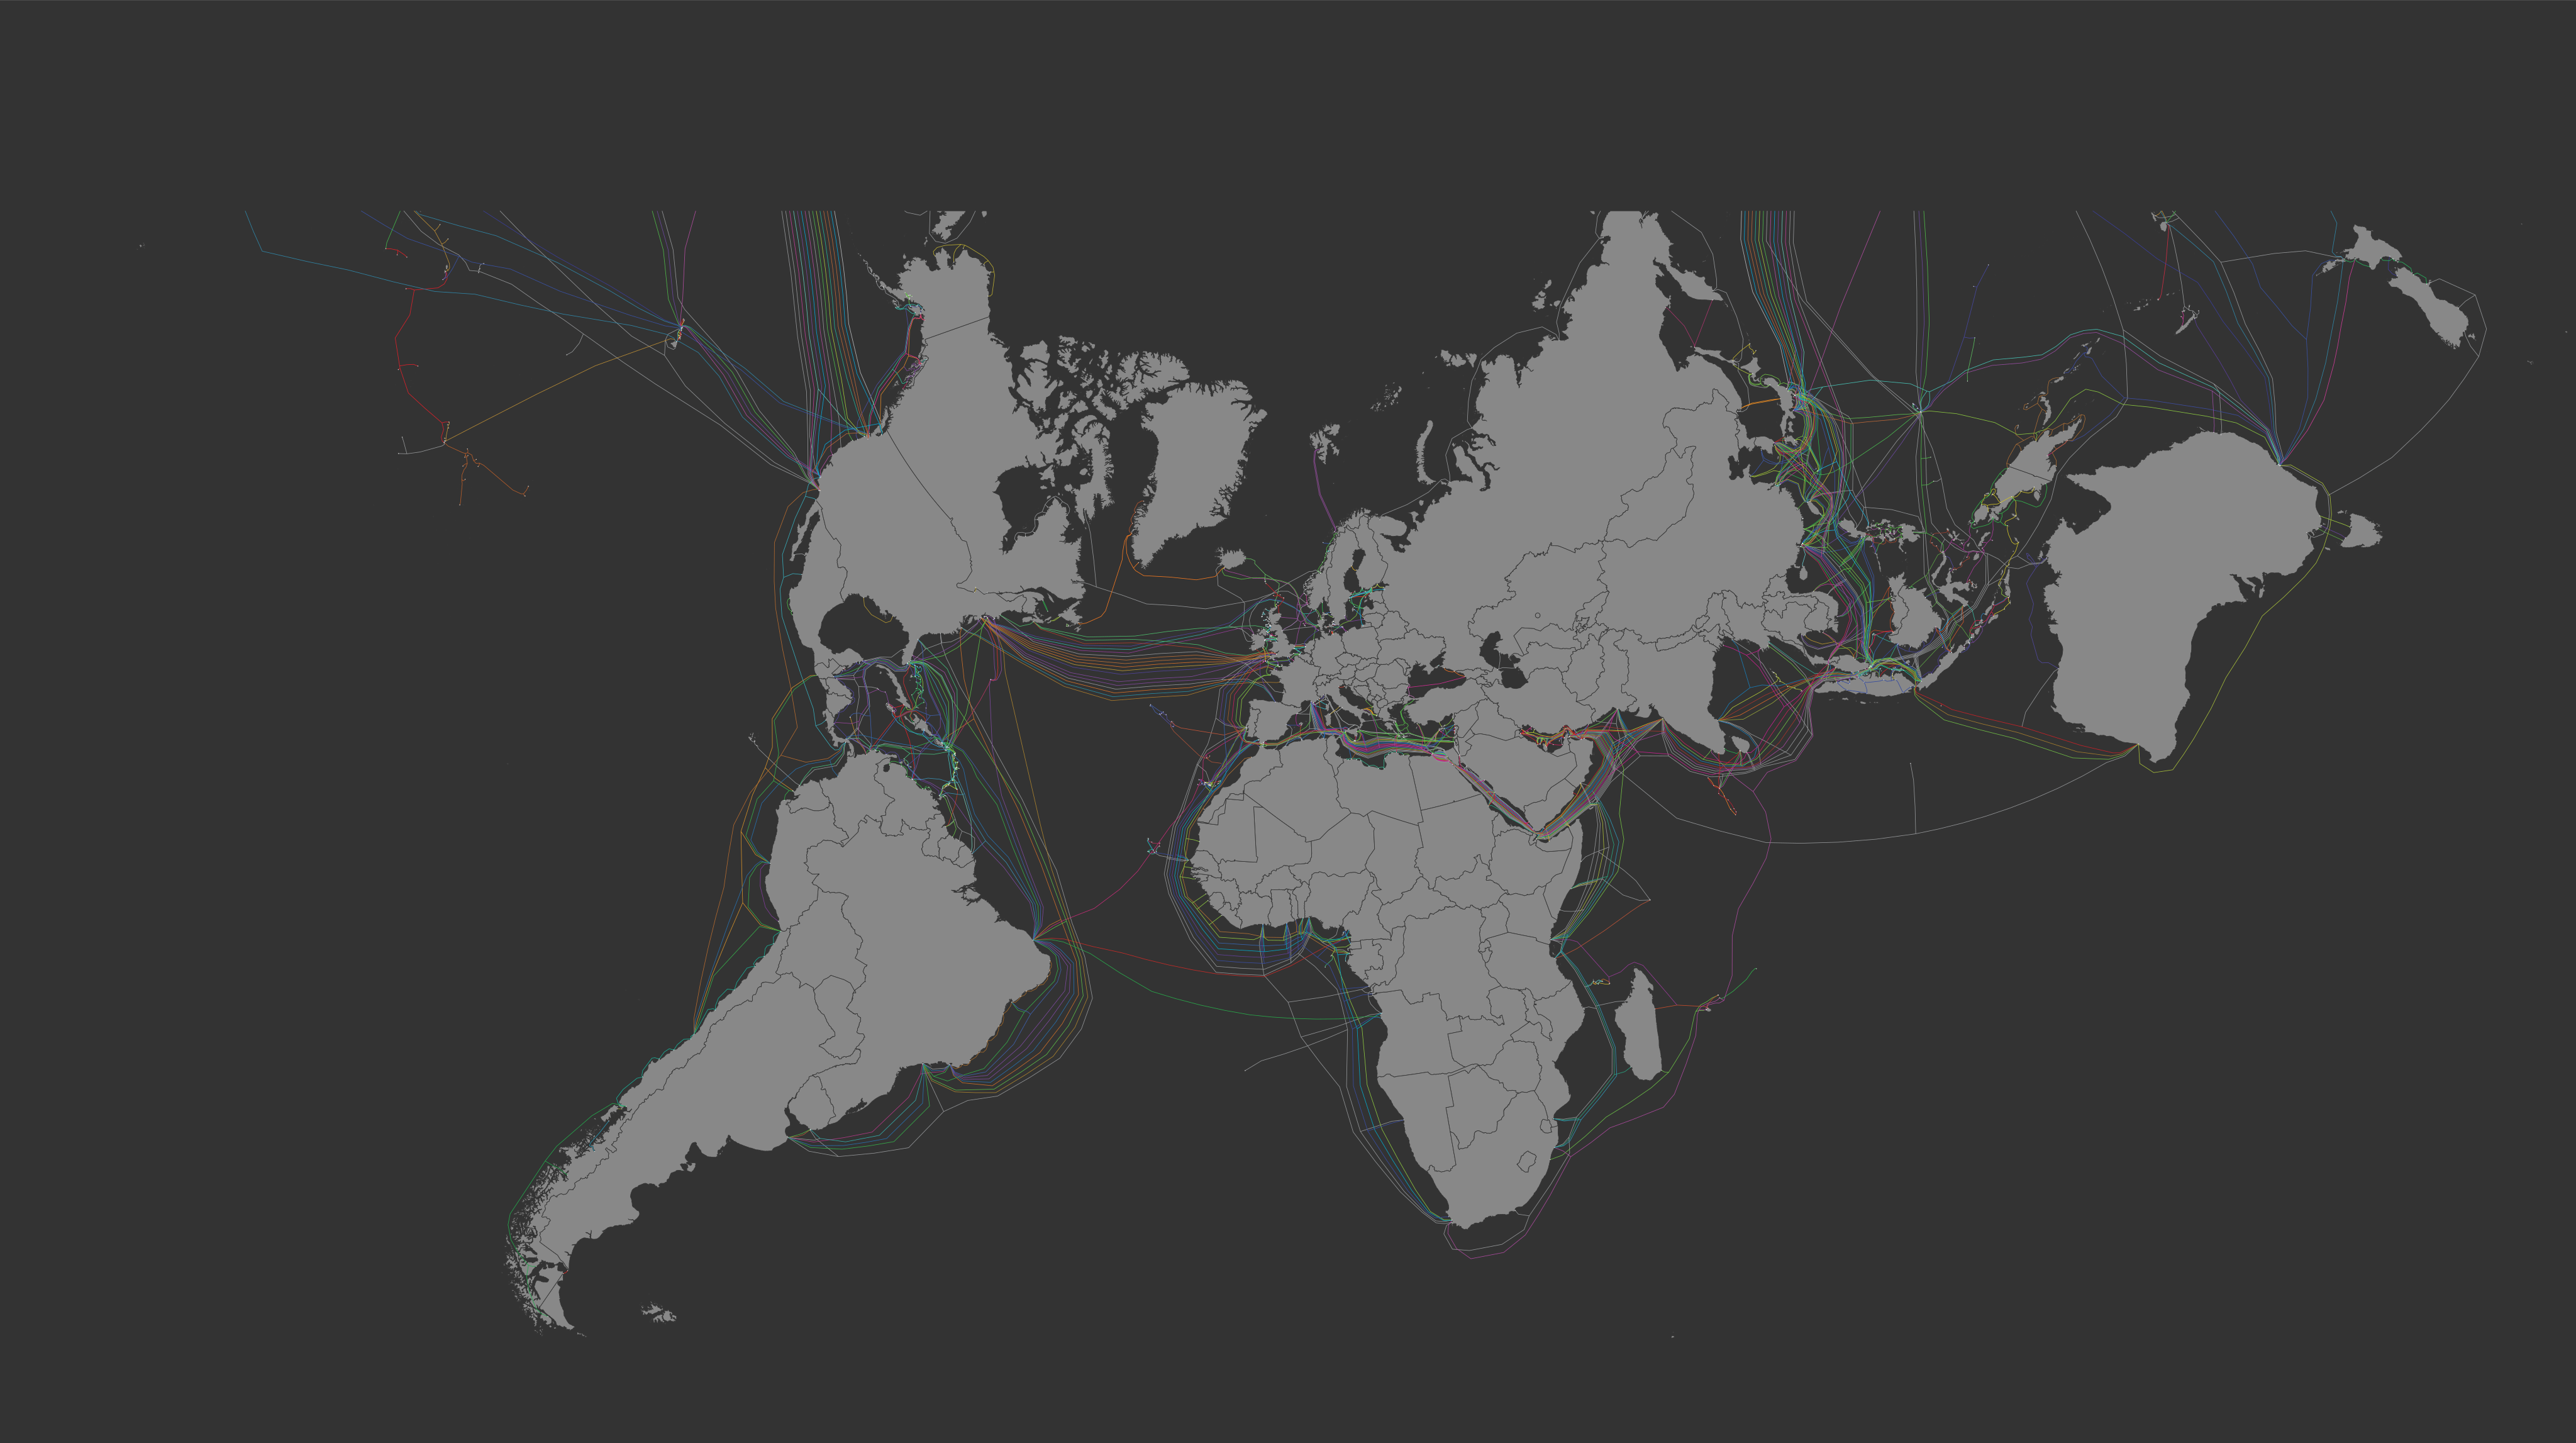
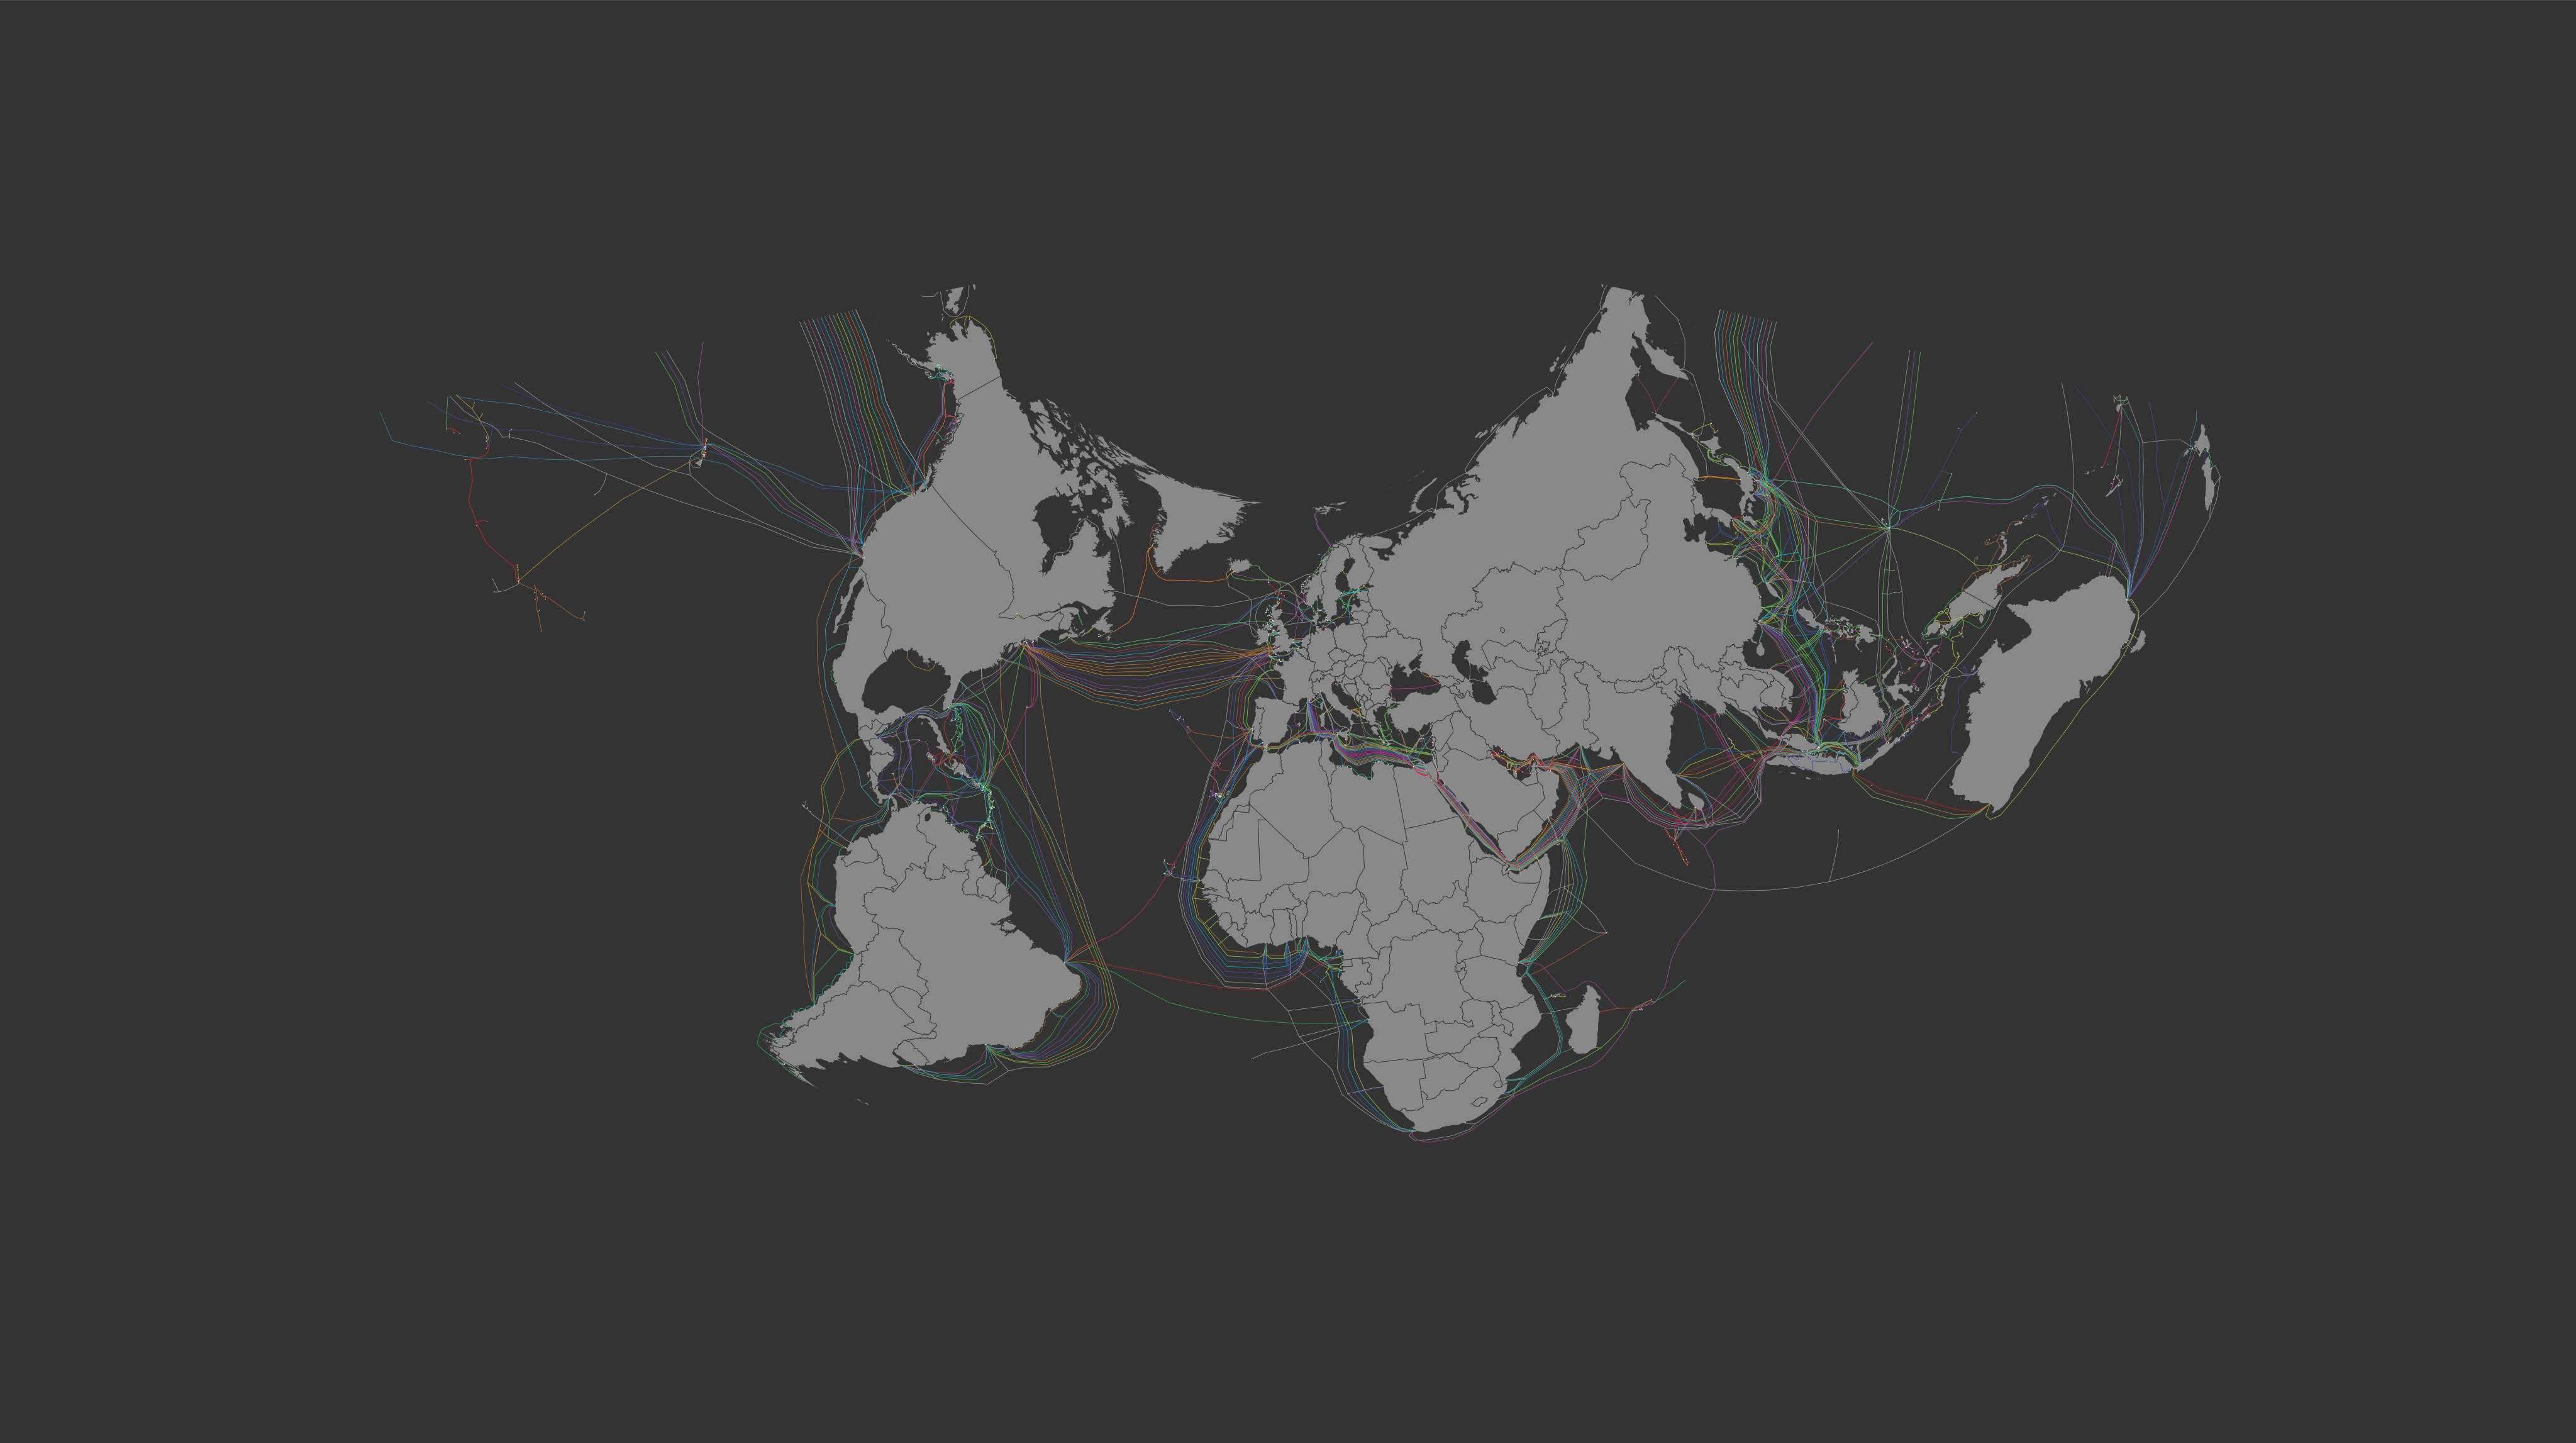
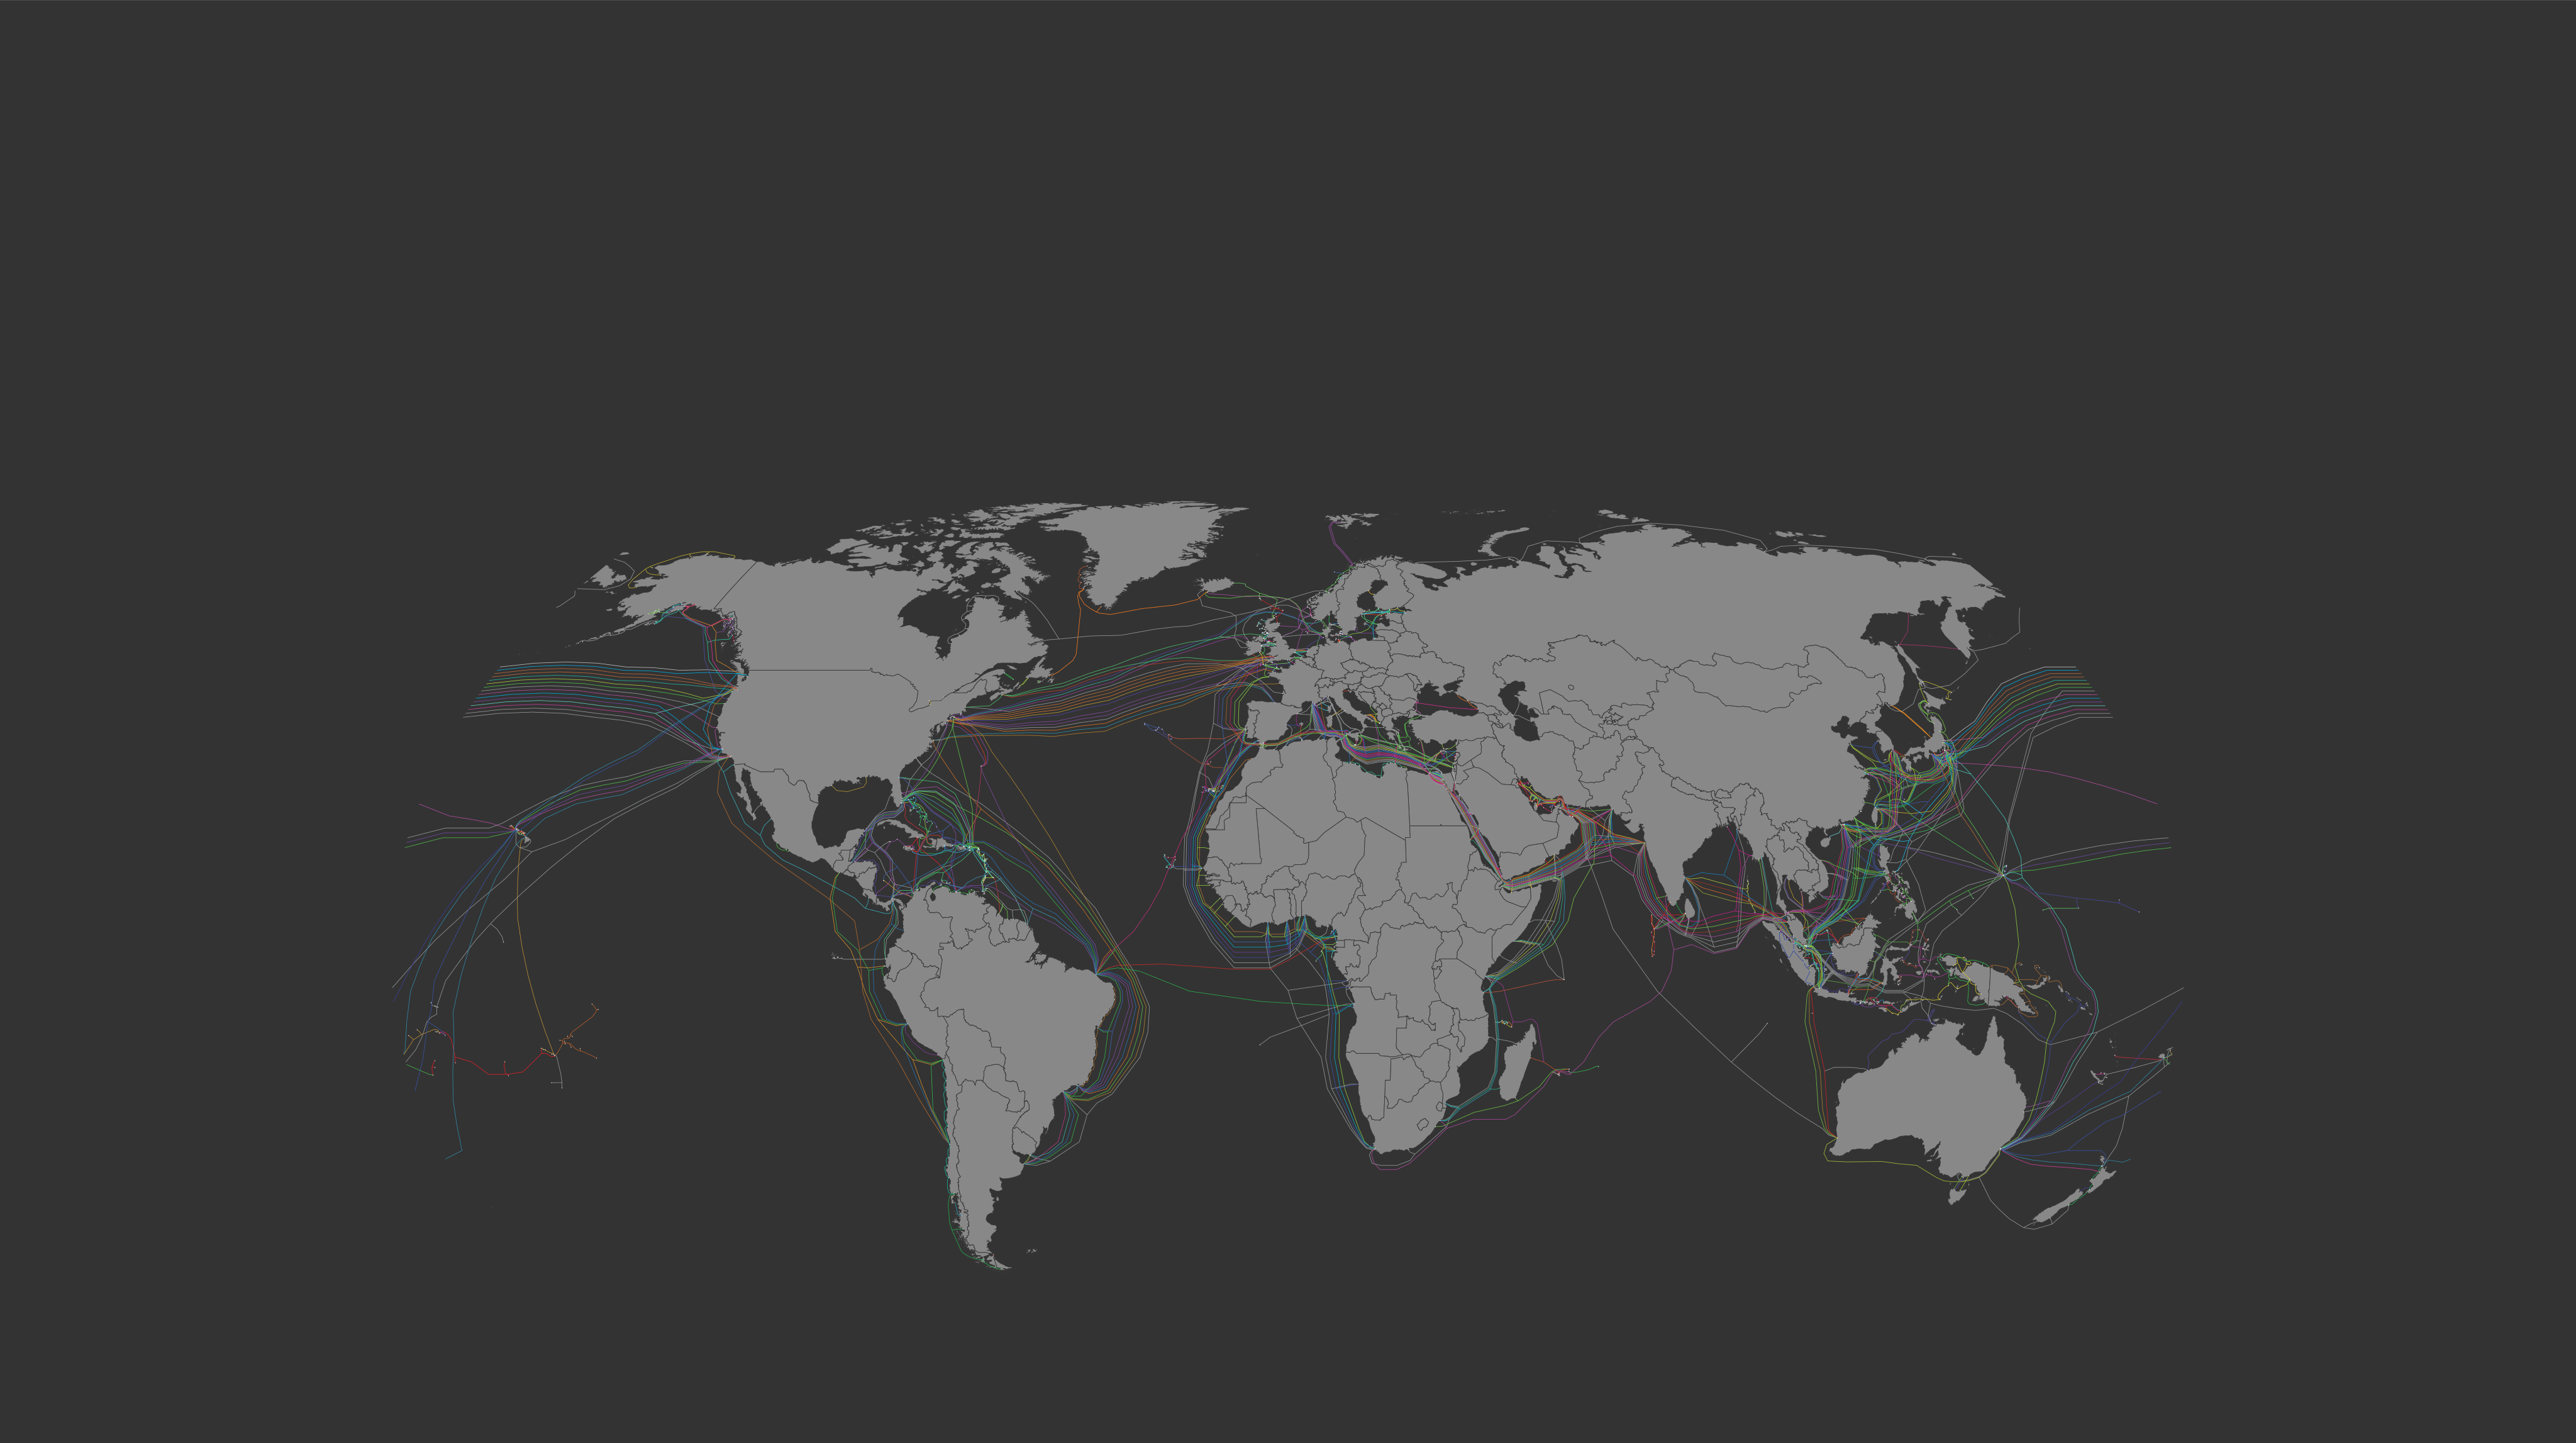
I used data from the submarinecablemap.com website to create my visualization of Submarine Cables that live under our oceans and carry the majority of trans-continental internet traffic. Mostly, I wanted a ‘dark mode’ version of the map but I also plan on adding some interesting annotations from different sources and computing some metrics… Like there is enough fiber optic cable under the oceans to wrap the earth over 103 times! These SVGs were made with javascript, d3. I also used this experience to look at different map projections, which is neat.
Here are the resulting images.

click here for full resolution
click here for full resolution
click here for full resolution
此内容由惯性聚合(RSS阅读器)自动聚合整理,仅供阅读参考。 原文来自 — 版权归原作者所有。