






Function Metrics is now available within the Metrics dropdown in the primary navigation at a site level. This new feature offers an analytics solution designed to help you optimize the performance of your site’s functions.
Function Metrics provide a wealth of insights into the performance, reliability, and utilization of specific functions within applications. Now, developers are no longer reliant on third-party tools for such insights. By analyzing success and error rates, invocation count, and duration, developers can optimize performance, troubleshoot issues, and make data-driven decisions to improve overall application quality and user experience.
Viewing granular data
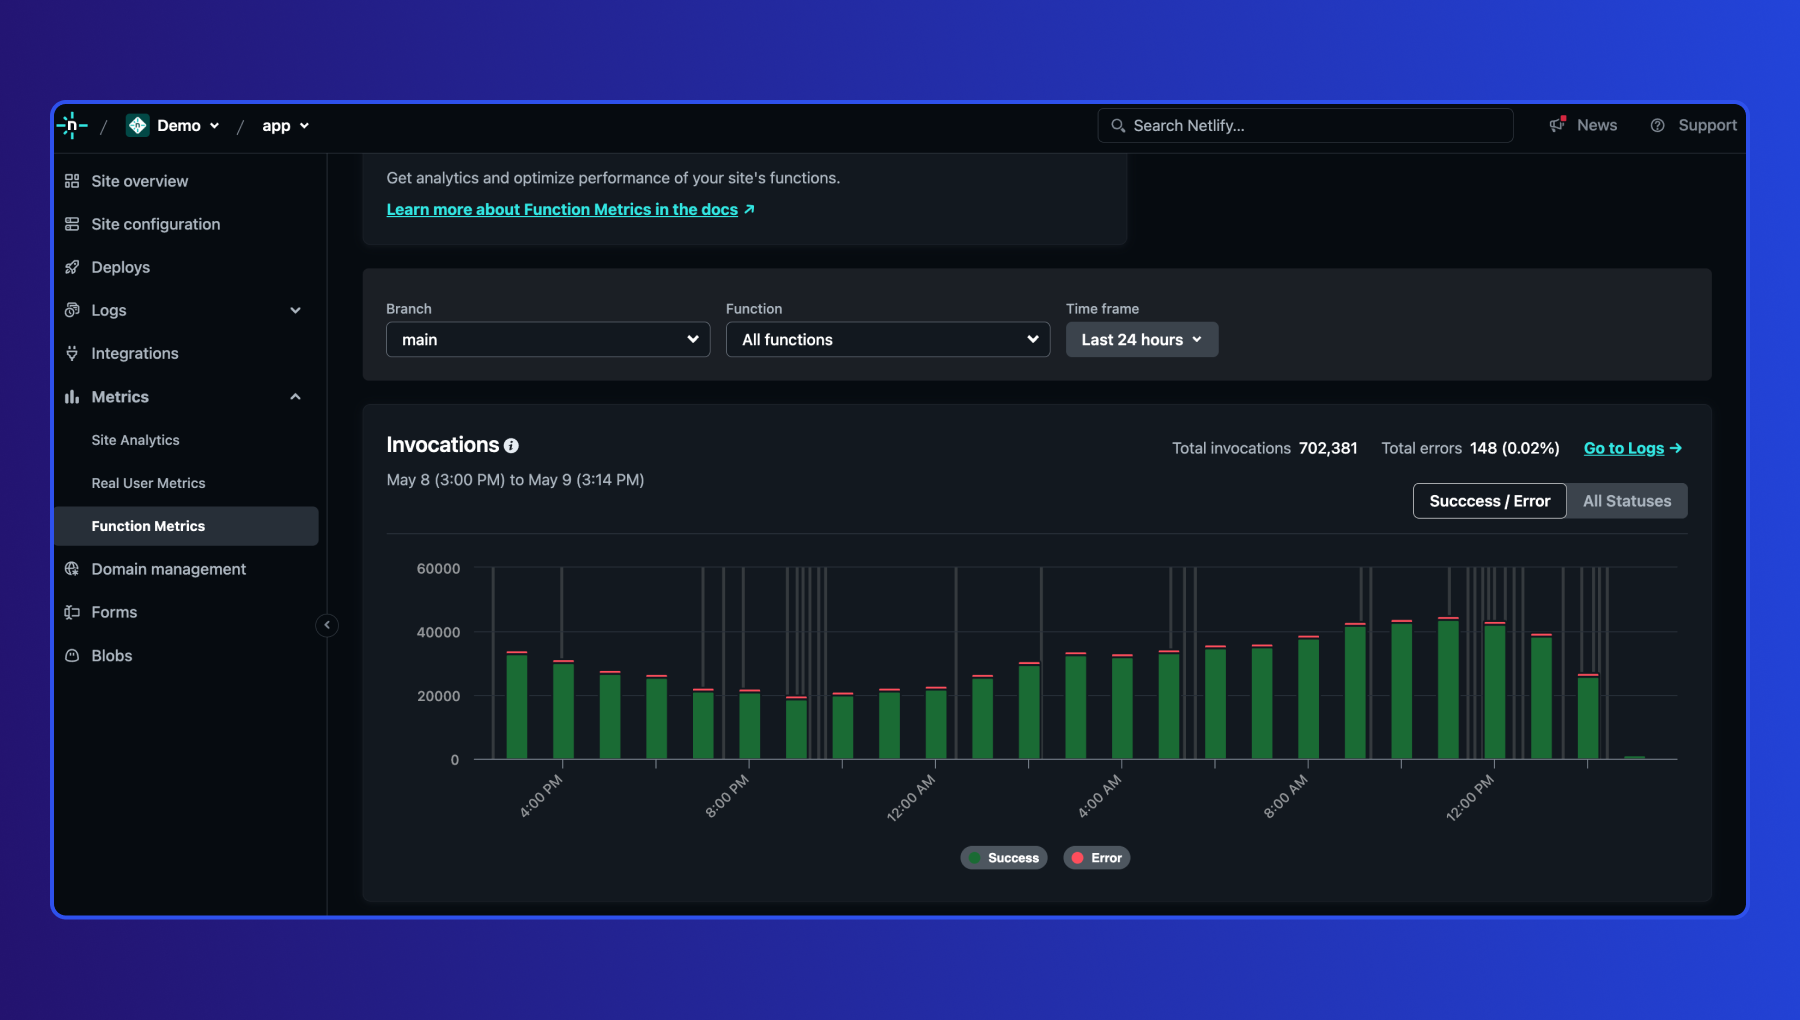
Function Metrics offers several filter options that allow for a more granular view of data.
-
The branch selection allows tracking data from a specific branch, focusing on the performance of a particular development or feature branch.
-
The function selection monitors invocation and error rates of a specific function within the chosen branch. This granular focus aids in pinpointing issues or performance bottlenecks.
-
The time frame selection defines the time frame for data analysis. View data for the last 24 hours, 7 days, or 30 days, tracking short-term trends or long-term patterns in invocation and error metrics.
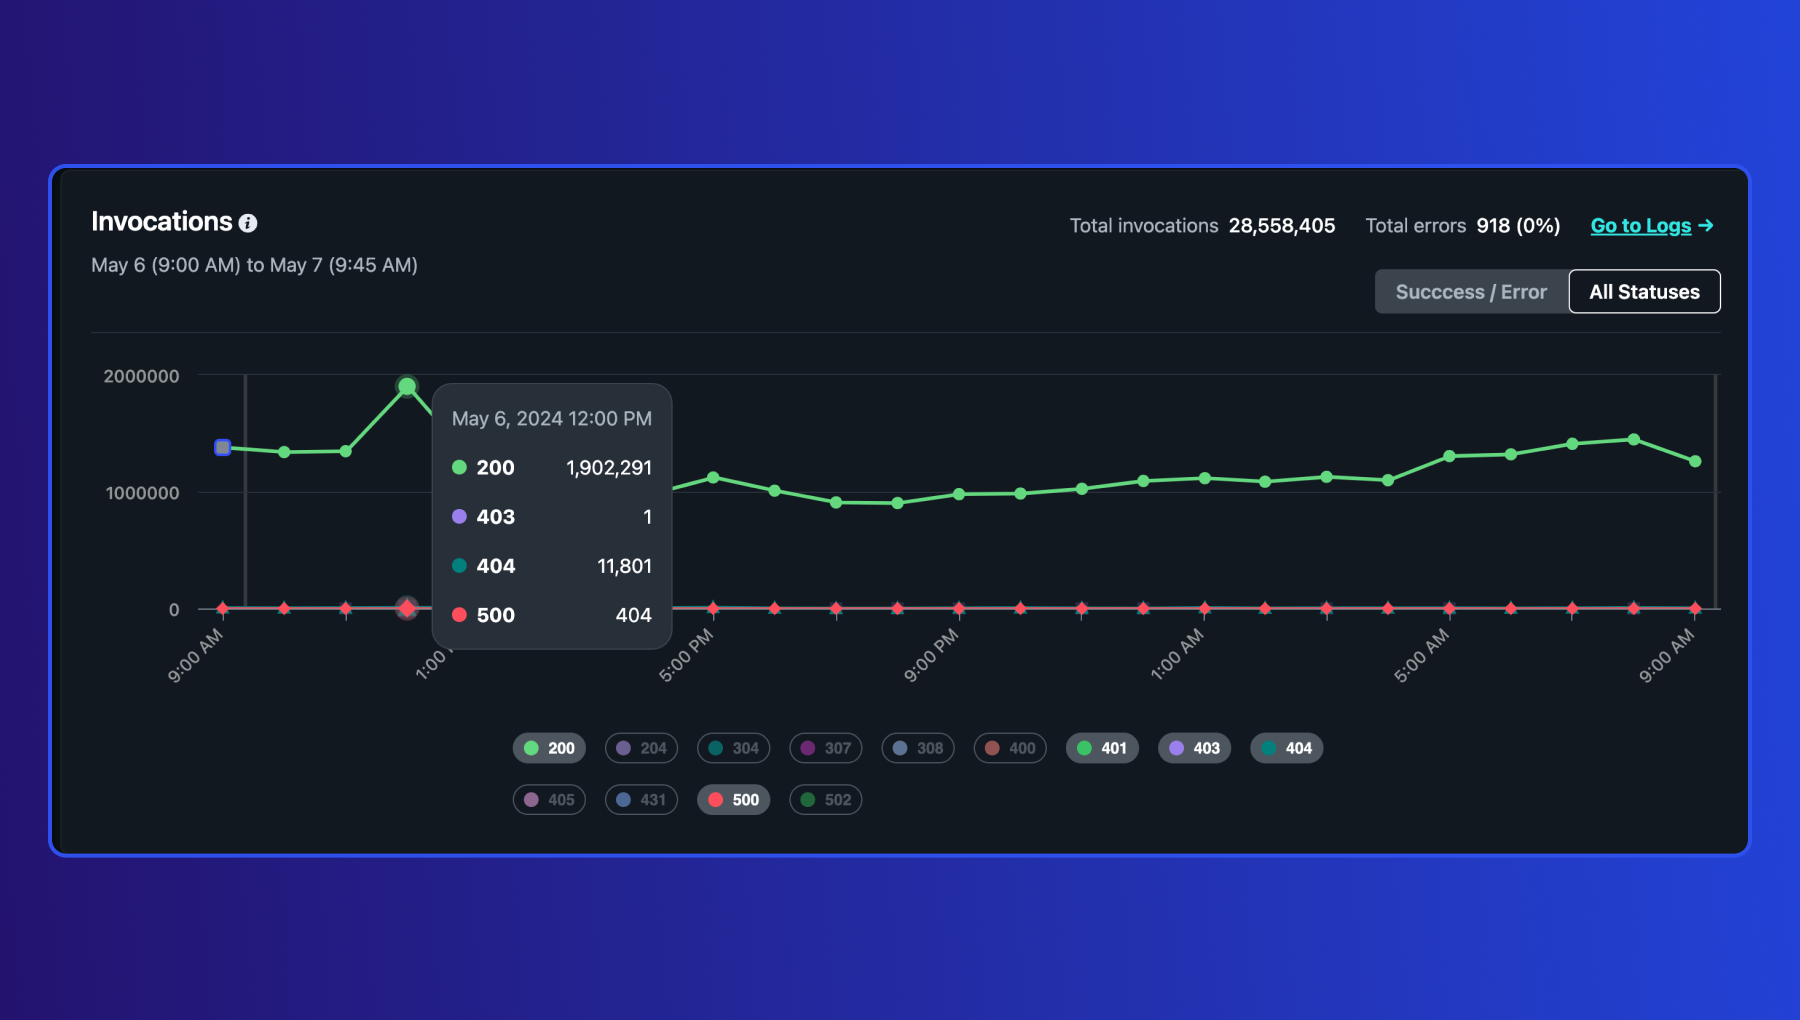
Function Metrics also provides an overview of HTTP status codes, helping identify the timing and gives an option to navigate to the Function log.
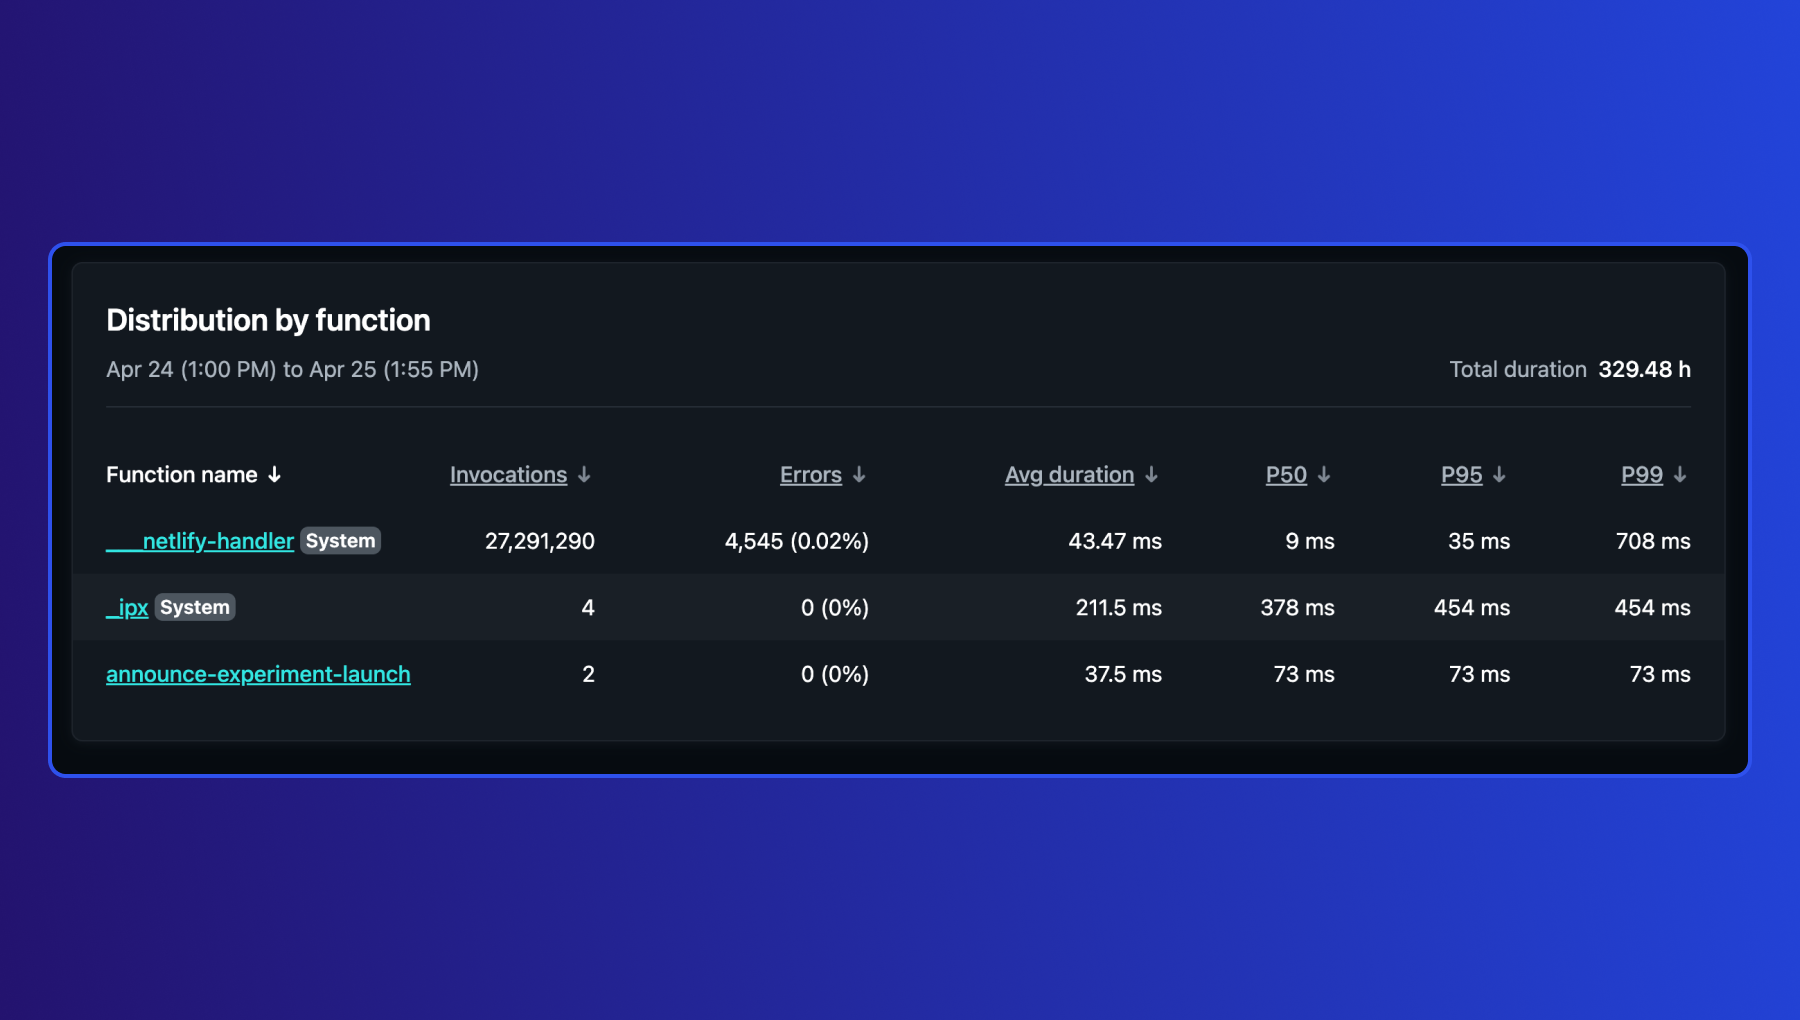
The Distribution by function table lists all functions along with their invocations, errors, average duration and duration percentiles (P50, P95 and P99) metrics. This data assists in understanding which functions perform well and which ones fail.
Navigating to the Function log
Developers now have the ability to delve deeper into errors by accessing the Function log. You can navigate to the Function log in two ways: either by clicking on errors in the “Distribution by function” table or by selecting “Go to logs” from the Invocations graph.
Use cases and benefits
Function Metrics are practical for a variety of use cases:
-
Performance optimization Identify performance bottlenecks by analyzing the average duration, duration percentiles (P50, P95, P99), and error rates of specific functions.
-
Troubleshooting errors Quickly identify and address issues within the application by monitoring errors for specific functions.
-
Prioritize development efforts Allocate resources efficiently by understanding function invocations.
Is this feature available on my pricing plan?
Yes! This feature is now available across all plans, with the Starter plan offering a 7-day data history and Paid plans extending to 30 days.