


惯性聚合 高效追踪和阅读你感兴趣的博客、新闻、科技资讯
阅读原文 在惯性聚合中打开

推荐订阅源

MyScale Blog
MyScale Blog
MongoDB | Blog
MongoDB | Blog
The Register - Security
T
The Blog of Author Tim Ferriss
A
About on SuperTechFans
Vercel News
Vercel News
Cyber Security Advisories - MS-ISAC
Jina AI
Jina AI
Stack Overflow Blog
Stack Overflow Blog
Cisco Talos Blog
Cisco Talos Blog
奇客Solidot–传递最新科技情报
奇客Solidot–传递最新科技情报
W
WeLiveSecurity
S
Securelist
I
Intezer
F
Full Disclosure
WordPress大学
WordPress大学
腾讯CDC
酷 壳 – CoolShell
酷 壳 – CoolShell
Latest news
Latest news
aimingoo的专栏
aimingoo的专栏
C
Cisco Blogs
cs.CL updates on arXiv.org
T
The Exploit Database - CXSecurity.com
P
Proofpoint News Feed
K
Kaspersky official blog
阮一峰的网络日志
阮一峰的网络日志
P
Proofpoint News Feed
J
Java Code Geeks
人人都是产品经理
人人都是产品经理
雷峰网
雷峰网
AWS News Blog
AWS News Blog
T
Tenable Blog
Google DeepMind News
B
Blog RSS Feed
L
LINUX DO - 最新话题
小众软件
小众软件
T
Threat Research - Cisco Blogs
C
Cyber Attacks, Cyber Crime and Cyber Security
The GitHub Blog
The GitHub Blog
爱范儿
爱范儿
N
News and Events Feed by Topic
钛媒体:引领未来商业与生活新知
钛媒体:引领未来商业与生活新知
量子位
H
Hackread – Cybersecurity News, Data Breaches, AI and More
Forbes - Security
Forbes - Security
cs.CV updates on arXiv.org
U
Unit 42
O
OpenAI News
V
V2EX
T
Troy Hunt's Blog

Dropbox Tech Blog

How our universal content processing platform Riviera evolved for AI and beyond How we used DSPy to turn AI evaluations into better responses in Dash chat How Dropbox uses MCP and Dash to close the design-to-code security gap Beyond code generation: rethinking engineering productivity in the age of AI agents Introducing Nova, our internal platform for coding agents Improving storage efficiency in Magic Pocket, our immutable blob store Reducing our monorepo size to improve developer velocity How we optimized Dash's relevance judge with DSPy Using LLMs to amplify human labeling and improve Dash search relevance How low-bit inference enables efficient AI Insights from our executive roundtable on AI and engineering productivity Engineering VP Josh Clemm on how we use knowledge graphs, MCP, and DSPy in Dash Inside the feature store powering real-time AI in Dropbox Dash Building the future: highlights from Dropbox’s 2025 summer intern class Fighting the forces of clock skew when syncing password payloads Introducing Focus, a new open source Gradle plugin Making camera uploads for Android faster and more reliable How Dropbox Replay keeps everyone in sync Why we built a custom Rust library for Capture Detecting memory leaks in Android applications How we sped up Dropbox Android app startup by 30% Why we chose Apache Superset as our data exploration platform Revamping the Android testing pipeline at Dropbox Our counterintuitive fix for Android path normalization JQuery to React: How we rewrote the HelloSign Editor How we ensure credible analytics on Dropbox mobile apps Engineering Dropbox Transfer: Making simple even simpler Speeding up a Git monorepo at Dropbox with <200 lines of code Building for reliability at HelloSign Store grand re-opening: loading Android data with coroutines Modernizing our Android build system: Part I, the planning Modernizing our Android build system: Part II, the execution Our journey to type checking 4 million lines of Python The (not so) hidden cost of sharing code between iOS and Android Redux with Code-Splitting and Type Checking The Programmer Mindset: Main Debug Loop On working with designers Incrementally migrating over one million lines of code from Python 2 to Python 3 Crash reporting in desktop Python applications What we learned at our first JS Guild Summit How we rolled out one of the largest Python 3 migrations ever Dropbox Paper: Emojis and Exformation Creating a culture of accessibility Adding IPv6 connectivity support to the Dropbox desktop client Accelerating Iteration Velocity on Dropbox’s Desktop Client, Part 2 Accelerating Iteration Velocity on Dropbox’s Desktop Client, Part 1 DropboxMacUpdate: Making automatic updates on macOS safer and more reliable Annotations on Document Previews Open Sourcing Pytest Tools Open Sourcing Zulip – a Dropbox Hack Week Project Building Carousel, Part III: Drawing Images on Screen The Tech Behind Dropbox’s New User Experience on Mobile (Part 2) Building Dropbox’s New User Experience for Mobile, Part 1 Building Carousel, Part II: Speeding Up the Data Model Building Carousel, Part I: How we made our networked mobile app feel fast and local Scaling MongoDB at Mailbox Welcome Guido! Dropbox dives into CoffeeScript Some love for JavaScript applications Using the Dropbox API from Haskell A Python Optimization Anecdote Translating Dropbox
Plop: Low-overhead profiling for Python
Ben Darnell · 2012-07-11 · via Dropbox Tech Blog

It's almost time for another Hack Week at Dropbox, and with that in mind I'd like to present one of the projects from our last Hack Week.

A profiler is an indispensable tool for optimizing programs.  Without a profiler, it's hard to tell which parts of the code are consuming enough time to be worth looking at.  Python comes with a profiler called cProfile, but enabling it slows things down so much that it's usually only used in development or simulated scenarios, which may differ from real-world usage.

At our last hack week, I set out to build a profiler that would be usable on live servers without impacting our users.  The result, Plop (Python Low Overhead Profiler) is now available on Github.

How it works

Plop is a sampling profiler, similar to Google's gperftools.  Every 10 milliseconds, a timer is fired which causes the program to record its current stack trace.  After 30 seconds, the collected samples are aggregated and saved.  There is a web-based viewer for the resulting call graphs (using d3.js)

Here's a sample profile, from a simple Tornado-based web server. Click on the image for a full-size interactive view (it's big, so you'll need to either scroll around a lot or use your browser's zoom controls).
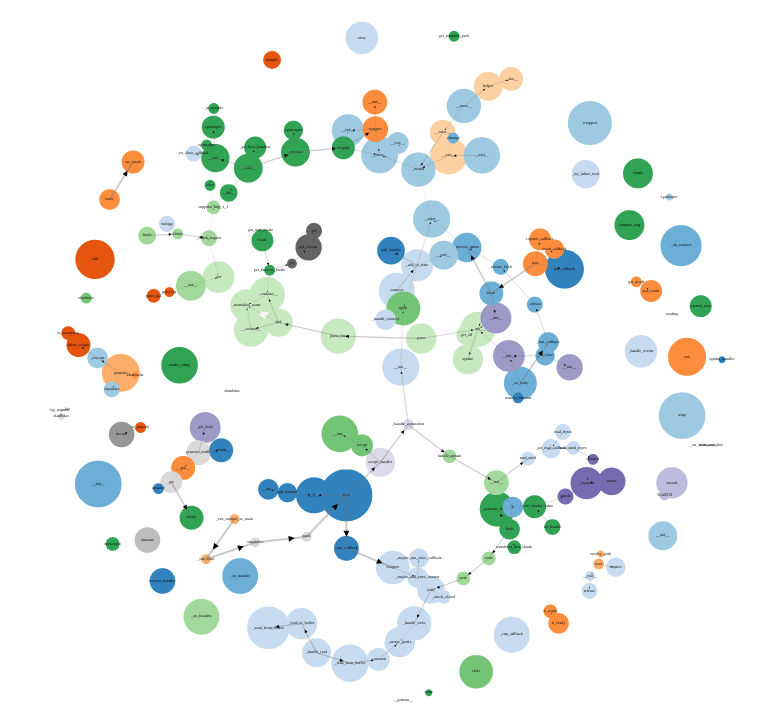
Each bubble is a function; they're color-coded by filename and you can mouse over them for more details. The size of the bubble represents the amount of time spent in that function.  The thickness of the lines connecting the bubbles represents how frequently that function call appears on the stack.  The disconnected bubbles around the edge are actually common utility functions that are called from many places throughout the code - they're so common that drawing the connections to every function that calls them would make the graph unreadable.

Since hack week, we've integrated Plop into our servers and run it regularly.  Every time we push new code to the site, a script collects a profile for the new version.  This has proven not to be disruptive, with less than 2% CPU overhead while the profile is being collected. It's still a work in progress (especially the viewer), but has already proven useful in identifying performance regressions.


// Copy link

Link copied

  • Link copied