





For mobile-first organizations, the distance between a “slow app” and a “resolved ticket” is often filled with guesswork. Mobile performance is notoriously difficult to capture because it lives at the intersection of device hardware, network stability, and local code execution. Today, we are closing that gap with the launch of Coralogix Mobile Performance.
This feature transforms how teams monitor, analyze, and troubleshoot mobile performance issues by providing a structured, data-driven flow from high-level vitals to granular root causes.
Performance degradation in mobile applications is not just a technical inconvenience; it is a direct threat to user retention and brand loyalty.
Conversion and retention: Metrics like Cold Start Time and Warm Start Time represent the first impression of your brand. Delays here lead to immediate bounce rates.
User satisfaction: High Frozen Frame (frames >700ms) and Slow Frame (>16ms) counts correlate directly with perceived “lag,” leading to negative app store reviews and decreased session depth.
Operational stability: Tracking Crash Counts and ANR (Application Not Responding) rates allows leadership to make informed decisions on when to pause feature development in favor of stability sprints.
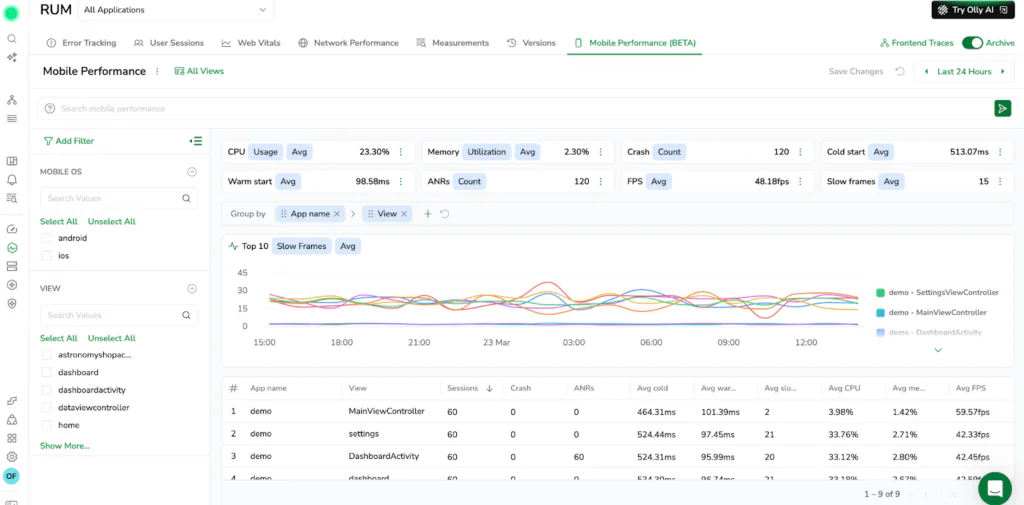
Unlike traditional tools that offer fragmented data, Coralogix provides a three-stage investigative flow designed to move from a symptom to a solution in seconds.
The entry point is a centralized dashboard displaying core performance KPIs. This view allows teams to identify which specific screens are underperforming across the entire application.
Resource monitoring: Track CPU and Memory Usage alongside user-facing vitals to see if resource spikes are the hidden driver behind lag.
Trend analysis: Use performance graphs to visualize spikes or regressions over time, grouped by application version or device type.
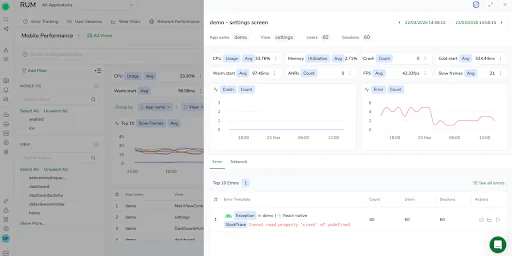
Once a problematic screen is identified, users can drill down into a dedicated view that correlates performance metrics with system objects.
Dual-graph correlation: View mobile vitals (like frame rate) on one axis and technical objects (like errors or network requests) on another. When a cursor moves across one graph, the corresponding time is marked on the other, revealing instant patterns.
Contextual KPIs: The header automatically enriches the view with User Count, Session Count, and Event Count, providing immediate scale to the impact.
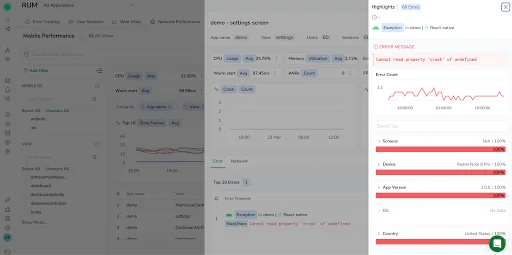
The final stage of the flow connects the “what” to the “why.” Coralogix surfaces the top technical triggers occurring during performance dips:
Errors and templates: Identify recurring errors that correlate with negative user experiences.
Network requests: Analyze API success rates and latency to see if third-party dependencies are slowing down the frontend.
Breadcrumbs and functions: Reconstruct the sequence of user actions or internal function executions that preceded a crash or slowdown.
By integrating mobile performance into the broader Coralogix platform, organizations gain more than just a troubleshooting tool; they gain a strategic asset.
Data-driven roadmaps: Product owners can prioritize engineering efforts based on which screens affect the most users or have the highest resource consumption.
Infrastructure optimization: By correlating mobile vitals with backend telemetry, teams can identify if backend optimizations are needed to support frontend speed.
Full data ownership: As with all Coralogix data, your mobile performance events are stored in your own cloud object storage, ensuring full historical analysis without vendor lock-in or escalating costs.
One of the most significant advantages of Coralogix Mobile Performance is its streaming architecture. Unlike legacy tools that rely on indexing delays or aggressive sampling, Coralogix processes mobile vitals in-stream. This means you see cold starts, frame drops, and ANR events as they happen, not minutes later after indexing completes.
This real-time approach eliminates the guesswork around whether a performance issue is still occurring or has already resolved itself. Teams can respond immediately, reducing mean time to resolution and preventing user churn before it compounds.
Mobile performance issues rarely exist in isolation. A slow screen load might be caused by a backend API timeout, a database query bottleneck, or a third-party service degradation. Coralogix automatically correlates mobile vitals with backend traces, logs, and infrastructure metrics through OpenTelemetry standards.
When a user experiences a frozen frame, you can trace the exact network request that triggered it, follow that request through your backend services, and identify the root cause (whether it’s a slow database query, a memory spike, or a failing microservice) all without leaving the platform or manually stitching together trace IDs.
Not all performance data is equally important. Coralogix automatically clusters mobile vitals by screen and version, reducing noise and surfacing what matters. Instead of drowning in thousands of individual frame rate measurements, you see aggregated patterns.
This intelligent grouping allows teams to quickly identify regressions tied to specific releases, prioritize fixes based on user impact, and validate that performance improvements actually work in production.
When a screen shows degraded performance, Coralogix provides one-click access to full dependency mapping. You can instantly see which backend services that screen depends on, which network requests are failing or slow, and which error templates are most common during that screen’s lifecycle.
This eliminates the need to manually correlate logs, traces, and metrics across multiple tools. Everything is connected through consistent tagging and OpenTelemetry context propagation, giving you a complete picture in seconds.
Coralogix Mobile Performance supports both threshold-based alerts (for known regressions) and anomaly detection (for unknown issues). You can set alerts on any mobile vital (cold start time, frame rate, crash count) and have those alerts automatically correlate with backend telemetry to provide full context.
When an alert fires, your team receives not just a notification that something is wrong, but a pre-built investigation showing which users are affected, which backend services are involved, and what changed recently (via version tags).
Because Coralogix stores all mobile performance data in your own cloud storage, you retain every mobile session for as long as your retention policies allow. This is critical for debugging intermittent issues, analyzing long-term trends, and conducting post-mortems on incidents that occurred weeks or months ago.
Unlike tools that charge premium rates for extended retention or force you to rehydrate archived data, Coralogix queries your S3 or GCS buckets directly. You pay only for object storage costs, not observability vendor markup.
Coralogix Mobile Performance is designed for engineers who need to solve problems, not admins who need to configure dashboards. The three-stage flow (vitals overview, screen deep dive, object investigation) mirrors the natural troubleshooting process, guiding you from symptom to root cause without requiring extensive training or custom configuration.
And because the feature is built on the same streaming architecture as the rest of Coralogix, you get the same benefits: no indexing delays, no sampling gaps, no vendor lock-in, and no surprise bills.
Mobile performance is no longer a black box. With Coralogix, it is a structured, queryable, and actionable dataset that empowers technical teams to deliver the fast, reliable experiences users expect.
Learn more about Coralogix RUM Mobile Performance here.
此内容由惯性聚合(RSS阅读器)自动聚合整理,仅供阅读参考。 原文来自 — 版权归原作者所有。