


by Shailendra Chauhan, Sr. Director, Redpin | Clarence Selestin, Sr. SRE Manager, Redpin | Shubham Sharan, Technical Account Manager, Coralogix
Redpin is on a mission to simplify life’s most important payments. As the parent company behind Currencies Direct and TorFX, Redpin connects over half a million people and businesses across 235 territories, moving more than £10 billion securely every year. The company operates at the intersection of fintech and proptech, digitising international property transactions and cross-border payments for individuals, real estate agents, lawyers, and enterprises worldwide.
Behind every seamless currency conversion and property payment is a complex, distributed engineering platform. Redpin’s engineering teams run hundreds of microservices across Kubernetes, span 20+ countries, and process mission-critical transactions where every second of downtime carries direct financial and reputational consequences.
This post describes how Redpin partnered with Coralogix to build a modern observability practice, delivering full-stack correlation across frontend, application, and infrastructure signals, powered by OpenTelemetry and AI-driven investigation.
Running a payments platform at Redpin’s scale demands that every layer of the stack be observable, and that signals from each layer connect without manual effort. Working closely with Redpin’s SRE and platform engineering teams, the Coralogix TAM co-architected an end-to-end observability blueprint tailored to Redpin’s multi-region payments infrastructure, translating business-critical SLA requirements into a concrete OpenTelemetry instrumentation strategy across all three signal tiers. The architecture Redpin built with Coralogix achieves exactly that, with OpenTelemetry as the connective tissue.
The data flow operates across three tiers, unified by a shared context model, the W3C TraceContext standard, that threads a single identifier from a user’s browser session all the way through backend services and down to the Kubernetes pods running them.
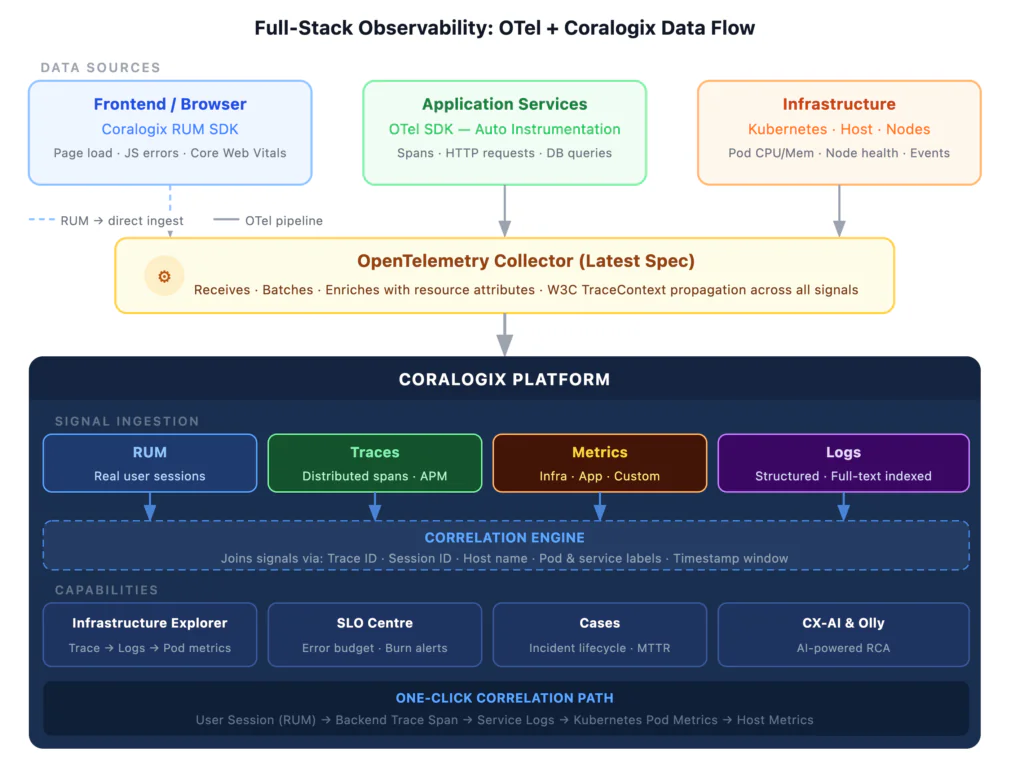
The Coralogix RUM SDK, embedded in Redpin’s web and mobile applications, captures every user interaction: page load timings, Core Web Vitals, JavaScript errors, and user journey flows. When a user initiates an API call, such as a currency exchange rate lookup or a property payment, the RUM SDK injects a W3C-standard trace context header into the request, linking the user’s browser session directly to the backend trace it triggers.
Redpin’s backend microservices run the OpenTelemetry SDK at its latest specification, with auto-instrumentation across all major frameworks. As each payment request propagates through services, the trace context is forwarded at every hop, creating a distributed trace that spans every microservice involved. Alongside traces, the OTel SDK captures application metrics and structured logs, all tagged with shared service, version, and environment attributes.
The OpenTelemetry Collector runs as a DaemonSet across Redpin’s Kubernetes clusters, scraping pod-level and node-level metrics, collecting container logs, and forwarding all telemetry to Coralogix. The Coralogix TAM designed the Collector pipeline configuration in collaboration with Redpin’s infrastructure team, engineering custom resource attribute processors, OTTL transform rules for service-to-application mapping, and tail sampling policies that captured 100% of error traces while keeping overall data volume cost-efficient. Resource attributes such as pod name, namespace, cluster, and host are automatically enriched at the Collector level, ensuring every signal carries the metadata needed to link it to the others.
All four signal types (RUM sessions, distributed traces, infrastructure metrics, and logs) arrive at Coralogix and are indexed with their shared identifiers. The correlation engine uses OTel to make every signal navigable from any other: a RUM session links to its backend trace, the trace links to service logs and pod metrics, and pod metrics link to host-level health. The result is a single, unbroken diagnostic path from user experience to infrastructure, without switching tools.
With the OTel upgrade complete and semantic conventions properly applied, Coralogix’s Infrastructure Explorer became Redpin’s primary investigation interface. Engineers can navigate from a slow trace directly to the Kubernetes pod metrics for the same time window, and from there to the logs emitted by that pod, all in a single, correlated view.
For a platform where a payment processing delay could originate from a degraded database replica, a misbehaving third-party FX API, or a Kubernetes node under memory pressure, this correlation capability is transformative. Engineers arrive at the data during an incident, with full context, rather than assembling it after the fact.
Redpin adopted Coralogix Cases as their incident management layer, integrated directly with their alerting and investigation workflows. Cases give every incident a structured lifecycle, from detection through investigation to resolution, with all correlated telemetry, alert history, and engineer notes attached to a single record.
The impact on MTBI (Mean Time Between Incidents) and MTTR has been measurable. With Cases, the team runs structured post-mortems grounded in actual incident data rather than reconstructed timelines. Patterns become visible, such as which service families are most incident-prone, which alert types are noisy versus signal, and where runbooks are missing, and each resolved case becomes a learning artifact that drives future reliability improvements.
The most visible shift in Redpin’s engineering culture has come from adopting Coralogix’s AI capabilities, CX-AI and Olly, Coralogix’s AI-powered observability assistant. With Olly, engineers describe what they’re observing in natural language and receive an AI-generated analysis grounded in their actual telemetry. CX-AI surfaces anomalies, correlates unusual patterns across the signal stack, and suggests probable root causes.
The reduction in RCA time has a compounding effect: engineers resolve incidents faster, return to feature work sooner, and accumulate less on-call fatigue. More junior engineers can now lead incident response confidently, knowing Olly is amplifying their investigative capability.
Redpin serves customers buying property in Spain from the UK, paying invoices in South Africa from Canada, and sending payroll across 40+ currencies. These users are distributed, diverse, and often completing high-stakes transactions where a slow load at the wrong moment causes real anxiety. RUM gives Redpin’s frontend team genuine visibility into that experience, capturing performance data from real users, in real browsers, at real network conditions, in real time.
The team identified performance regressions that synthetic monitoring had entirely missed: rendering bottlenecks specific to certain browser versions, elevated Time to Interactive on slower connections in certain regions, and JavaScript errors only surfacing in production traffic from particular device types. Fixing these issues directly improved conversion and customer satisfaction on payment flows where performance anxiety is highest.
In Redpin’s distributed architecture, a single user transaction touches dozens of services. When a trace span shows elevated latency or an error, the diagnostic question is not just “what happened in this service?” It’s “what was happening in the Kubernetes pod, the host, and the logs, at exactly the same moment?”
With Coralogix, clicking on any trace span immediately surfaces the related logs from that service, the pod metrics for the underlying Kubernetes workload, and the host-level metrics, all scoped to the same time window, without leaving the context of the trace. For an on-call engineer diagnosing a payment processing slowdown at 2am, this is not a minor convenience. It is the difference between a 10-minute resolution and a 90-minute one.
With the SLO Centre, Redpin formalised service level objectives across critical payment and property transaction flows. Error budget burn rate alerts now fire before an SLO is breached, giving engineering teams time to respond while the budget is still intact. The SLO Centre provides a single dashboard that communicates service health in terms meaningful to both engineers and stakeholders.
The shift from reactive to proactive is not just a technical change, it’s a confidence change. Redpin’s teams now operate with a shared understanding of what “good” looks like, a real-time view of how close they are to it, and an automated early warning system when they start drifting away.
The cumulative effect of these six initiatives has been a fundamental transformation in how Redpin’s engineering organisation operates:
Redpin’s journey with Coralogix demonstrates what becomes possible when OpenTelemetry is implemented at its full potential: a single, unbroken observability pipeline that connects a user’s browser session to backend traces, service logs, and Kubernetes pod metrics, all with a single click.
By layering AI-powered investigation, structured incident management, real-user monitoring, and proactive SLO tracking on top of that foundation, Redpin has built an observability practice that matches the ambition and scale of the platform it supports. This outcome was shaped by a deep, ongoing partnership between Redpin’s engineering leadership and the Coralogix TAM, who served not just as a technical go-to person but as a strategic advisor embedded in the architecture decisions from day one, ensuring every design choice aligned with Redpin’s business SLAs and long-term platform roadmap.
For a business where trust is the product, where customers are moving the proceeds of a property sale or sending a year’s worth of payroll across borders, that level of engineering reliability is not just operationally important. It is foundational to the business.
| | Shubham Sharan is a Strategic Advisor specialising in multi-cloud orchestration and hyperscale observability. Leading Agentic AI for autonomous operational resilience, he designs and engineers mission-critical frameworks that guarantee 99.99% availability. Shubham excels at synthesising high-level technical blueprints with strategic business objectives, driving TCO optimisation and reliability for revenue-critical cloud and on-prem ecosystems. |
| Clarence Selestin is a Senior Engineering Manager for SRE at Redpin. With over 15 years of experience, including leading global SRE at Ford Motor Company, he specialises in operational excellence, cloud automation, and building highly resilient platforms for the fintech and ecommerce sectors. | |
| Shailendra Chauhan is a technology leader with over 20 years of experience in cloud, DevOps, SRE, security, and engineering operations. As Senior Director at Redpin, he leads platform engineering and security, enabling secure, scalable, and reliable digital experiences that support international payments across 235 territories. He is passionate about platform engineering, AI-driven software delivery, developer productivity, and building high-performing engineering organisations. |
此内容由惯性聚合(RSS阅读器)自动聚合整理,仅供阅读参考。 原文来自 — 版权归原作者所有。