






Incident response has a well-known efficiency problem. The tools teams use to detect and investigate issues are often disconnected from the tools they use to manage and resolve them. Engineers spend a significant portion of each incident switching between platforms, assembling context that should already be at hand. Even when the data is available, correlating signals across user, app, infrastructure, and security events to pinpoint a root cause remains manual and slow. This naturally leads to slower resolution, inconsistent investigations, and post-incident reviews that rarely happen.
Coralogix and Atlassian are addressing this directly. A new integration brings Coralogix’s full-stack observability (logs, metrics, traces, and security events) into Jira Service Management’s incident workflow as a native capability, built on the Model Context Protocol (MCP) and surfaced through Atlassian’s Rovo.
The result: teams can detect, investigate, and resolve incidents in a single space with AI-driven analysis at every step.
Coralogix is a full-stack observability platform with AI-native analysis, designed to give teams complete visibility across any environment without forcing a tradeoff between depth and spend. It collects and correlates logs, metrics, traces, and security events, and makes that intelligence available to both human operators and AI agents.
Atlassian Jira Service Management is an AI-native service and operations management solution that helps IT Ops teams detect, resolve, and prevent service disruptions while enabling change velocity and innovation.
Together, the integration closes the gap between knowing something is wrong and doing something about it. Coralogix provides the observability intelligence, what’s happening, why, and what changed. Atlassian provides the operational workspace, where teams coordinate, decide, and act. Connected natively through MCP, the two platforms turn incident response into a single, AI-assisted workflow: from detection through investigation to resolution and learning.
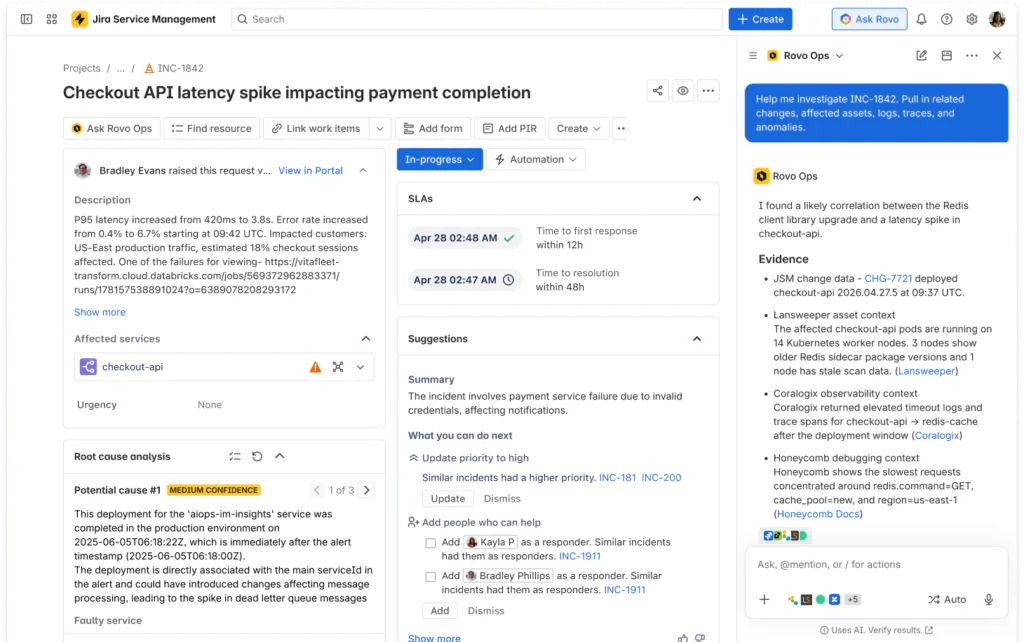
When an incident is created in Jira Service Management, Rovo queries Coralogix for relevant telemetry within the incident’s time window and affected services. Logs, metrics, traces, security alerts, and anomalies, including structured fields and correlated events, are displayed in a panel alongside the incident.
This changes the starting point for every investigation. Instead of spending the first minutes locating data across tools, the responder begins with a complete picture. Investigation starts at understanding, not discovery.
With telemetry in context, Rovo invokes Coralogix’s streaming analytics to correlate patterns across the full telemetry surface. It returns a hypothesized root cause and suggested remediation steps directly inside the Jira Service Management issue.
Coralogix analyzes patterns in real time across all event types, surfacing connections that would take a human operator considerably longer to assemble. For the engineer, this provides a starting point for resolution rather than more data to sift through. For the team, it means faster, more consistent outcomes, even when the person on call isn’t the one who built the system.
After resolution, the integration pulls a consolidated timeline of logs, security events, key metrics, and incident details, and pushes it into Confluence. The result is a post-incident review that is operationally useful and audit-ready, generated without anyone having to manually compile a retrospective.
Most teams recognize the value of post-incident reviews but struggle to do them consistently. When the review assembles itself from the data, learning becomes a default rather than a burden. Over time, this builds a searchable library of incidents, root causes, and resolutions, making recurring patterns visible and easier to address at the source.
The capabilities described above are powered by how Coralogix was built. Most observability platforms were designed for human-driven queries: an engineer writes a search, scans results, refines, and repeats. AI agents need to filter, correlate, and reason across data types in a single operation. Coralogix was built to support both:
This same architecture is what makes observability at scale economically viable. Coralogix decouples data queryability from indexing cost, so teams retain full-fidelity data without the exponential price tag that typically comes with scaling. When an AI agent investigates an incident, it works with complete data, not a cost-constrained subset.
The architecture supports both human-to-AI interactions, an SRE asking Coralogix’s AI assistant to investigate a spike, and agent-to-agent workflows, where Atlassian’s Rovo pulls correlated telemetry from Coralogix autonomously. The MCP foundation makes both modes native to the Atlassian platform.
The result is an organizational intelligence layer inside the Atlassian ecosystem: not just surfacing what’s happening, but helping teams understand why and what to do about it, without leaving the incident.
Beyond individual incidents, the integration addresses several systemic challenges:
Reduced mean time to resolution. When observability data is already present in the incident, investigation starts immediately. When AI-driven analysis provides a hypothesis, resolution follows faster. The minutes saved on each incident compound across hundreds of incidents per quarter.
Lower cognitive load on responders. Keeping engineers in a single workspace during high-pressure incidents reduces errors and fatigue. Context travels with the incident, so the responder doesn’t have to.
Continuous improvement without extra process. Automated reviews in Confluence mean teams learn from every incident. No scheduling overhead, no retrospectives that never happen. The knowledge base builds itself.
Observability costs that scale. Deep visibility doesn’t have to mean runaway costs. Coralogix’s architecture keeps spend predictable as environments grow, so the telemetry flowing into Jira Service Management represents complete coverage, not a sampled fraction.
The Coralogix and Atlassian integration is part of a broader expansion of Atlassian’s AIOps partner ecosystem at Team ’26. Sign up for the Early Access Program to get an early look at the integration and help shape how observability and incident management work together.
We’ll be at Team ’26 in Anaheim, May 5-7. Come find us to see the integration in action.
此内容由惯性聚合(RSS阅读器)自动聚合整理,仅供阅读参考。 原文来自 — 版权归原作者所有。