









The new interface into production telemetry is a tool call, made from whichever agent runtime the operator happens to be using at that moment. A finance lead in Claude Code, a product manager in Cursor, an engineer in Codex. Three different jobs, three different agents, three different reasoning loops. The thing they have in common is the data layer underneath. If that layer was built for dashboards, the agent overflows its context, hallucinates the schema, or burns thousands of dollars in tokens retrieving raw data it then has to summarize. If that layer was built for agents, the agent gets a small structured answer and moves on.
The Coralogix CLI (cx) is that data layer, exposed as a binary any agent can call. Below are three workflows run against the same Coralogix tenant this morning. Let’s explore these three use cases, to see how the Coralogix CLI has added both production intelligence and autonomous remediation to the Claude Code agent.
The FinOps lead’s standing question is straightforward. Where is observability cost going, and which applications are pulling more weight than they should? Two years ago that question started in a UI. Today it starts in Claude Code.
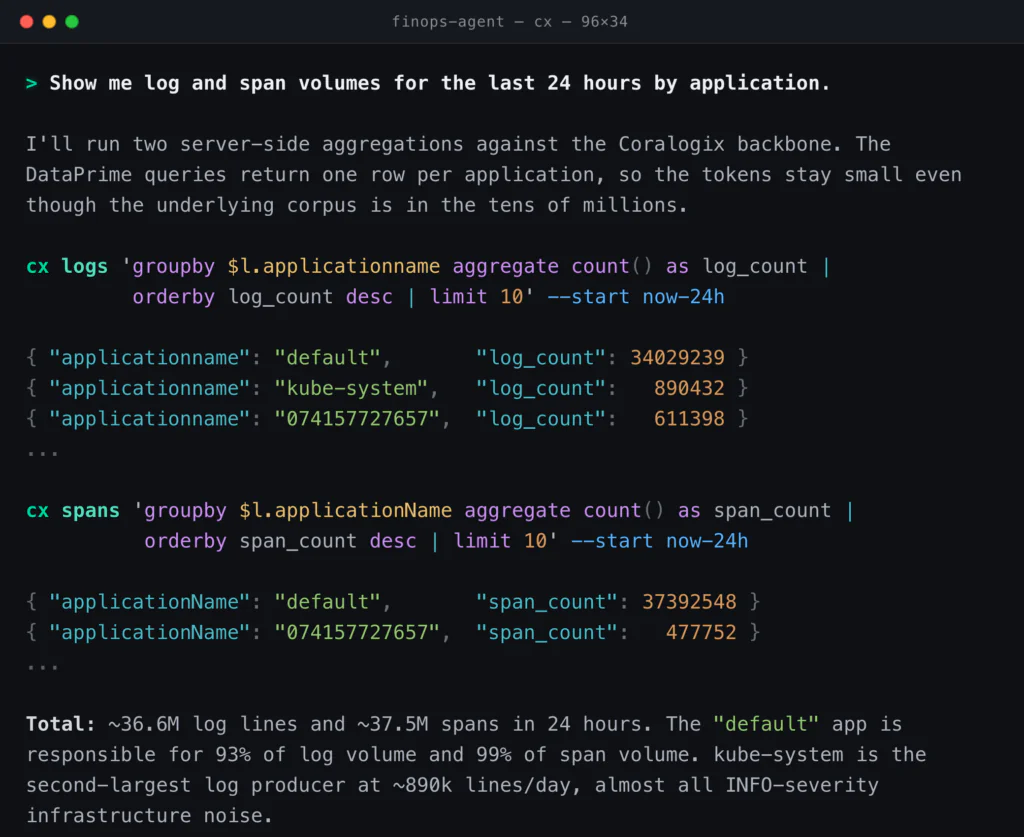
Underneath, this is server-side aggregation through DataPrime and the Distributed Query Engine. The agent never holds thirty-six million log lines in its context window. It sends a groupby, gets ten rows back, and spends maybe two hundred output tokens reading them. Published agent benchmarks measure agent systems consuming ten to one hundred times the tokens of the underlying model when they retrieve raw data. Aggregating before returning is what closes that gap. Compressed ingestion is the only billing dimension at Coralogix, so the FinOps agent can issue thousands of queries a day without per-query meter risk.
Thanks to in-stream processing, the FinOps agent can immediately remediate without losing coverage or blocking crucial data. The kube-system data is currently being ingested in Frequent Search. Coralogix’s TCO Optimizer routes data into three priority tiers: Frequent Search (hot, OpenSearch-backed, fastest queries), Monitoring (customer-owned S3, queryable via DataPrime in seconds with no rehydration, with full alerting and dashboarding), and Compliance (customer-owned S3, long retention). Moving kube-system from Frequent Search to Monitoring keeps full coverage, full DataPrime querying, and full alerting. What changes is how often the data is touched at hot-storage prices, and the agent does the rebalance directly:
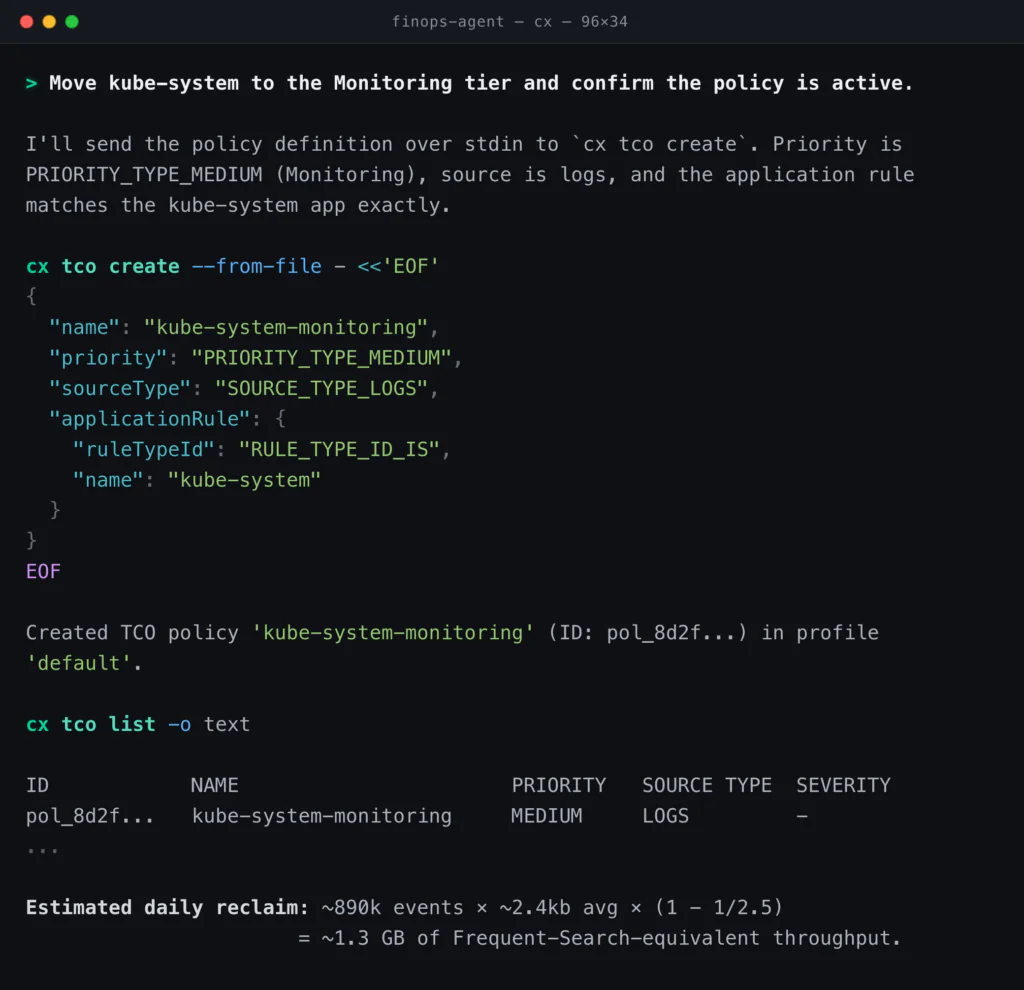
Coverage holds. DataPrime queries still run against the kube-system data, alerts still fire, and the data still sits in the customer’s own S3 bucket in open Parquet where it always did. What changed is the price of touching it.
The product manager’s standing question is utilization. How many real users hit the site this week, where do they bounce, and why? The honest version of that question requires Real User Monitoring data, and learning a new query language to ask it has historically been the friction.
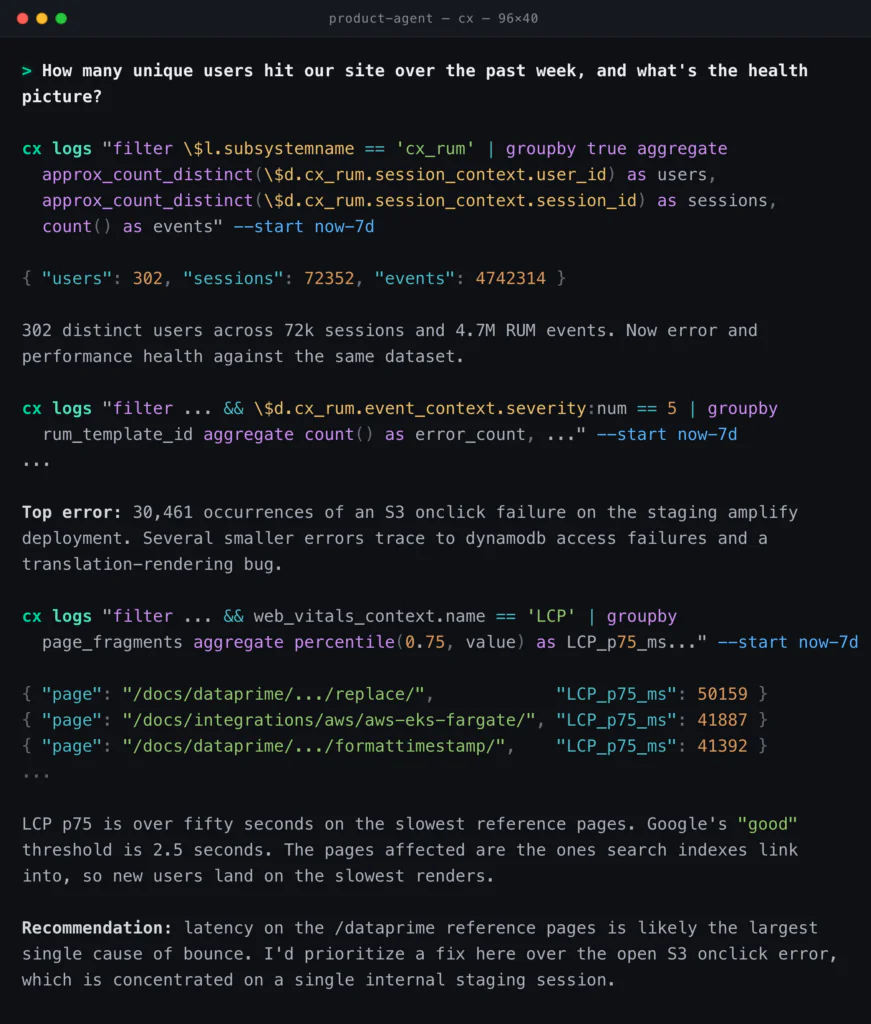
The rum skill is what makes that conversation work. It teaches the agent the RUM data model: event types, severity 5 as the universal error marker, rum_template_id as the error fingerprint, and Web Vitals names like Largest Contentful Paint (LCP) and Load Time (LT) as the things to ask about. It teaches the agent how to ask, not what is wrong. Underneath, RUM is regular logs in a cx_rum subsystem, queried with the same DataPrime that drives every other surface. The semantic layer answers low-volume metadata queries cheaply, so the agent composes a more expensive aggregate against confirmed field paths instead of fishing. Stanford, SambaNova, and Berkeley’s Agentic Context Engineering paper measured a 17.1 percentage point AppWorld accuracy gain from context engineering alone, no model change. The skills are that engineering, packaged as recipes the agent loads on demand through npx skills add coralogix/cx-cli.
The product manager reprioritizes the backlog. The latency is doing more damage than the noisy error count suggested, and the answer was reachable in one conversation.
The engineer is two hours from running an online migration on the orders database. The checklist has one open item: confirm the database is not already on fire. The agent will compose the queries; the engineer reads the answer.
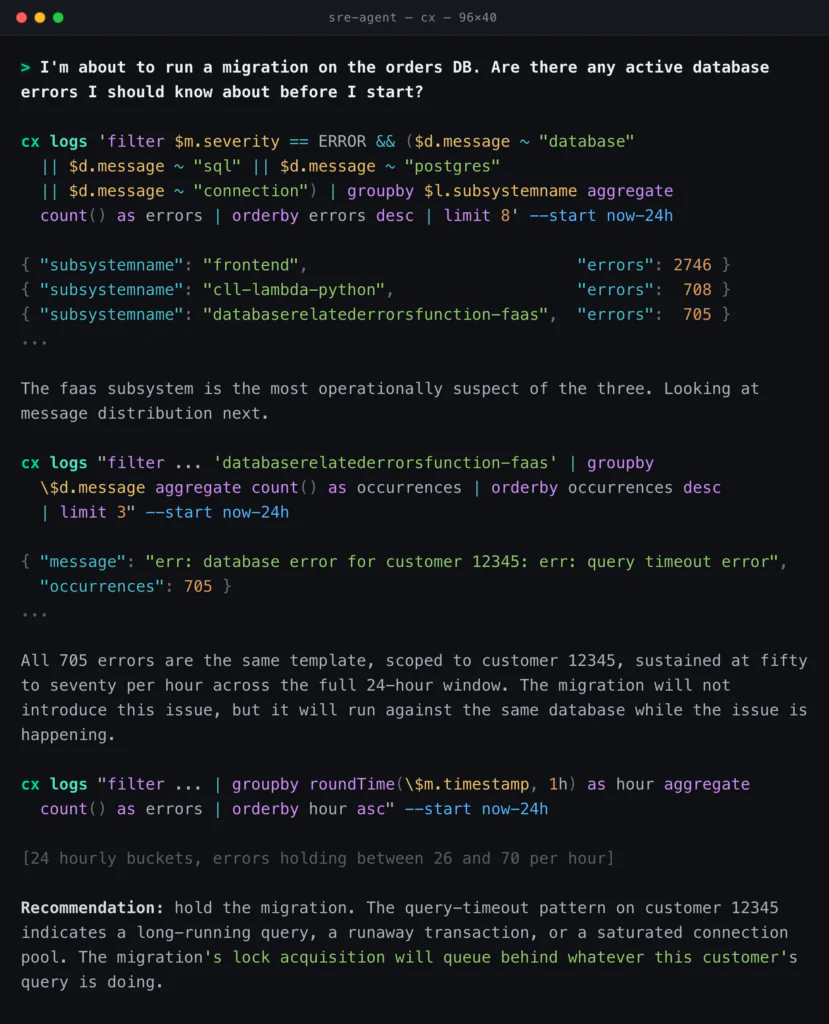
The mechanism behind this is cx search-fields, which lets the agent find the right field path semantically before it filters, so the wildcard match against $d.message is a fallback rather than a fishing expedition. The agents output mode (-o agents) returns TOON-encoded results with metadata stripped and auto-spill to a temp file when the payload exceeds 100 KiB. The engineer’s agent can run twenty queries in series, follow a hypothesis, and not blow its context.
The migration does not run until the customer 12345 issue is understood. The terminal got the engineer to that conclusion in under a minute.
The Coralogix CLI enriches any agent with full, token efficient access to all customer intelligence in the Coralogix platform, powered by the Distributed Query Engine for server-side aggregation, the semantic layer for cheap field discovery, agent-shaped output through TOON, multi-profile fan-out for cross-region answers, and the skills bundle that ships these recipes to forty-plus coding agents. The data lives in customer-owned object storage in open Parquet & Open TSDB, and Coralogix is the query and control plane for it.
Quesma’s analysis of SWE-Bench Pro found a 22 percentage point swing between basic and optimized agent scaffolds with the same model weights. The CLI is part of that scaffold. So is the skill that taught the agent how to compose the query in the first place. Ensuring that your models have access to the correct data, in an effective and token efficient way, is the best impact you can have on agent performance today.
The Coralogix CLI can be installed by following our documentation today, with prebuilt skills for over 40 agents, and the ability to access every single Coralogix API. This single tool call brings production reality and autonomous remediation to all of your agents, regardless of the use case, with minimal token footprint.
此内容由惯性聚合(RSS阅读器)自动聚合整理,仅供阅读参考。 原文来自 — 版权归原作者所有。