







In a high-pressure incident, speed is everything. During incidents, engineers often jump between tools like traces, logs, and metrics, losing context at every step. This ruins the investigation state, slows down the process, and increases MTTR.
The Trace Drilldown is a new capability designed to eliminate this friction. It provides a side-by-side workspace that keeps the investigation in context. It maintains a consistent Action Bar across every view, giving users the ability to master a repeatable Find → Focus → Navigate workflow. The workflow is saved as users switch between Dependencies, Flame, and Gantt visualizations. Most importantly, the Drilldown brings Related Data (correlated logs, events, profiling, infrastructure, and AI Sessions) directly into the flow. This improves root cause justification without ever leaving the trace.
The Info Panel acts as a high-density sidebar, automatically surfacing metadata like span type, service, and performance context to identify an operation’s role without raw attribute hunting. An integrated duration heatmap visualizes the last 6–24 hours of performance, allowing you to instantly identify if a span is out of range compared to similar spans. This heatmap highlights field distribution to help you quickly spot anomalies or P90+ outliers compared to historical performance. Using integrated quick actions, you can pivot directly from the heatmap to create alerts or check resource-level infrastructure metrics for CPU or memory pressure.
The Trace Drilldown transforms a static list of spans into a side-by-side, three-pillar workspace that keeps evidence, visuals, and metadata in a single frame.
Data is only as good as your ability to interpret it. The Trace Drilldown provides three distinct lenses (Dependencies, Flame, and Gantt) to analyze the same request. Knowing when to switch between them is the secret to cutting your MTTR.
Use this first to map the request flow and find the specific service boundary where a handoff is failing or stalling.
The Dependencies view offers two modes of certainty:
Pro Tip: Reading the Edges. Use Span Count to spot excessive repeated calls and Duration to find slow handoffs.
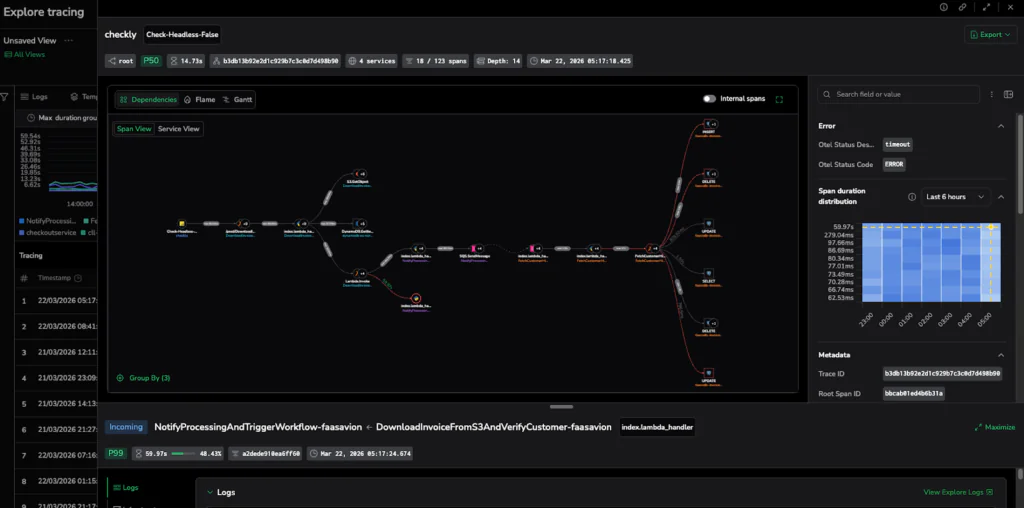
Caption: The Dependencies View reveals the architectural flow, highlighting the specific service-to-service handoff causing the stall.
Use this when you have identified a latency hotspot and need to determine which specific spans, operations, or downstream services are consuming the execution budget. Visualizing the trace in an aggregated hierarchy with the Flame view allows you to pinpoint exactly where time is being spent across your service boundaries.
To read a Flame graph, remember:
Pro Move: Turn on Highlight Errors, then scan for the widest horizontal bars that are also red. These are your dominant contributors to latency and failure.
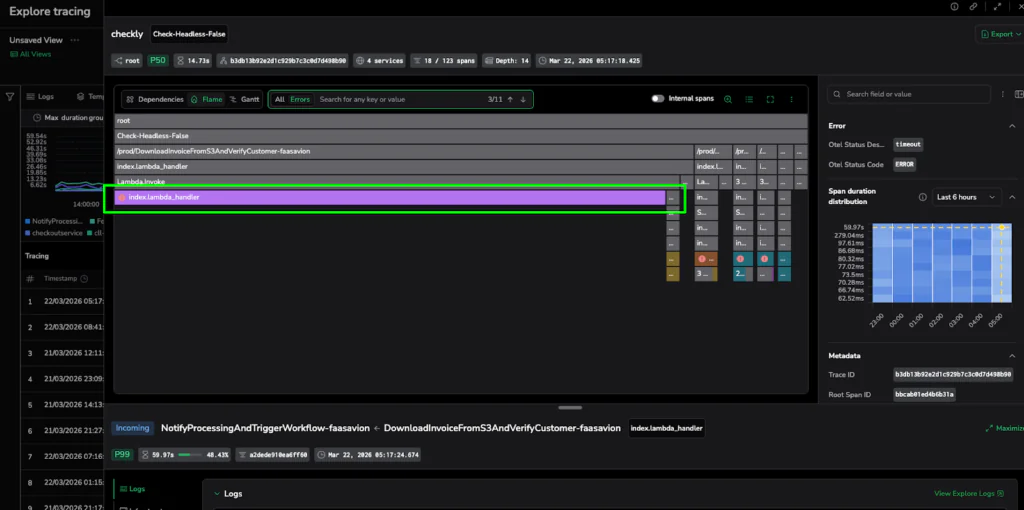
Caption: The Flame View isolates the latency hotspot: a single, wide purple bar representing a 60-second execution stall.
When to switch: Use this to confirm the timeline. While Flame shows cost, Gantt shows the exact sequence and concurrency of events.
Pro Move: If the Flame view suggests a hotspot, the Gantt view confirms if it’s a blocker. If a span has no overlap with others and is followed by a large gap, you’ve found a serial bottleneck that is stopping your entire request flow in its tracks. Use the Depth selector to instantly collapse or expand spans by their hierarchical level, allowing you to visualize the execution depth and manage the complexity of deeply nested traces.
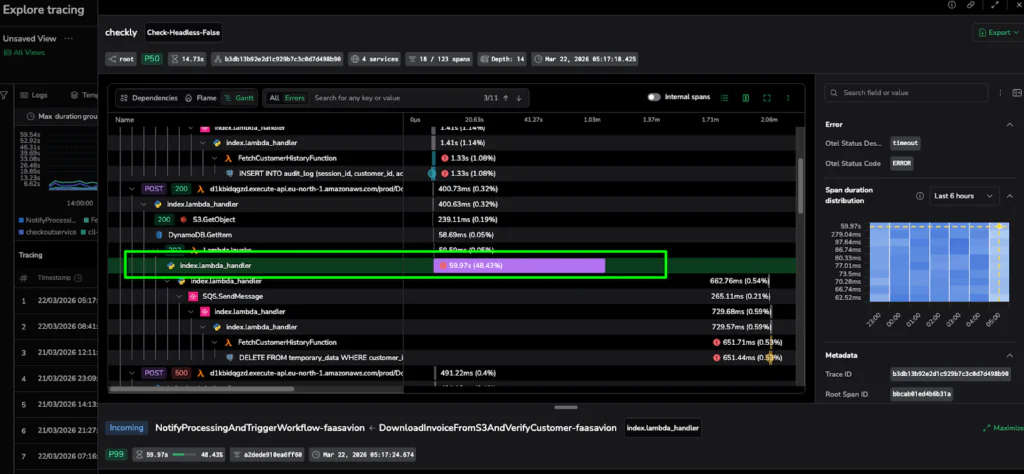
Caption: The Gantt View provides the timeline proof, showing exactly where the execution sequence stopped for nearly a minute.
Visualization identifies the suspect; correlated data provides the proof. The Trace Drilldown surfaces relevant telemetry in context so you can confirm the root cause without ever leaving the workspace.
Trace and span headers function as interactive shortcuts that display critical data to help you orient yourself instantly. Headers for top trace and secondary span surface relevant details, such as service diversity, span count, and specific error statuses, to provide a rapid understanding of the request. Beyond visibility, they act as functional pivots. With a single click, you can jump to APM Service Maps, view surrounding Explore Logs, or refine your dataset using Include/Exclude without ever rebuilding a query.
Access a direct line to evidence at the bottom of the drilldown:
Pro Insight: An empty “Related Logs” tab is often a signal in itself, indicating missing correlation IDs in your instrumentation rather than a lack of data.
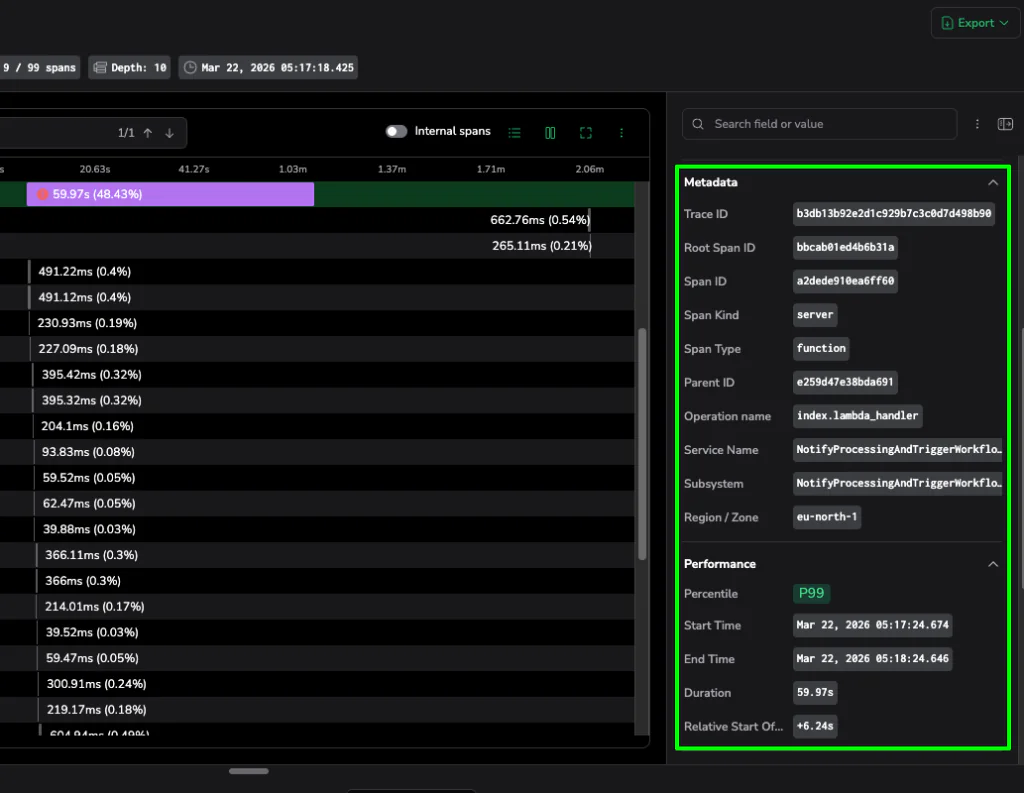
Caption: The Info Panel surfaces critical metadata like Trace IDs and P99 performance stats, providing the definitive evidence needed to solve the case.
The Trace Drilldown is more than a UI update; it is a shift in incident response. Keeping evidence adjacent to the visual addresses the one thing that truly kills MTTR: fragmented context.
This unified investigation experience preserves your investigation state across every pivot. With the Trace Drilldown, you will transform your incident response into a focused, efficient workflow. When the clock is ticking, Coralogix eliminates the noise and provides the clarity that you need the most.
To see how it works get a free trial now, or watch the demo below:
此内容由惯性聚合(RSS阅读器)自动聚合整理,仅供阅读参考。 原文来自 — 版权归原作者所有。