





It is 2 AM. Someone on-call gets paged. Conversion rates on the checkout page dropped 30 percent in the last hour. The immediate questions are familiar. Is this a JavaScript error? A slow API call? A broken third-party script? A performance regression that never throws an exception but quietly drives users away?
In most teams, answering those questions is not hard because the data is missing. It is hard because the investigation is split across too many places. You jump between the RUM dashboard, error tracking, Web Vitals, network requests, and user session context. You build a query, refine it, change the breakdown, and change the time window. The work becomes less about debugging and more about navigating.
Now imagine starting with a single question typed into your AI coding assistant:
“What are the top errors on the checkout page in the last hour, and how many users are affected?”
…and then getting a real answer from your production RUM data in seconds.
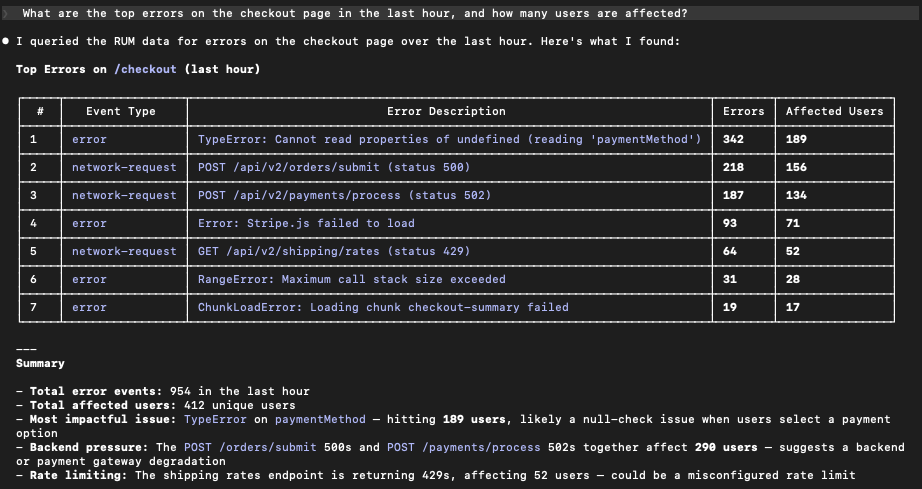
The Coralogix MCP Server connects MCP-compatible AI clients directly to Coralogix observability data. That includes assistants like Claude, Cursor, Windsurf, and any client that supports the Model Context Protocol (MCP).
With the latest update, that connection now extends to Real User Monitoring. In practice, this gives your assistant two capabilities that change the pace of investigation:
First, it can query live RUM data using natural language. You can ask about errors, performance signals, Web Vitals, network request behavior, and user interactions without starting by writing a query or remembering which fields to filter on.
Second, it can fetch current SDK documentation for Coralogix RUM SDKs, so setup and configuration questions are grounded in up-to-date published sources instead of memory or outdated snippets.
That combination matters because frontend and mobile debugging requires fast iteration. The best investigators don’t “run one query.” They ask a sequence of narrowing questions until the evidence is undeniable.
Most RUM investigations begin with triage. Something is broken and you need to know what, where, and how widespread. A prompt like this is usually enough to get the first high-signal view:
“What are the top JavaScript errors in our web app this week?”
The value is not just listing errors. It is returning results in a way engineers actually use, such as grouping by error fingerprint, ranking by affected users or sessions, and showing where the error happens most. From there, you iterate the way you would with a teammate:
Instead of spending ten minutes setting up the investigation, you spend just a couple of minutes narrowing down and isolating any events.
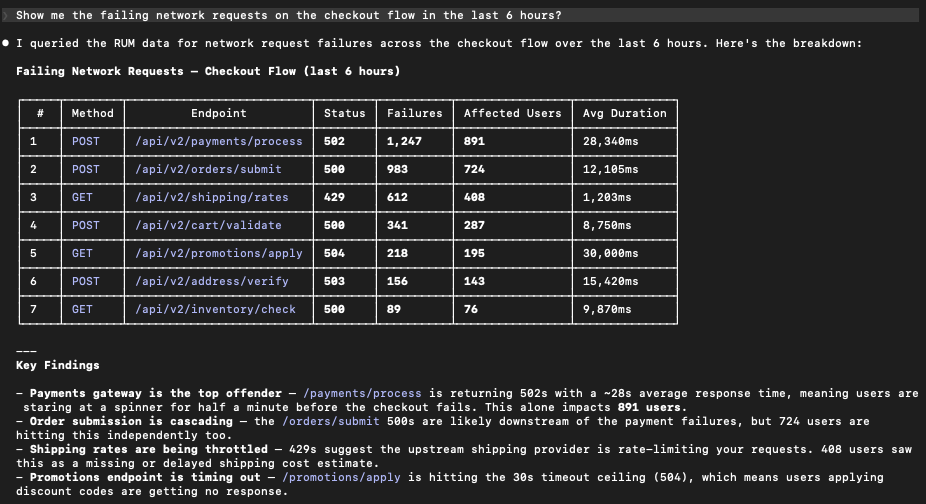
Frontend incidents are often symptoms of something upstream. A user does not experience a backend 500 error. They experience a spinner that never ends, a form that fails to submit, or a checkout step that times out. This is why network request questions are so often the bridge from a broken frontend to the actual failing service.
This is where a conversational workflow helps because you rarely know the right breakdown at the start. Each follow-up is a natural next question rather than a new dashboard.
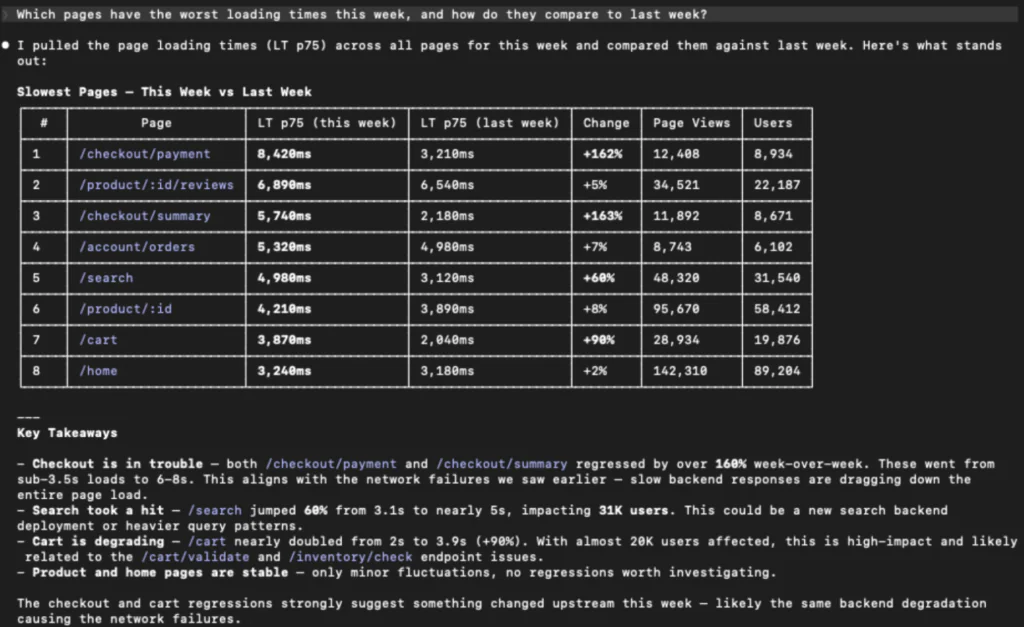
Performance issues are silent killers. They do not always generate errors, but they absolutely change behavior. Users bounce and conversion drops. With RUM connected through the MCP Server, performance investigations become easier to start and easier to repeat:
A conversational interface makes it practical to ask performance questions during an incident or a release review, rather than waiting for a scheduled performance deep dive.
Closing the loop: From investigation to codebase context
The true power of the Coralogix MCP Server is not just that it brings data to your AI. It is that it brings that data into an environment like Cursor, Windsurf, or Claude Dev that already has a map of your entire codebase.
In a traditional workflow, the investigation and the fix are two separate continents. You find the error in a dashboard, and then you go hunting through your directories to find the file, the component, and the logic that caused it. When your AI assistant lives in your editor and has access to Coralogix RUM via MCP, that gap vanishes. It becomes a closed-loop system:
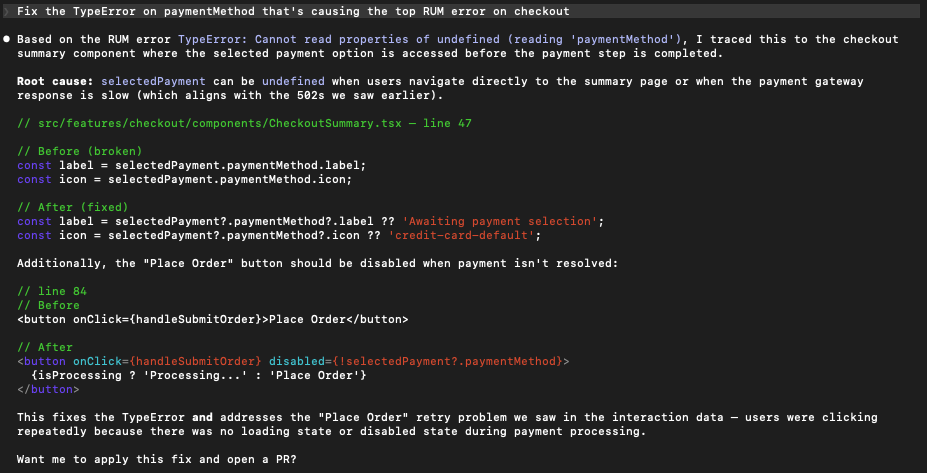
Because the agent knows the context of your project, it can suggest or even apply the fix based on the real-world evidence it just pulled from Coralogix. This moves you from insight to pull request in a single conversation.
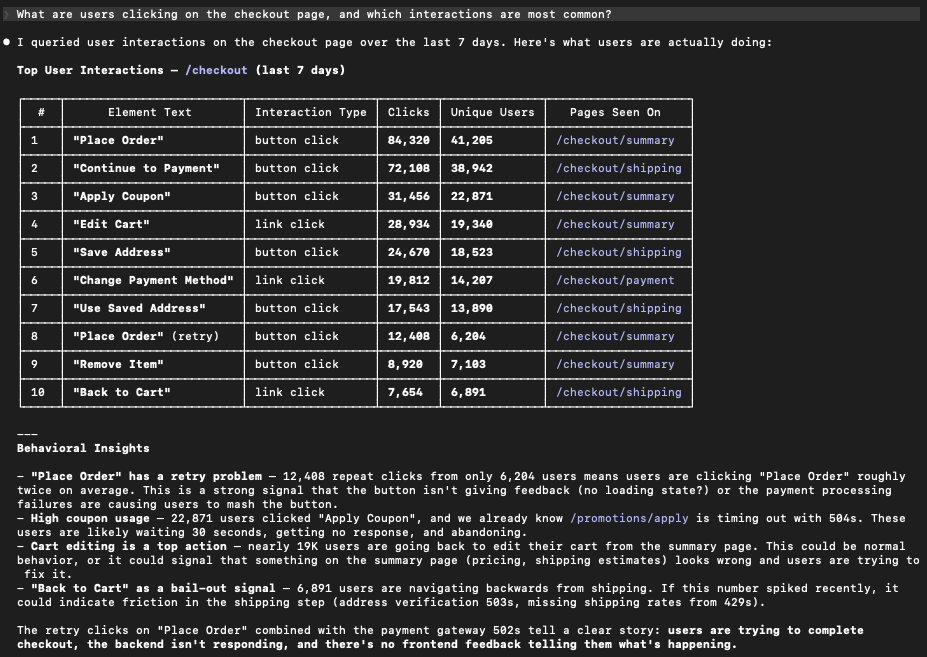
When conversion drops, the most useful question is not always “what error happened.” Sometimes it is “what were users doing when this started?”
RUM captures interaction and navigation context that can quickly validate whether a flow is breaking in a specific step:
“What are users clicking on the checkout page?”
“What are the most common interactions on the onboarding flow?”
“Which fields do users interact with most on the signup form?”
This is not a replacement for a full product analytics program. It is a way to pull behavioral context into engineering investigations without having to pre-build funnels and dashboards for every question.
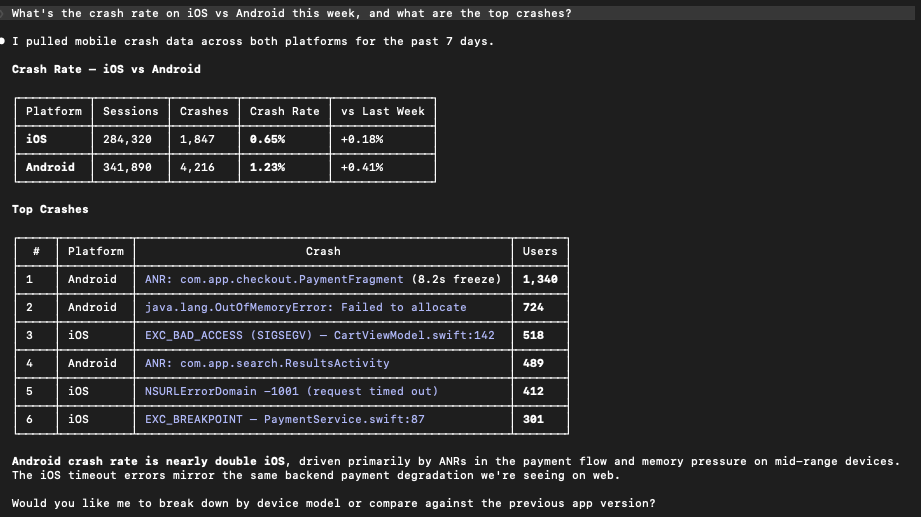
Mobile debugging comes with its own complexity including platform differences, device variability, and crashes that cannot be reproduced locally. The benefit of connecting RUM through MCP is that the workflow stays the same across Android, iOS, React Native, and Flutter.
You ask questions in the same style regarding crash rates, ANR issues, or memory usage. You do not need a different mental model per platform. You keep the same loop of question, evidence, and refinement.
Incidents are only half the story. The other half is making sure the next incident is easier to debug. This means better instrumentation and readable stack traces.
In the same place you ask what is happening, you can ask how to set up Coralogix RUM in your React app or how to upload source maps so production stack traces are readable. Instead of interrupting an engineering workflow to hunt for the right documentation, you can keep momentum and get actionable setup guidance immediately.
During a real incident, the biggest win is compressing the time between “we see impact” and “we have validated evidence.”
A typical sequence might look like:
The point is not that the assistant magically fixes incidents. The point is that it removes friction between the question in your head and the data you need to answer it, so you can spend time reasoning instead of navigating.
If you already use the Coralogix MCP Server with your AI assistant, the RUM capabilities are available through the same workflow. Start with a question from a real incident and iterate.
If you are new to it:
“What are the top frontend errors affecting users this week?”
To explore the code, contribute, or report issues:
https://github.com/coralogix/ws-ai-mcp
Beyond investigation: Closing the loop with codebase context
The true power of the Coralogix MCP Server isn’t just that it brings data to your AI; it’s that it brings that data into an environment—like Cursor, or Claude Code—that already has a map of your entire codebase.
In a traditional workflow, the “investigation” and the “fix” are two separate continents. You find the error in a dashboard, then you go hunting through your directories to find the file, the component, and the logic that caused it.
When your AI assistant lives in your editor and has access to Coralogix RUM via MCP, that gap vanishes. It’s a closed-loop system:
From insight to pull request
Because the agent knows the context of your project, it can suggest (or even apply) the fix based on the real-world evidence it just pulled from Coralogix.
Learn more in our docs.
此内容由惯性聚合(RSS阅读器)自动聚合整理,仅供阅读参考。 原文来自 — 版权归原作者所有。