









Traditionally, achieving deep visibility into distributed systems required significant trade-offs in engineering time. Collecting meaningful application metrics and traces required teams to embed language-specific agents, modify source code, or manage complex library dependencies across every service. Some organizations manage hundreds of microservices manually, creating a massive operational burden characterized by constant maintenance, version conflicts, and black box components that remain unmonitored because their internal code cannot be modified.
This post is the first in a two-part series exploring how eBPF technology eliminates these hurdles. In this first installment, we examine the strategic shift from manual instrumentation to the “zero-code” automation provided by Coralogix OBI (OpenTelemetry eBPF-based instrumentation). A recent OpenTelemetry write-up highlights a great example of this approach in practice as OBI’s new HTTP header enrichment adds request context to spans via OBI configuration with no application rebuild required.
In the second blog, we will provide a technical deep dive into how these same principles solve real-world database latency challenges, specifically for Couchbase environments. Together, these posts demonstrate how to transition from a manual process to a model of immediate, system-wide observability.
The OpenTelemetry eBPF Agent, often referred to as OBI, is part of the OpenTelemetry eBPF instrumentation effort, with major contributions from Coralogix and the community. This vendor-neutral, open-source agent allows applications to execute custom logic within the Linux kernel safely. Operating at this level allows OBI to capture trace spans for Linux-based HTTP/S and gRPC services, without requiring application code changes.
To achieve comprehensive cluster-wide observability, the OBI agent is deployed as a DaemonSet. This ensures that every node in your Kubernetes cluster has an active monitoring presence that scales automatically as your cluster grows. From this vantage point, OBI provides broad visibility into service-to-service network traffic and request flows across the cluster. It uses Kubernetes metadata to automatically assign service names, enriching your telemetry with critical orchestration context.
OBI delivers a powerful observability layer with a minimal system footprint:
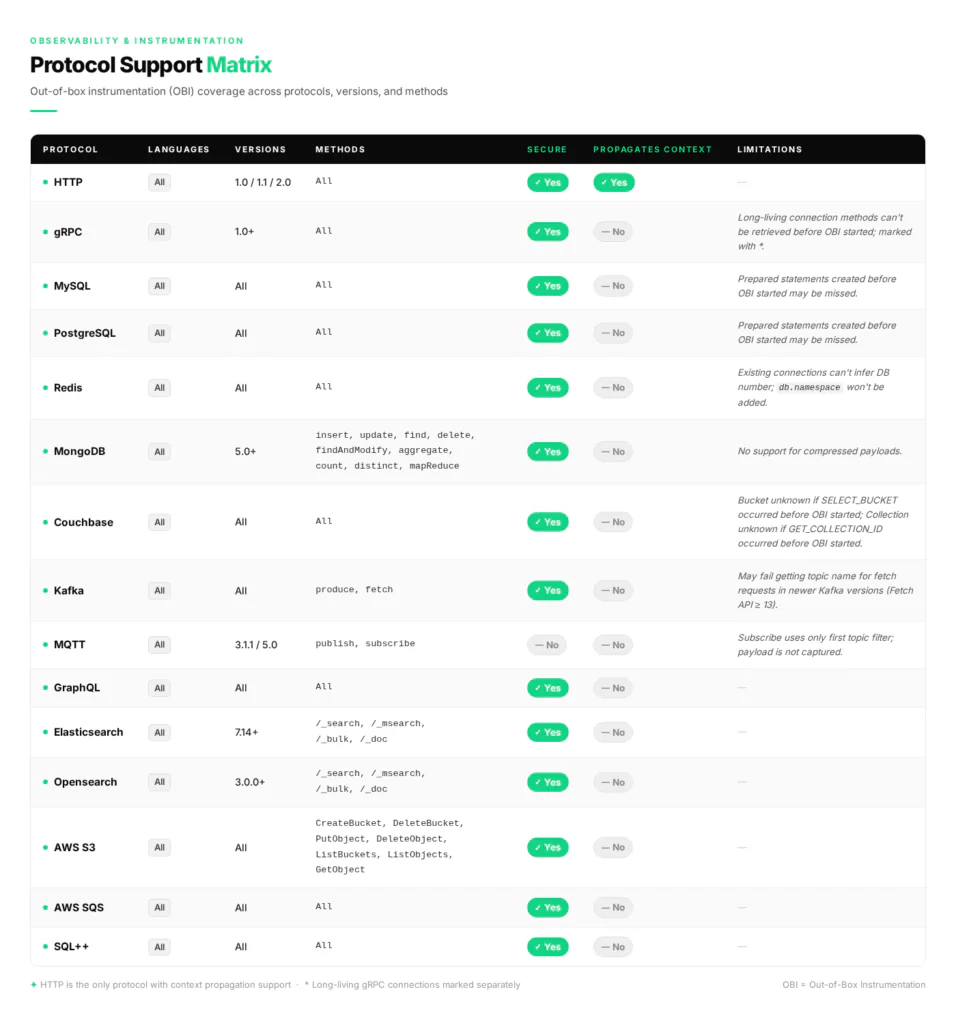
Beyond the technical novelty of eBPF, OBI provides a significant strategic advantage for engineering and operations teams by removing the friction typical of traditional APM.
In a traditional monitoring setup, gaining visibility into a new service can take days or weeks of development effort, involving code changes, library updates, and deployment cycles. With OBI, monitoring starts immediately upon deployment. Capturing metrics and events directly from the kernel allows OBI to bypass the need to instrument or redeploy individual applications. This allows teams to gain instant insights into performance and errors as soon as the OBI agent is active on the cluster.
One practical example is incident response. OpenTelemetry recently introduced HTTP header enrichment in OBI v0.7.0, which allows spans to carry request context like tenant or user segment through a simple OBI config update. Teams will quickly narrow an incident from “error rate is up” to “this is isolated to one cohort,” without touching the application code.
Traditional instrumentation often relies on invasive bytecode manipulation or sidecars that consume significant CPU and memory. OBI leverages high-efficiency eBPF probes to collect traces and metrics with remarkably low system overhead. It operates outside the application runtime, avoiding the performance penalties associated with traditional agents, making it a highly effective choice for modern, production-grade observability.
One of the most persistent challenges in enterprise observability is monitoring legacy systems or proprietary, closed-source software, where adding SDKs or modifying code is impossible. eBPF shines in these environments by attaching directly to system calls and network events at the kernel level. This allows OBI to capture relevant performance data regardless of the application type, language, or compatibility with modern instrumentation libraries. This capability is crucial for heterogeneous environments, ensuring that uninstrumented services no longer remain “blind spots” in your architecture.
A primary advantage of Coralogix OBI is its strict adherence to OpenTelemetry (OTel) standards. Utilizing OTel semantic conventions means the data captured at the kernel level is enriched with standardized metadata, ensuring that your telemetry is consistent with the broader observability ecosystem. This vendor-neutral approach means that the metrics and spans generated by OBI can be gathered and processed by any standard OpenTelemetry collector before being sent to Coralogix.
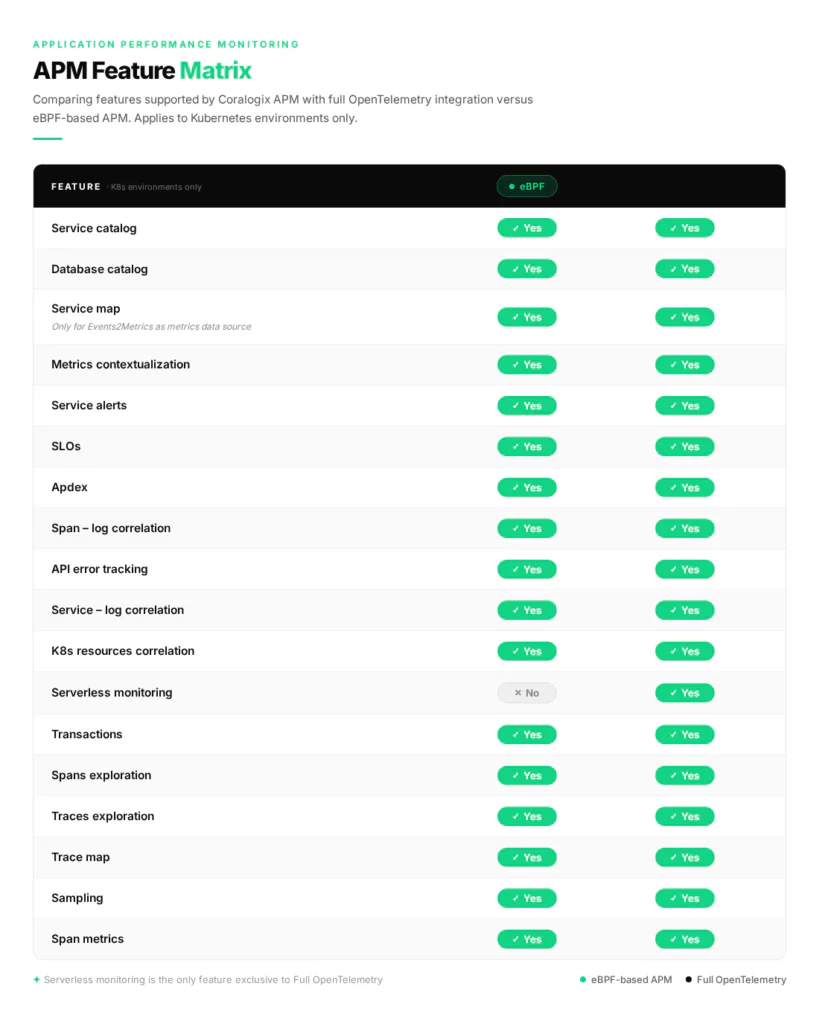
Enterprise Feature Parity There is a common misconception that eBPF-based auto-instrumentation provides only a “high-level” overview. However, the Coralogix APM feature matrix reveals that OBI delivers significant parity with full SDK-based instrumentation. For Kubernetes environments, OBI supports the same critical performance and reliability tools used by SRE teams:
The shift from manual, agent-heavy instrumentation to kernel-level observability represents a fundamental change in how we manage modern infrastructure. By leveraging eBPF through Coralogix OBI, organizations can finally move away from the high-maintenance cycle of code modifications and library updates. Instead, they can achieve scalable, vendor-neutral observability that begins the moment a service is deployed, providing deep visibility across the entire stack—even for “black box” legacy systems that were previously impossible to monitor.
As environments grow more complex and heterogeneous, the ability to gain deep, system-wide visibility with a minimal footprint is no longer just a luxury; it is a strategic necessity for maintaining reliability and performance.
Experience the power of eBPF-driven insights with zero code changes. Set up OBI on your cluster today and unlock deep database forensics in less than 30 minutes.
In the next post, we’ll zoom in on database latency, showing how eBPF-based instrumentation closes the gap by observing database traffic from the Linux kernel with no application code changes. We’ll use Couchbase as the concrete example to illustrate how protocol-aware visibility can surface the operations and query patterns behind latency spikes, with telemetry flowing through OpenTelemetry for fast, end-to-end troubleshooting.
此内容由惯性聚合(RSS阅读器)自动聚合整理,仅供阅读参考。 原文来自 — 版权归原作者所有。