









eBPF and DB Monitoring Series Blog 2
In high-throughput database environments, a latency spike is rarely a simple story. Modern data layers are distributed, stateful, and constantly changing as shards move, nodes rebalance, caches warm, queries evolve, and connections churn. In practice, spikes usually come from one of three places:
For many SRE and Platform teams, the real challenge is disconnected tooling. As one engineering lead recently shared during a technical workshop:
“It’s all disconnected. If there’s an issue, then all of us will dig into our own tools to find the problem. We’re completely blind in terms of what’s happening to that ecosystem.”
That fragmentation creates a massive blind spot: Infrastructure teams see “healthy” CPU and memory on the database nodes, while application teams see 2-second response times in their traces. Without a bridge between the two, troubleshooting becomes slow, noisy, and frustrating. In the first part of this series, we explored how eBPF creates a unified vantage point for the entire cluster. Now, we’re putting that theory into practice to show exactly how kernel-level insights can dismantle the database blind spot in real-time.
In this post, we’ll use Couchbase as our concrete example because it perfectly stress tests the ‘blind spot’ problem: a distributed cluster with a complex mix of SQL++ (N1QL) and KV traffic.
However, the true power of eBPF-based instrumentation lies in its universal protocol awareness. While we use Couchbase as the running example, eBPF-based instrumentation can extend visibility across many common data-layer protocols. OBI supports protocol-aware insights for multiple databases and messaging systems (coverage varies by protocol and operation), helping teams standardize observability across the data layer.
Historically, closing this gap meant embedding language-specific agents or modifying source code to wrap database calls. That is a costly process in terms of engineering hours spent managing dependency drift, version conflicts, rollout coordination, and the inevitable blind spots (legacy services, third‑party binaries, and uneven agent coverage) in addition to runtime overhead.
OpenTelemetry eBPF instrumentation (OBI), with major contributions from Coralogix, shifts the vantage point from the application runtime to the Linux kernel. OBI observes database traffic at the kernel/syscall boundary and decodes supported protocols to enrich telemetry with database operation context. In our Couchbase example, that means monitoring SQL++ (N1QL) and KV operations without changing a single line of code or installing any database-side agent
Organizations are consolidating tools more than ever. This requires a monitoring layer that is as distributed as their data layer itself. That is, whether that’s a relational database, a NoSQL store, or a mix of both. the OBI agent achieves this by moving the observer from the application into the Linux kernel using eBPF.
The operational burden of traditional APM is a major friction point when managing hundreds of microservices. OBI eliminates this by deploying as a Kubernetes DaemonSet via Helm.
This approach ensures that every node in your cluster is automatically instrumented. OBI waits at the kernel level to capture outgoing database requests. When workloads scale or new services are spun up, you now have an automated safety net. Enterprises no longer have to worry about legacy services or third-party binaries becoming blind spots in their architecture.
A common misconception about eBPF is that it only provides “low-level” network data like IP addresses and byte counts. The truth about OpenTelemetry eBPF instrumentation is much deeper. OBI is protocol-aware, meaning it can understand database conversations in real time. This means not just that traffic happened, but what kind of operation it was and where it was headed.
In our Couchbase example, that means decoding the Couchbase binary protocol and SQL++ (N1QL) patterns in real time.
When a service issues a query, OBI intercepts the syscall and automatically enriches the resulting telemetry where available with:
This enrichment allows SREs to pivot from network spikes to real database hot spots in seconds.
The OBI agent strictly adheres to OpenTelemetry (OTel) standards. OBI emits OTel-compatible metrics and spans and can route them through a standard OpenTelemetry Collector before they reach any backend. This makes your instrumentation portable and keeps you aligned with OTel semantic conventions.
The metrics and spans generated by OBI flow through a standard OTel Collector before they even reach Coralogix. This ensures that your observability stack remains flexible and future-proof, allowing you to leverage the broader OTel ecosystem while benefiting from the high-fidelity insights provided by eBPF.
Identifying that a problem exists is easy; finding out why it’s happening in a distributed data layer is where the real work begins. Whether dealing with a relational database, a NoSQL store, or a mix of both, the pattern is the same: symptoms show up everywhere, but root cause hides in the gaps between teams and tools. The OBI agent streamlines this process by providing a direct path from a high-level alert to the specific request, service endpoint, and database query responsible.
In this post, we’ll use Couchbase as the concrete example because in a distributed Couchbase cluster, that gap between “infra looks fine” and “the app is timing out” shows up fast.
The first step in any investigation is often the most frustrating: finding the right dashboard. OBI eliminates this search by automatically populating the Database Catalog, creating a unified environment for your entire data layer.
OBI identifies your database instances and reports on their RED metrics (Rate, Errors, and Duration) without any manual configuration.
As seen in our catalog, a bottleneck becomes impossible to ignore. For instance, when a specific database, such as our billing_db in the example below, spikes to an average latency of 1.05s and logs 16.50K failures, it is instantly flagged. SREs can see at a glance which services are being impacted and which buckets are under pressure.
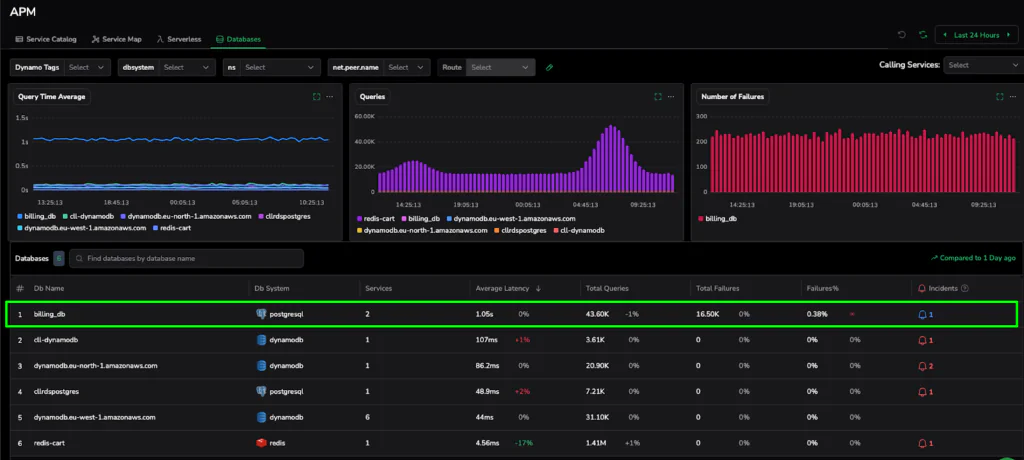
Figure 1: The Database Catalog automatically identifies high-latency hotspots across your cluster, providing a clear starting point for any investigation.
Once a bottleneck is identified in the catalog, OBI allows you to pivot directly into a Trace Deep-Dive. Aggregate metrics tell you something is slow; traces tell you what is slow.
When we drill into the high-latency period, we can isolate individual transactions. In our investigation, we see a distributed trace where the total request time is dominated by a single database operation. OBI captures the exact SQL++ (N1QL) statement being executed which reveals a query taking 1.98 seconds (33% of the total request time).
Because eBPF captures this at the kernel level, you get the actual query string (depending on protocol and configuration), including the SELECT or UPSERT logic, allowing DBAs to immediately begin optimization.
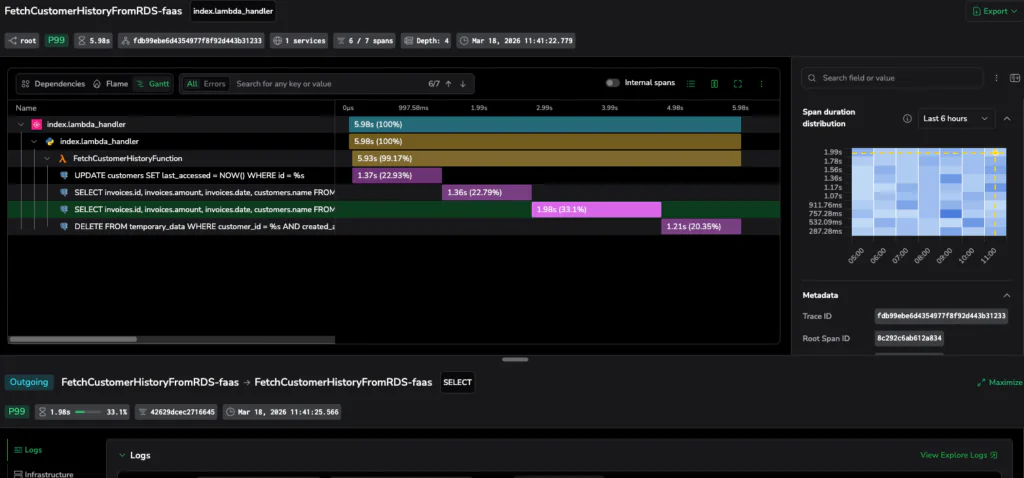
Figure 2: Moving from metric to trace. OBI identifies the exact query responsible for a 1.98s delay, providing the proof needed for a rapid fix.
The final piece of the puzzle is context. A slow query is often a symptom of an upstream application behavior like a retry loop or a batch process gone rogue.
OBI associates trace context at the kernel level, so Coralogix can correlate database spans with application traces and with logs when trace context is present in logs via your logging/collector configuration. In one view, you can see the application’s internal state, the specific query it sent, and the time the database took to respond. This unified perspective effectively slashes the Mean Time to Resolution (MTTR).
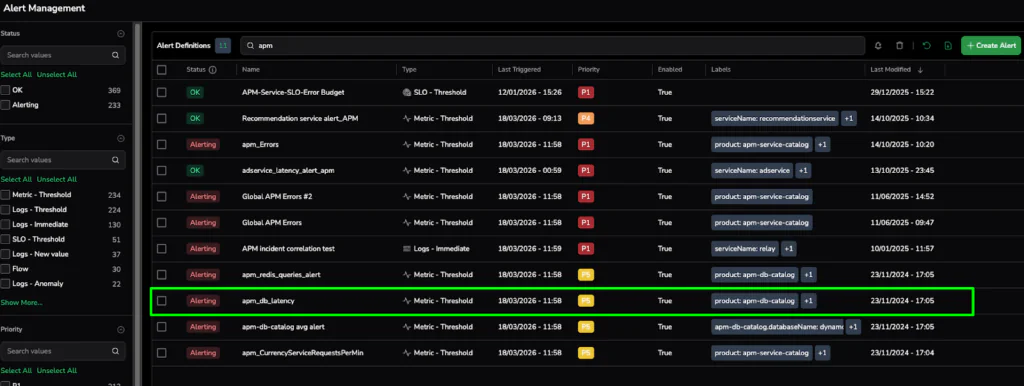
Figure 3: Proactive guardrails in action. The Alert Management screen shows active APM and database latency alerts, proving that OBI’s insights have been converted into 24/7 automated monitoring.
We have eliminated the blind spot between your application and your database layer. Shifting your monitoring strategy to the kernel level with eBPF eliminates the fragmented workflows that stall investigations and frustrate SRE teams.
If you are ready to see it for yourself, then stop guessing and start observing.
Deploy OBI in your Kubernetes cluster via Helm and start seeing real-time database performance signals in under 30 minutes.
OpenTelemetry and eBPF are trademarks of the Linux Foundation. OpenTelemetry eBPF instrumentation (OBI) is an open-source project; Coralogix is a primary contributor to the OBI codebase.
此内容由惯性聚合(RSS阅读器)自动聚合整理,仅供阅读参考。 原文来自 — 版权归原作者所有。