








Agentic coding tools like Claude Code and Codex have taken centre stage and inserted themselves into the critical path of software development. This shift has happened fast, and for most teams, the visibility hasn’t caught up. Until now we’ve been evaluating our vibe coding the same way – on vibes. You might say “this feels faster” or “that seems like a better approach”. That’s not going to scale. Agentic coding tools rapidly expand the rate of change, but they’ll just as quickly amplify inefficiencies.
We’ve always measured how we build software, and this is the next evolution of that. As agentic coding tools become more embedded in your software delivery process, the teams that get the most value won’t be the ones using it the most, it’ll be those who understand it the best.
There’s a hidden feature: you can now measure how software gets built, not just what gets deployed.
Not only are these tools generating code, but they’re also emitting valuable data using OpenTelemetry, such as token usage, tool latency, code changes, acceptance rates, and more. That means you already have the signals you need to measure, optimise, and scale how you use them.
Here’s how we took this hidden opportunity and started treating agentic coding tools as an observable part of the software development process.
Let’s take Claude Code as an example.
It’s embedded directly in your day to day workflow and has a clear impact on what gets written, how quickly changes happen, and what ultimately gets deployed. It’s not just an assistant anymore. At this stage, it’s closer to a production dependency – part of your CI/CD pipeline. If your pipeline was silently failing or slowing down, you’d want immediate visibility. If the path to production is blocked, that becomes an incident. But right now, most teams are using coding agents blindly, and letting a swathe of signals disappear into the ether.
The 2025 DORA Impact Report of Generative AI in Software Development found that for a 25% increase in AI adoption, individual developer productivity is expected to increase by 2.1%. While it may seem small, if this pattern is emulated across tens or hundreds of developers in your company, the compounding impact could be extensive. But, I believe you can do better than a 2.1% productivity increase.
You’re probably familiar with the DORA metrics – key performance indicators that measure software development speed and stability. Using agentic coding tools directly impacts these metrics:
The dramatic flourish with which we’ve adopted these tools means inefficiencies are amplified and can have just as much impact on these same metrics. Larger batch sizes, more complex code, quicker iteration cycles could all lead to instability.
Collecting telemetry from these tools gives you the context you need to correlate development behaviour with delivery metrics, and scale the positive impact they have on your business.
The DORA report found that AI improves code quality and code review speed, but can reduce delivery performance and stability.
Instead of looking at AI usage in isolation, you can correlate it with metrics like commit and PR throughput and token usage alongside lead time and deployment frequency to identify trends.
Some useful questions might be:
This is where you can identify bottlenecks in getting code deployed safely.
The acceptance vs rejection rate of AI-generated changes is one of the clearest signals of whether these tools are helping or hindering you.
If the rejection rate is high, or you notice it increasing over time, ask:
AI coding tools can be confidently wrong. When that output feeds into automation, mistakes can compound quickly.
The acceptance rate also impacts MTTR. A high acceptance rate is indicative that you would be able to fix an emergent issue more quickly – making this telemetry not just useful for measuring usage, but for auditing and improving how AI is used during high-pressure scenarios like incident response.
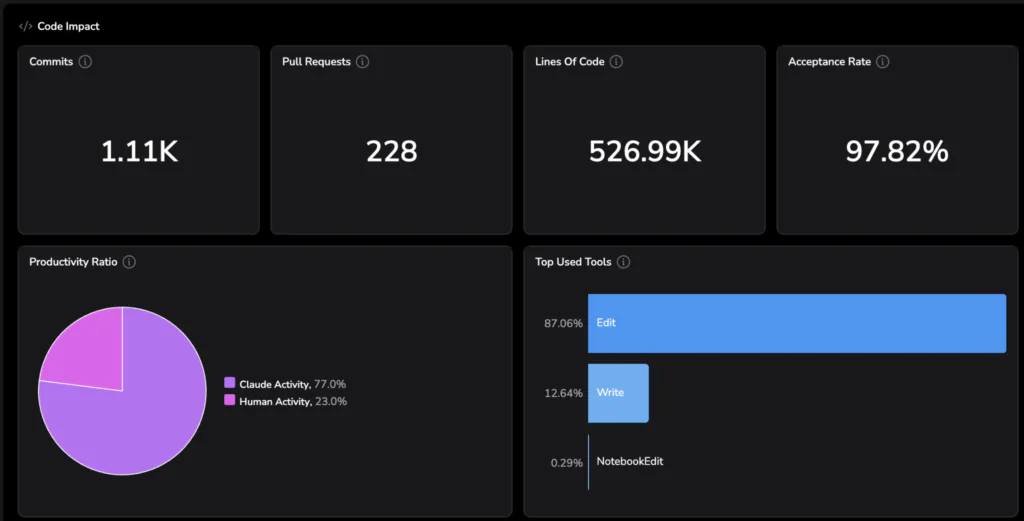
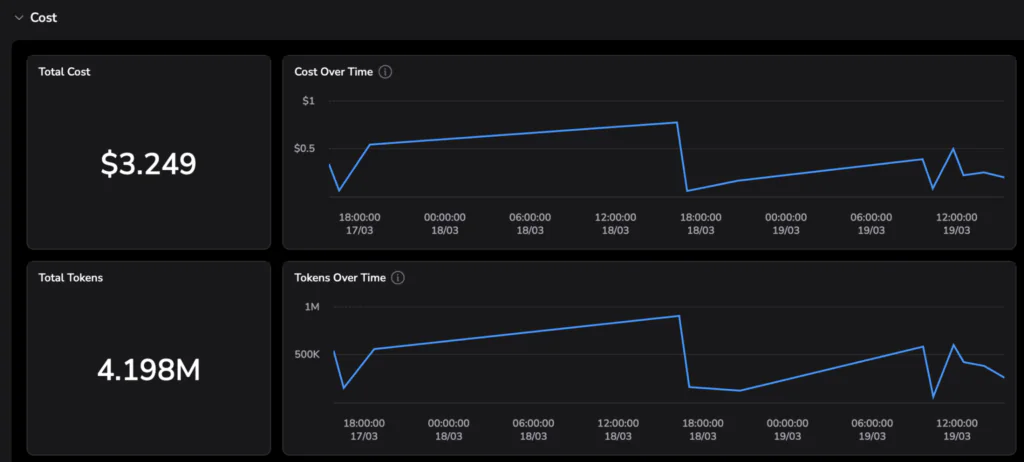
Using this data, you can correlate cost and output. For example:
Grouping metrics by tool, model or team helps answer questions like ‘which model is the most efficient?’ or ‘which team is using these tools in the most efficient way?’
For example, Model A might be cheaper, but require three times more iterations. Model B might cost more per request, but produce higher acceptance rates. Team 1 might have a lower token usage over time compared to Team 2, but their deployment frequencies are the same. Looking at these metrics in combination helps you avoid optimising for the wrong thing. Instead of guessing, you can standardise teams on the model that delivers the best output per unit of effort and cost.
You can treat your development workflow like a system and debug it the same way you would a production system. This is where OpenTelemetry traces come in.
For each interaction with a coding agent, each step taken by the agent is captured as a span.
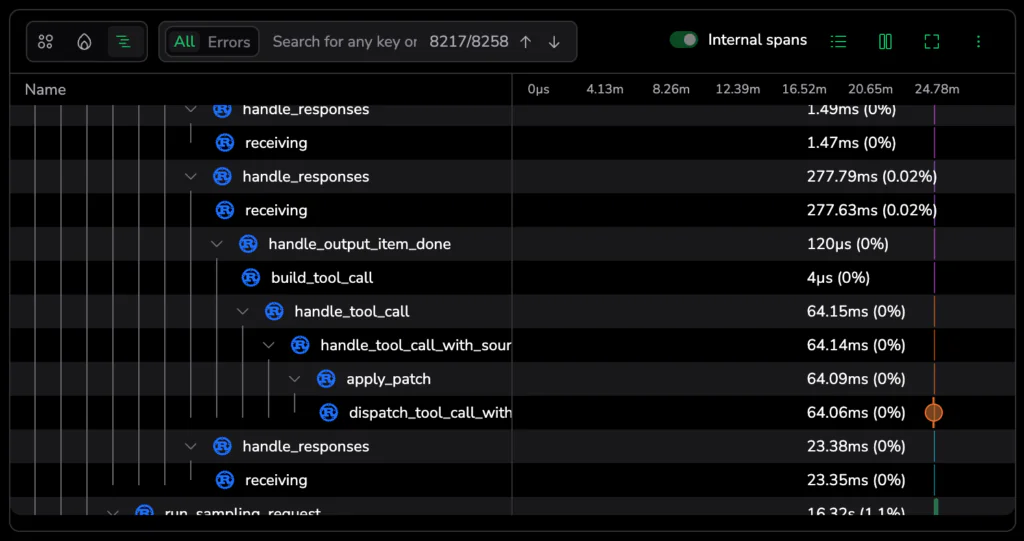
All of these spans are linked together into a single trace, giving you a full view of what happened during that interaction, like:
Track metrics like
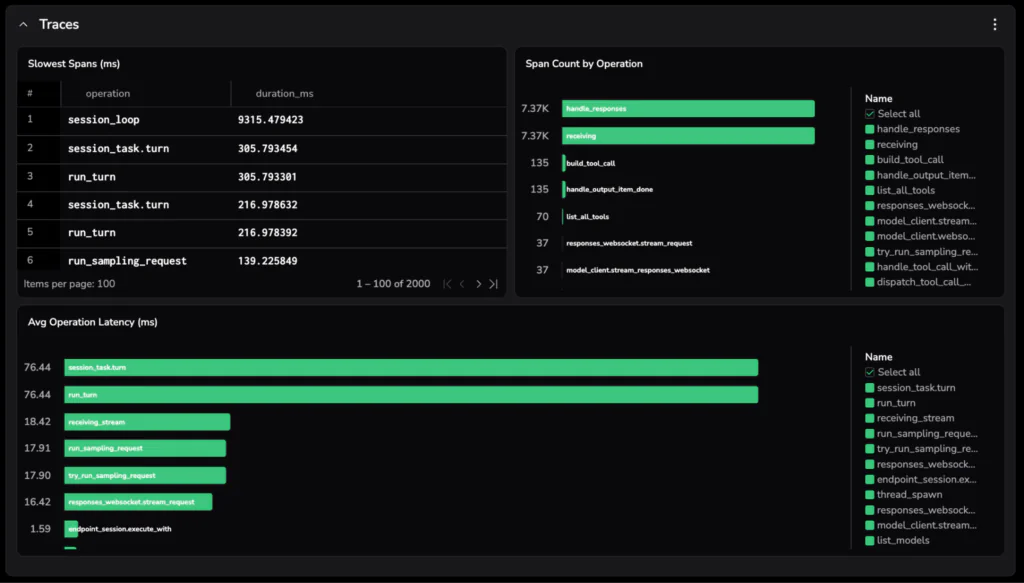
Identifying where improvements or changes can be made will help improve the developer experience. You can correlate this with adoption and usage rates too to track whether those changes are actually having an impact.
For example:
This is the best part – you don’t need to instrument anything. Telemetry is already being emitted, all you need to do is point it at an observability backend.
Let’s use Claude Code in this example, and ship telemetry to Coralogix. Coralogix is OpenTelemetry native, so you can easily send the data in the format it’s already emitted and observe it in the backend with no extra configuration.
git clone https://github.com/coralogix/ai-agent-instrumentation.git
cd ai-agent-instrumentation/claude-codeCopy the example environment file:
cp .env.example .envThen open .env and set:
CX_API_KEY -> your Coralogix Send Your Data API key
CX_OTLP_ENDPOINT -> your endpoint based on your Coralogix region, eg. ingress.eu2.coralogix.com:443. Change the region based on your Coralogix region.
source activate.sh
claudesource /path/to/claude-code/activate.shAttach team or environment data to every signal:
export OTEL_RESOURCE_ATTRIBUTES="cx.application.name=claude-code,cx.subsystem.name=claude-code-sessions,team=platform,env=prod"Team set up
If you’re using Claude for Teams or Enterprise, you can set up this integration to push to every developer straight away without any shell scripts, developer action, or .env distribution. Check out the documentation here on how to do that.
To see how to set this up for Codex, Gemini, or Open Claw, head to the documentation here.
Viewing Code Agents Observability
In Coralogix, head to the AI Center, then select the Code Agents tab. You can immediately see a high-level overview of how AI tools are being used across your organisation to understand adoption rates and costs. Scroll down to get more detail on cost, usage, and users.

Customising your data
The next thing you can do is create a custom dashboard from the pre-defined dashboard in the Coralogix AI Agent Instrumentation repository you already cloned. From the custom dashboards tab in Coralogix, click New and choose Import Dashboard. Copy in the contents of the json file. This will create a pre-populated dashboard. Edit the queries to generate the information most useful to you.
This is where you can tailor things to your team:
Learn more about how to use custom dashboards on Coralogix here.
Agentic coding tools aren’t just speeding things up, they’re changing how we build software. And anything that sits in your critical path shouldn’t be a black box.
Right now, a lot of teams are still going off instinct. It feels faster. It seems better. But that only gets you so far, especially as usage scales and the impact compounds.
Once you make your workflow observable, you stop guessing. You can actually see what’s helping, what’s slowing you down, and where things start to break.
The teams that get the most out of this won’t be the ones using AI the most. They’ll be the ones who understand how it behaves in their workflow, and adjust accordingly.
The data’s already there – you just have to start using it.
此内容由惯性聚合(RSS阅读器)自动聚合整理,仅供阅读参考。 原文来自 — 版权归原作者所有。