惯性聚合 高效追踪和阅读你感兴趣的博客、新闻、科技资讯
阅读原文 在惯性聚合中打开

推荐订阅源

Martin Fowler
Martin Fowler
CTFtime.org: upcoming CTF events
A
About on SuperTechFans
Apple Machine Learning Research
The Register - Security
Vercel News
Vercel News
H
Hackread – Cybersecurity News, Data Breaches, AI and More
人人都是产品经理
人人都是产品经理
MyScale Blog
MyScale Blog
云风的 BLOG
云风的 BLOG
博客园_首页
U
Unit 42
T
Tailwind CSS Blog
G
GRAHAM CLULEY
F
Full Disclosure
V
Vulnerabilities – Threatpost
T
Tenable Blog
月光博客
月光博客
P
Privacy & Cybersecurity Law Blog
P
Privacy International News Feed
K
Kaspersky official blog
Scott Helme
Scott Helme
cs.AI updates on arXiv.org
N
News and Events Feed by Topic
T
The Exploit Database - CXSecurity.com
N
News and Events Feed by Topic
有赞技术团队
有赞技术团队
Recent Commits to openclaw:main
L
LINUX DO - 最新话题
Recorded Future
Recorded Future
Application and Cybersecurity Blog
Help Net Security
Help Net Security
The GitHub Blog
The GitHub Blog
Cisco Talos Blog
Cisco Talos Blog
SecWiki News
SecWiki News
P
Proofpoint News Feed
Security Latest
Security Latest
cs.CL updates on arXiv.org
罗磊的独立博客
S
Security Affairs
M
MIT News - Artificial intelligence
L
LINUX DO - 热门话题
美团技术团队
Simon Willison's Weblog
T
Threat Research - Cisco Blogs
Stack Overflow Blog
Stack Overflow Blog
Forbes - Security
Forbes - Security
Hugging Face - Blog
Hugging Face - Blog
博客园 - Franky
V
Visual Studio Blog

Coralogix

Best Sentry Alternatives for Error Tracking (2026) Coralogix | Magic Quadrant 2025 How Redpin achieved full-stack observability across a £10 billion international payments platform - Coralogix Coralogix vs Sumo Logic: Pricing & Features Coralogix vs New Relic: Comparison Guide (2026) Where did all my Claude Code tokens go?  - Coralogix The AI bill arrived. Now what? - Coralogix The Data Plane Reality: OTel Scales, While Topology UX Lags - Coralogix The Observability Dataset: Architecture That Takes Agents From Junior to Senior - Coralogix Un-observable AI is Un-trustworthy AI - Coralogix Dataspaces and Datasets: A faster, goverened, observability data layer - Coralogix Stop Guessing Why Your Pods Are Crashing Coralogix Raises $200M to Scale the Observability Backbone for the Age of AI DataPrime at ingest (DPXL): See the impact of any routing decision New Explore: Faster answers, less friction, and a better way to investigate your data Explore for Spans: One View with Infinite Depth What Is Log Monitoring? Pipeline, Pitfalls, and Practices for 2026 What Is APM? A Guide to Application Performance Monitoring What Is an Incident Commander? Role, Skills, and Best Practices Managing OpenTelemetry at Scale: Why OTel Pipelines Need a Control Plane The cost of knowledge Introducing the Coralogix CLI: Headless Observability for Every Agent How the Coralogix CLI Adds Production Intelligence to Any Agent for Any Use Case Real-Time Database Monitoring: Solving Database Latency with Zero-Code eBPF Tracing Coralogix and Atlassian: Full-Stack observability inside the incident workflow - Coralogix Your Team is Using Claude Code. Do You Know What It’s Costing You? How Kotak811 Revolutionized Digital Banking Observability with Coralogix The Security Trifecta: Operationalizing API Protection with AWS, Wallarm, and Coralogix From Vibes to Signals: Observing Your AI Coding Workflow What “AI-Ready Data” actually means for observability teams DataPrime at Ingest: Fine-Grained TCO Routing with DPXL Agent-First Observability: Dynamic Data, High Cardinality, and the Business Impact Building Audit-Ready Observability for Digital Banking Debug frontend issues with AI: Real user monitoring meets the Coralogix MCP server The End of Manual Instrumentation: Scaling Observability with OTel OBI & Coralogix Evil Token: AI-Enabled Device Code Phishing Campaign Spending More, Seeing Less: How Indexing Limits Capital Markets Visibility Digital Trading: Why “Healthy Systems” Still Lose Trades From Trace to Root Cause: Mastering the new Trace Drilldown Coralogix Earns 196 Badges in G2 Spring 2026 Reports Across 15 Categories Bridging the gap between mobile experience and technical reality Monitor schema health with engine.schema_fields: Structure, Drift, and Volatility AWS GuardDuty Modules Explained: Features, Coverage, and How Customers Benefit with Coralogix The AWS logs you miss during an incident Slack, Teams & Google Chat in Your SIEM: Why Collaboration Audit Logs Matter
Code Agents Need Observability
lily.waldorf · 2026-04-26 · via Coralogix

Lily Waldorf

Lily Waldorf Apr 26, 2026

5 mins read

AI coding is everywhere. But is it actually helping?

For those of us using tools like Claude Code, Codex, or Gemini, we already know they’re powerful.

They can write code, refactor functions, open PRs, even run commands. For a lot of developers, they’re already part of the daily workflow.

But once you zoom out beyond the individual developer, the biggest problem isn’t productivity. It’s control. AI coding tools are powerful, but they introduce a new, unpredictable cost layer that most teams don’t fully understand.

Across a team, or an entire engineering org, it’s surprisingly hard to answer simple questions: Is this actually making us faster? Is the code better, or are we just producing more of it?

The visibility gap no one’s talking about

AI coding agent usage is inconsistent. Some developers lean on them heavily, while others prefer the old fashioned way, and there’s usually no clear picture of what the difference in output is actually like. 

At the same time, these tools aren’t just suggesting code anymore, they’re taking action: editing files, running commands, and opening pull requests. 

The impact of a single session can be significant for better or worse. And yet, for something this powerful, visibility is still pretty limited. You might see total usage or a monthly bill. But understanding what actually drove that cost, and whether it created value, is a lot harder. 

Cost scales silently. More usage, longer prompts, heavier models, background agent activity adds up fast. And in most teams, no one can clearly answer: who is spending what, and why?

Introducing Code Agent Observability

Coralogix is now offering Code Agent Observability, giving you a way to see how AI coding agents are actually being used across your team and what they’re producing.

For any agent with native OpenTelemetry support, there’s nothing to instrument. No SDKs, no wrappers, no custom pipelines. Point the agent to your Coralogix OTLP endpoint, set your API key, and telemetry starts flowing automatically, capturing every session without ongoing maintenance as agents evolve.

For org-wide configurations, like Claude Code in Teams or Enterprise, setup is done once and applied across all developers. Without per-user setup or scripts, your entire engineering org goes from zero visibility to full observability with a single configuration.

All data lands directly in Coralogix, alongside your existing logs and metrics. You’re not adding another tool, you’re extending your current observability layer to include AI. And because it’s all based on OpenTelemetry, the same pipeline works across any agent your team uses today or adopts tomorrow.

What you get: 

Across Claude, Codex, Gemini, and any OpenTelemetry-enabled agent, you get a single view of:

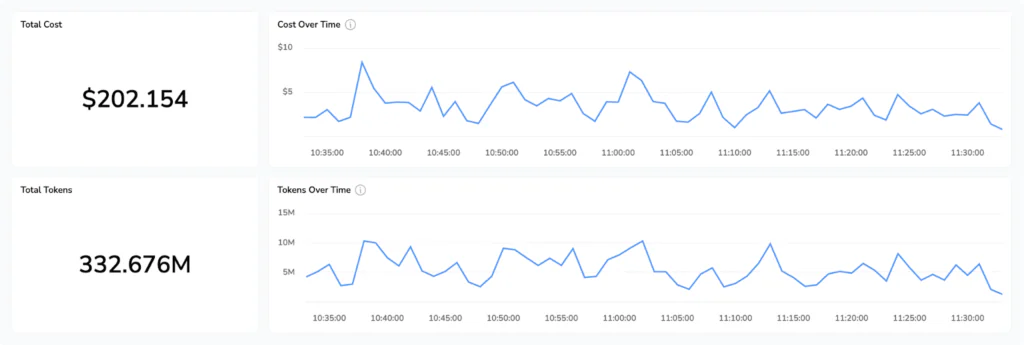
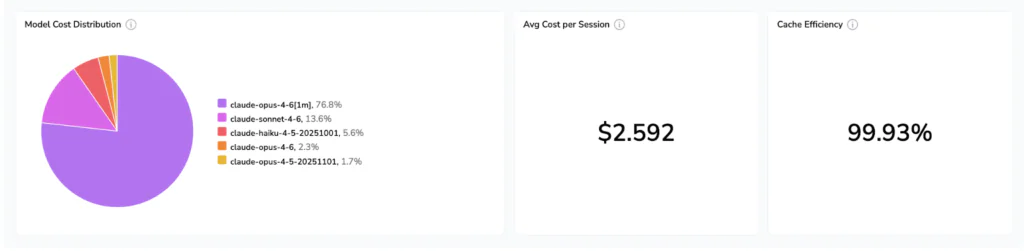
  • Cost and token usage: Real-time visibility into token consumption, model usage, and estimated cost, broken down by user, session, and agent activity.
  • Code impact: lines added and removed, git commits made, pull requests opened, all attributed to specific sessions and developers.
  • Tool call decisions: every accept and reject on an AI-generated code suggestion, tracked with the tool name, decision source, and language.
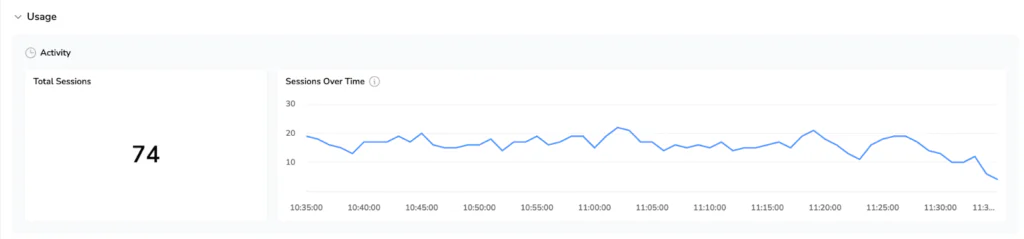
  • Session activity: active processing time split between AI/tool work and keyboard interaction, so you can see how much of a session was agent versus the developer
  • Prompts and tool details: opt-in log events that capture prompt text, MCP server names, and tool outcomes for sessions where you want full detail

All of this is queryable in Coralogix via DataPrime or Lucene. So instead of guessing, you can actually see what’s going on.

The dashboard

The Code Agent Observability dashboard in AI Center has four tabs:

  • Overview: active models, total spend, and session volume for any time range
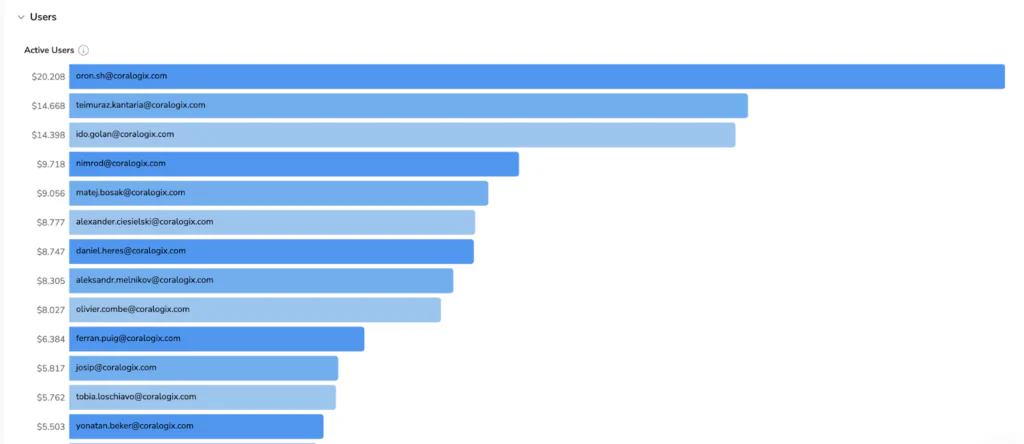
  • Cost: model cost distribution, a ranked breakdown of highest-spending users, and a productivity ratio (accepted AI suggestions vs. total generated) so you can see whether spend is translating into accepted output
  • Usage: session count, request volume, code impact, acceptance rate trends, and a tool call breakdown showing what Claude actually did during sessions
  • Users: ranked by estimated cost, with drill-down into any individual developer’s session activity, token consumption, and code impact over time

Better answers, not just more data

Because this telemetry lives alongside the logs, metrics, and integrations you’ve already set up in Coralogix (like Github, PagerDuty, or incident.io) you can start correlating things that were previously impossible to connect:

  • Does higher AI usage correlate with faster incident resolution?
  • Are AI-generated changes more likely to fail in production?
  • Which developers are getting the most leverage from these tools and what are they doing differently?

AI stops being something experimental and starts becoming part of how your system behaves.

AI isn’t the question anymore

The real question is: are you in control of it, or just paying for it?

Now you have the data to see.

Learn more about code agent observability.