While traditional economic indicators suggest a pullback in spending, 2026 is seeing the rise of treatonomics: a phenomenon where consumers offset financial anxiety with low-cost, high-reward indulgences.
Our treatonomics study examines the behavioral drivers behind this trend, detailing how American spending habits are shifting toward micro-luxuries as a primary mood stabilizer in a volatile market.
In this article, we’ll share our key findings from this and other relevant research to better understand little treat culture and its implications.
The idea of treatonomics is a modern-day continuation of the “lipstick effect,” which became apparent first in the 1920s depression and then later in the 2001 recession.
During these trying economic times, cosmetic sales actually went up - the theory being that people still wanted to treat themselves, but they could only afford small treats.
At its core, treatonomics - or “little treat culture” - defines the shift toward affordable luxuries as a primary tool for emotional reward and stress relief. While high-ticket milestones may feel out of reach, these small, deliberate purchases offer a sense of agency and self-care. This phenomenon has exploded on platforms like TikTok, especially among Gen Z users.
We often talk about life milestones - getting married, becoming a parent, buying a home - but consumers are increasingly celebrating inchstones instead.
This is because, for many people, traditional milestones are slipping out of reach.
According to data from the National Association of Realtors, the share of first-time home buyers in 2025 dropped to a record low of 21%, while the typical age of first-time buyers climbed to an all-time high of 40.
In 1991, the typical first-time buyer was able to purchase a home by the time they were 28 years old. That number gradually climbed to 33 in 2020, then shot up to 36 in 2022, and 38 in 2024.
And when it comes to marriage, the latest US Census shows that in 2025 the median age for a first marriage was 30.8 for men and 28.6 for women - the highest on record. This has been steadily increasing since 1995, when the median age was 26.9 for men and 24.5 for women.
From 2016 to 2023, the share of first-time births increased for older mothers. For those aged 35 and over, it rose from 10% to 12.5%, while for those aged 30-34, it rose from 22.3% to 25.1%.
In contrast, the percentage of first births decreased for younger mothers. For those aged 20-24, it decreased from 27.5% to 25.1%, and for those aged below 20, it decreased from 11.8% to 8.7%.
The postponement of milestones or the inability to achieve them until later all point back to a lack of economic confidence and security in consumers.
Here’s what’s causing that stress:
And these are the costs causing them the most concern:
The "inchstone" trend represents a psychological and economic pivot.
For many, the stereotypical life goals are being rewritten to accommodate a landscape where traditional success is delayed by financial barriers.
Businesses and service providers should recognize that consumer value is increasingly found in the marginal gains and smaller celebratory moments rather than the rare, high-cost events of previous generations.
This leads us to the rise of little treat culture and consumer spending on little treats.
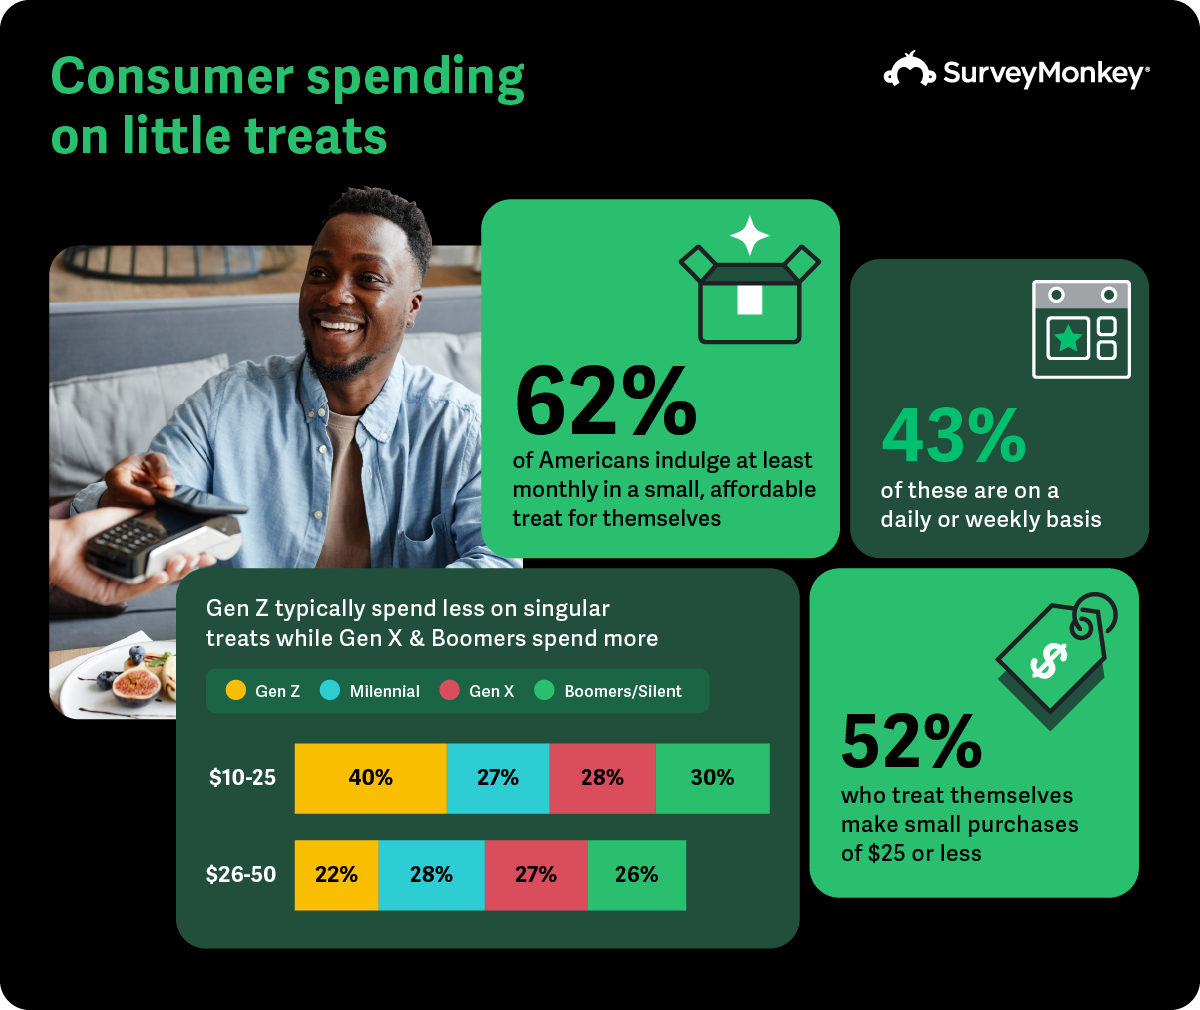
Findings from our recent treatonomics study uncovered that most Americans (62%) indulge at least monthly in a small, affordable treat for themselves, with 43% considered frequent treaters - treating themselves on a daily or weekly basis.
About half of Americans (52%) who treat themselves make small purchases of $25 or less. Interestingly, Gen Z spending habits tell us that they are more likely than older generations to spend $10-$25 on small indulgences, while older generations, particularly Gen X and Boomers, are more likely to spend $50 or more.
Exploring the reasoning behind why consumers are purchasing little treats, findings from our treatonomics study uncovered the top three reasons Americans treat themselves are:
As for the categories where American consumers are buying these little treats, our treatonomics study uncovered the top five and looked at both male and female consumer spending.
The treatonomics data reveals that little treat culture has transitioned from a niche social media trend into a significant behavioral economic pillar for American consumers.
For the modern consumer, these small-scale expenditures function as a necessary psychological buffer, reframing impulse buying as a calculated strategy for emotional resilience and personal celebration.
So, what are the potential consequences of treatonomics for consumers? Is a little treat just that, or could it exacerbate already challenging circumstances?
Findings from our treatonomics study found that frequent treaters are nearly twice as likely as occasional treaters to say that their spending impacts their financial goals - 30% vs. 16%.
Millennials also feel more pressure on their finances with spending on these little treats than older generations (32% vs. 22% Gen X, and 10% Boomers).
One of the dangers of little treat culture is that the cumulative effect of frequent small purchases can lead to significant, long-term financial strain.
Data from Kantar’s 2026 Marketing Trends supports this point, revealing that 36% of people would go into short-term debt to be able to spend money on things they enjoy.
Another problem with treatonomics is that this culture turns formerly rare splurges into daily, normalized habits.
This reduces the effectiveness of these purchases as treats, meaning people may be tempted to spend more on larger treats in order to get the mood boost they’re seeking.
For brands, the shift towards this little treat culture means moving away from selling products as purely functional commodities and repositioning them as emotional interventions.
On the face of it, little treat culture may seem like a fleeting trend, but it has matured into a fundamental shift in how Americans approach spending and self-care.
With major life milestones slipping out of reach, small indulgences have become a primary tool for emotional regulation and reward.
While these little treats offer genuine stress relief, the normalization of frequent, low-friction spending creates a new psychological and financial landscape that brands cannot afford to ignore.
This treatonomics-focused SurveyMonkey study was conducted on February 4-6, 2026, among a sample of 2,038 US adults ages 18+. Respondents for this survey were selected from a non-probability online panel. The modeled error estimate for this survey is plus or minus 2.5 percentage points. Data have been weighted for age, race, sex, education, and geography using the Census Bureau’s American Community Survey to reflect the overall demographic composition of the United States.
此内容由惯性聚合(RSS阅读器)自动聚合整理,仅供阅读参考。 原文来自 — 版权归原作者所有。