


Knowing your database can scale provides great peace of mind. We built PlanetScale on top of Vitess so that we could harness its ability to massively scale. One of the core strengths in our ability to scale is horizontal sharding. To demonstrate the power of horizontal sharding, we decided to run some benchmarking.
We set up a PlanetScale database and started running some benchmarks with a common tpc-c sysbench workload. We weren’t aiming for a rigorous academic benchmark here, but we wanted to use a well-known and realistic workload. We will have more benchmark posts coming and have partnered with an academic institution who will be releasing their work soon.
For this post, there are two goals. The first is to demonstrate PlanetScale’s ability to handle large query volumes. For this, we set a goal of a million queries per second. In Vitess terms, this is not a large cluster. There are many Vitess clusters running at much higher query volumes, but we think it’s a good baseline. The second is demonstrating predictable scalability through horizontal scaling. Increasing throughput capacity is a matter of adding more machines.
Scaling up by adding shards
We started with an unsharded database, then created a vschema and began sharding. Because we like powers of 2, we started with 2 shards and began doubling our shard count for subsequent runs. For each level of sharding, we ran sysbench several times, with increasing numbers of threads. With each iteration, we found there was a point at which additional threads no longer resulted in additional throughput. Instead, query latency increased as we reached our throughput limits.
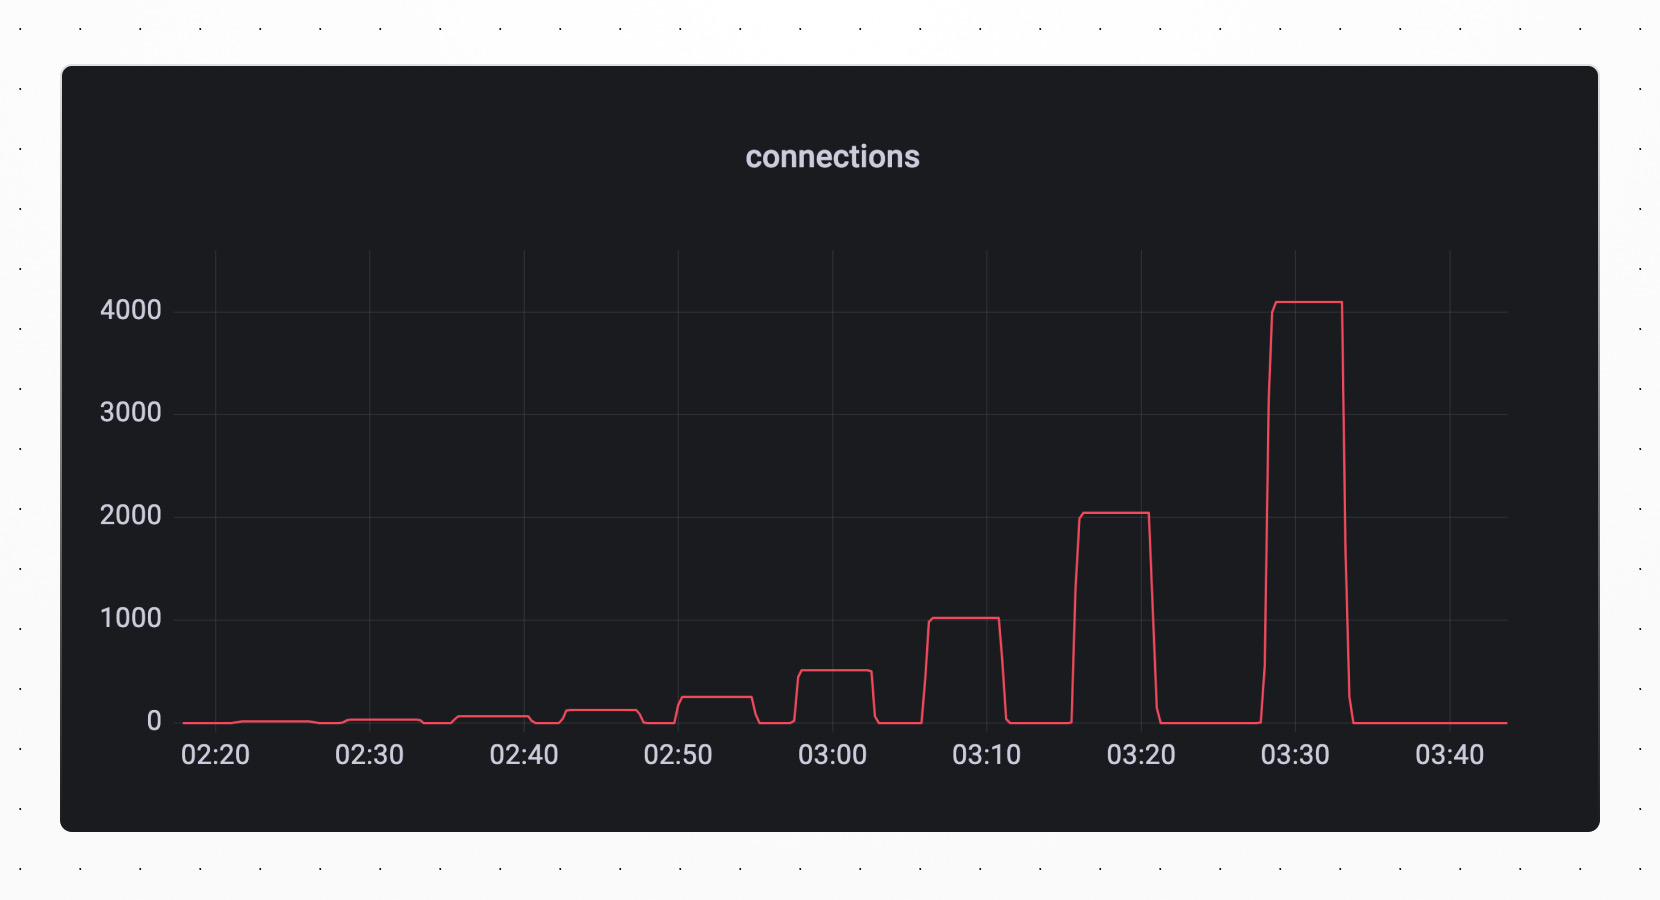
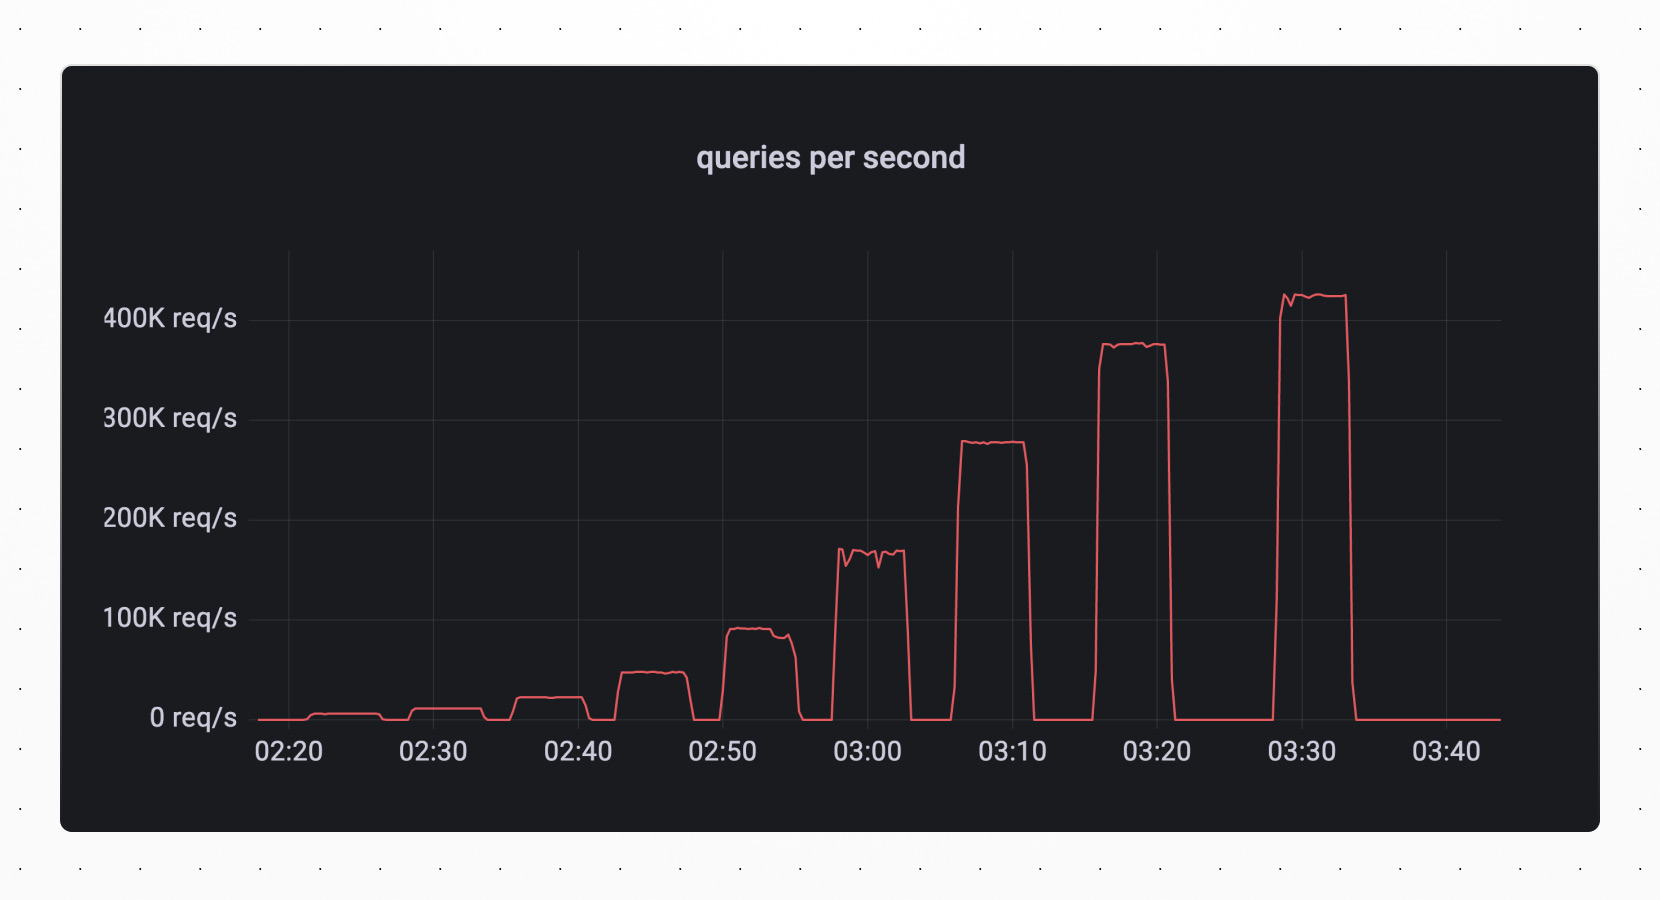
In the graphs below, which were run against a 16 shard database, you can see the increase in the number of sysbench threads reflected in the number of connections. As the number of threads increases, so does the throughput in queries per second.
Hitting the limits
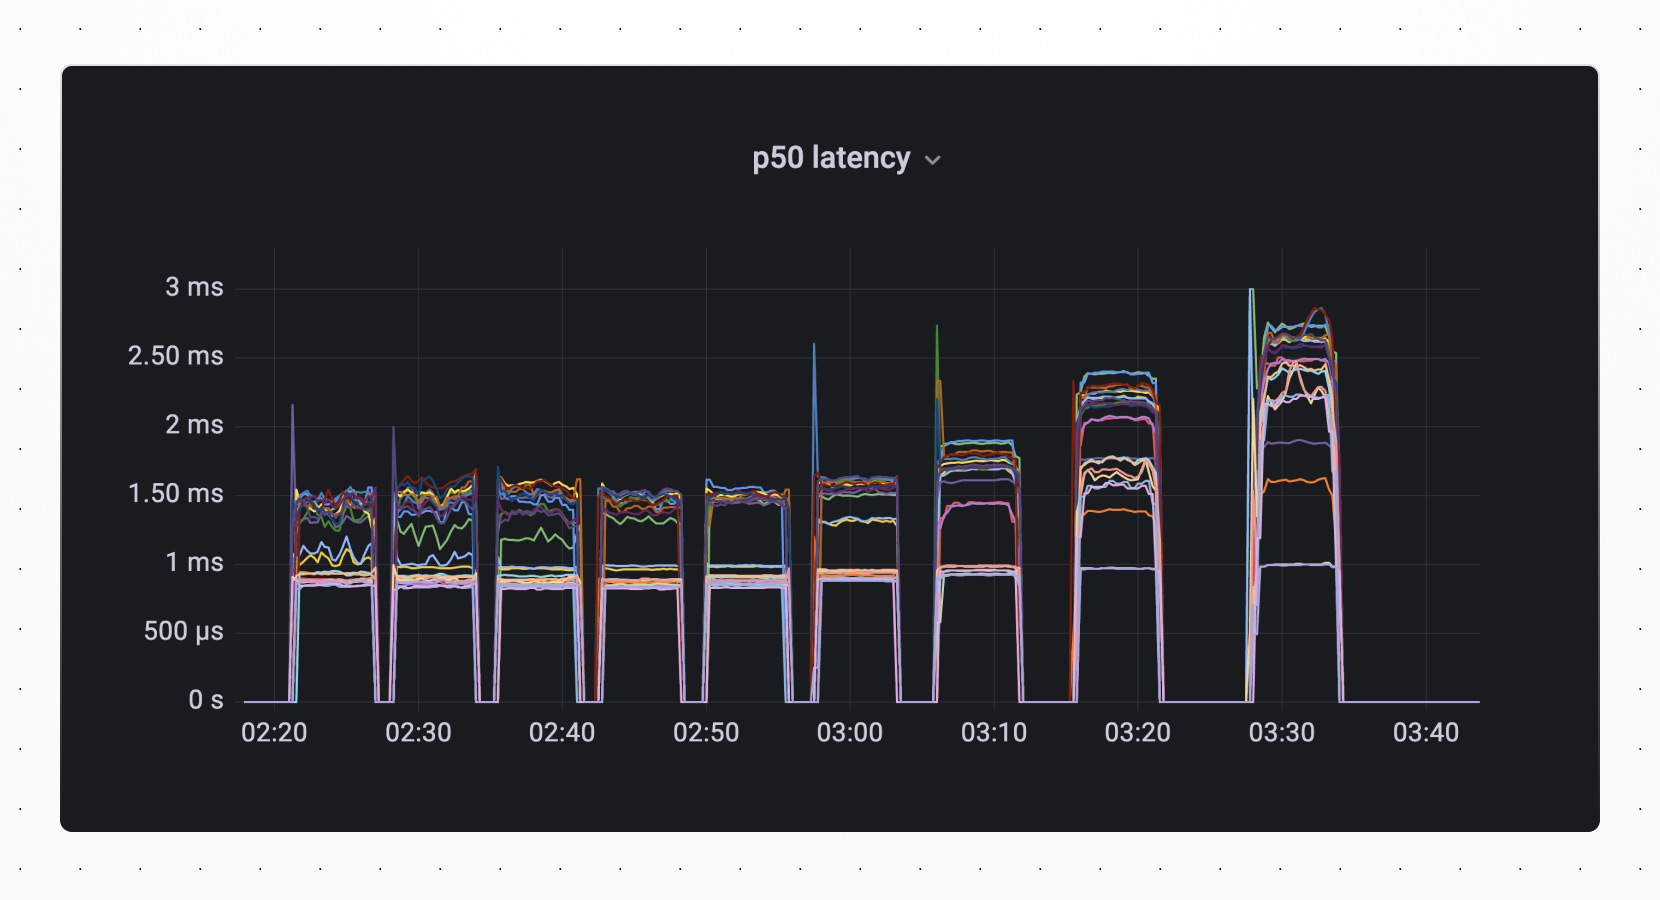
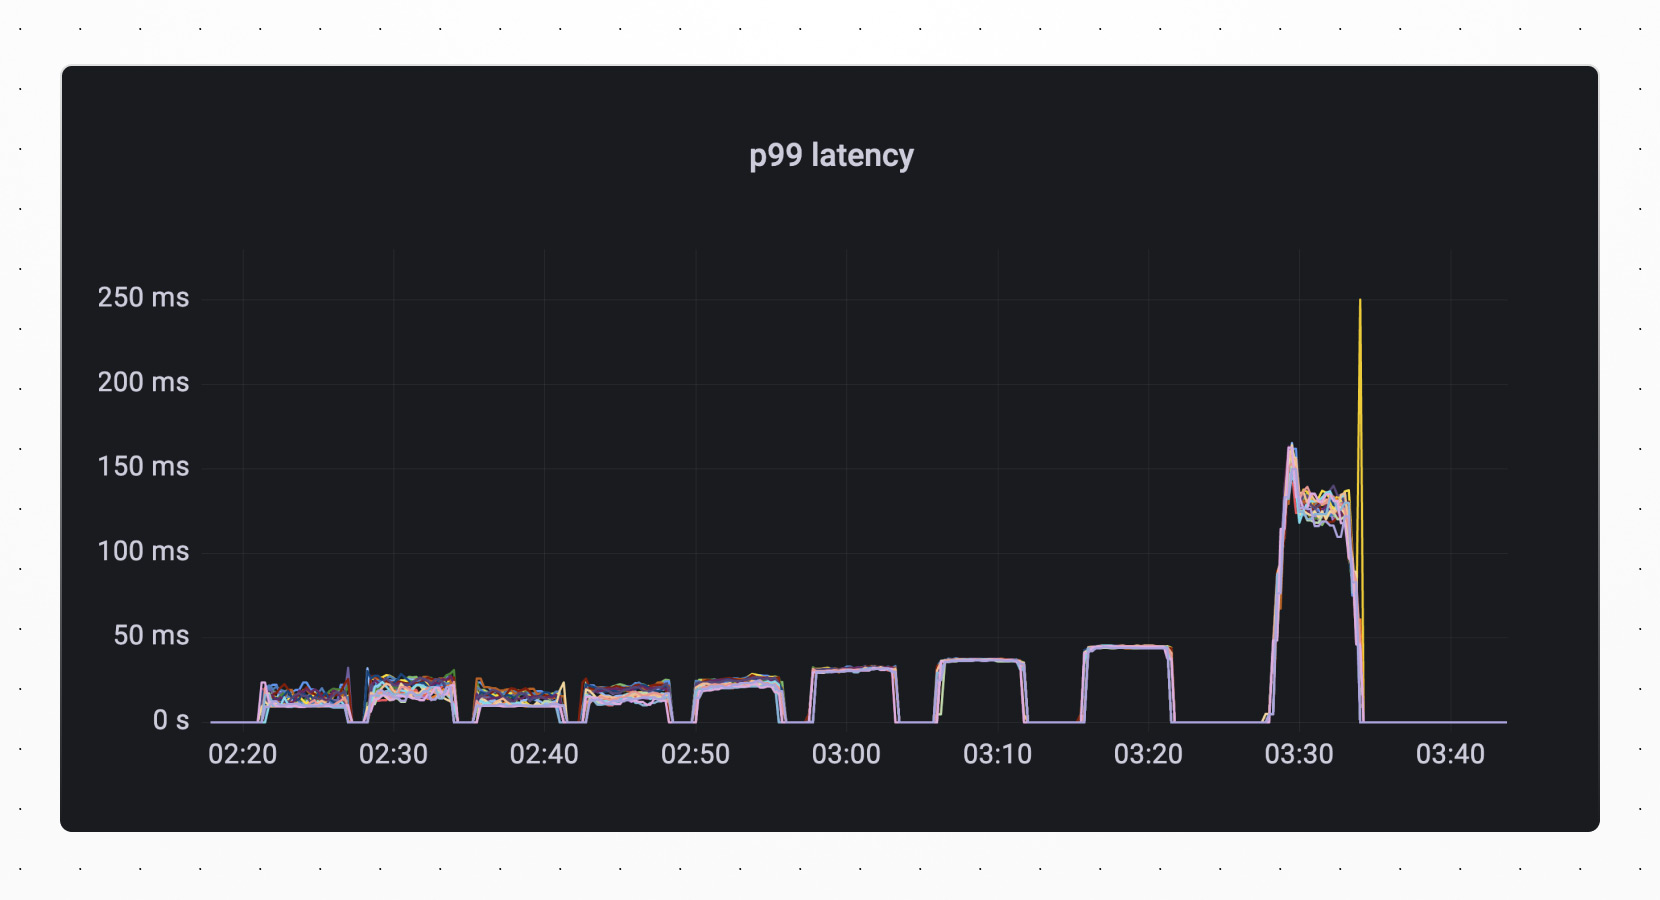
However, we begin to see diminishing returns as we saturate the resources of each shard. This is noticeable above when the QPS increase was greater between 1024 threads and 2048 threads than it was between 2048 threads and 4096 threads. Similarly, in metrics from vtgate shown below, we see an increase in latency as we max out our throughput. This is particularly evident in our p99 latency.
At this point, we know we need additional shards to get more throughput.
Adding more shards
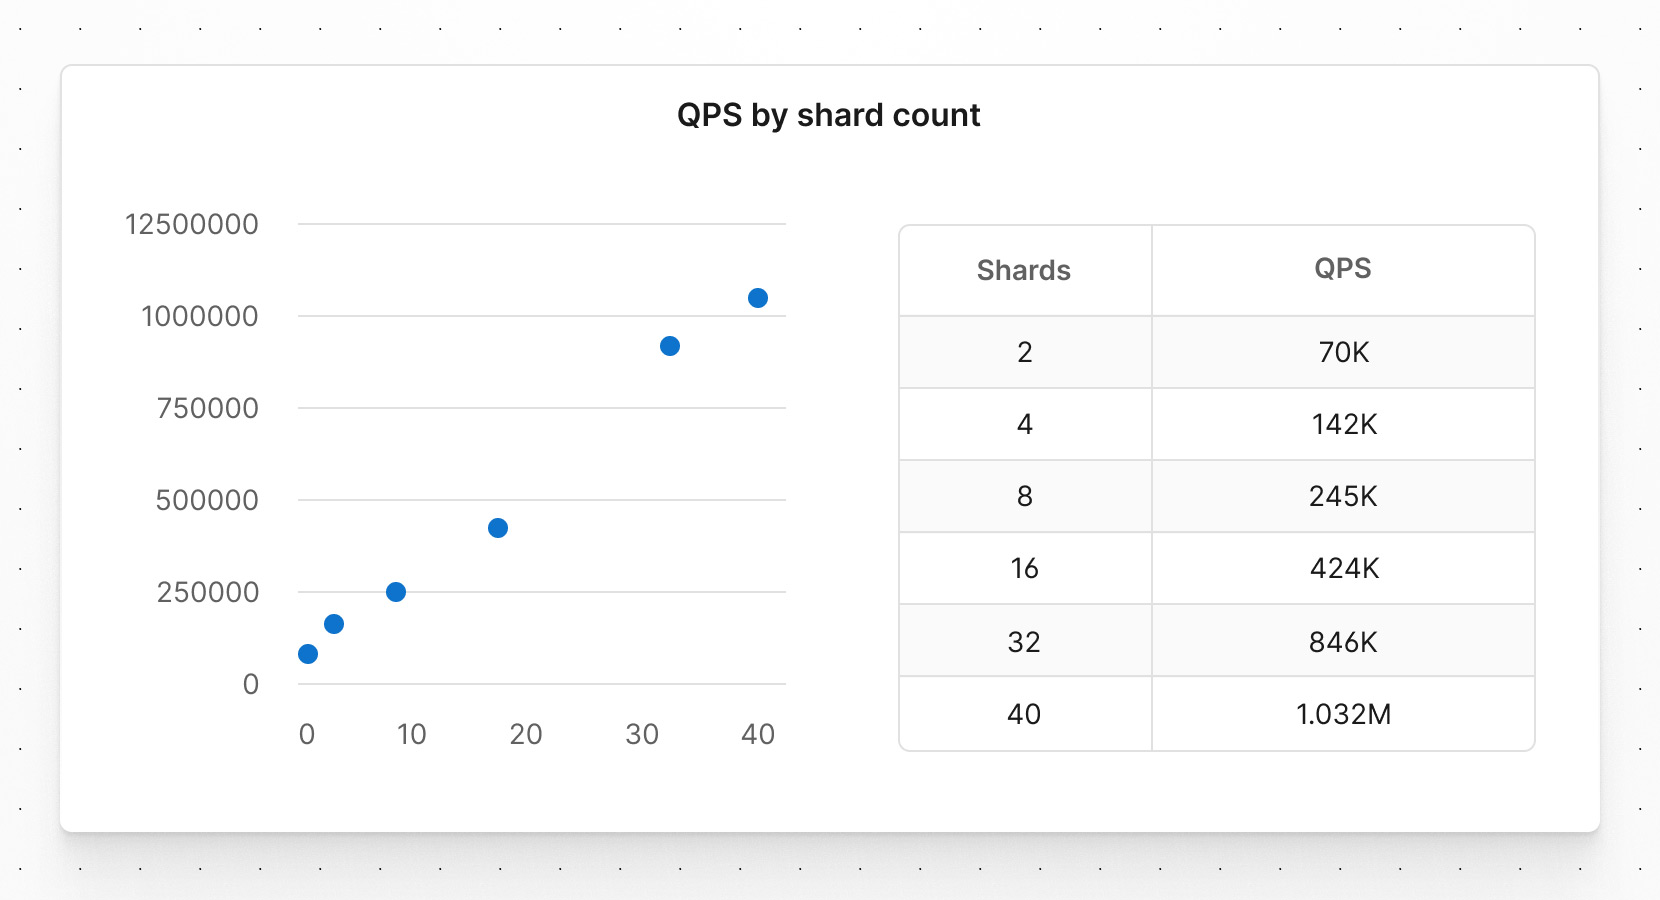
In the data below, you can see the approximate doubling of queries per second as we double the number of shards. With 16 shards we maxed out around 420k QPS. With 32 shards we got up to 840k QPS. While we could continue doubling the number of shards indefinitely, we had set for ourselves a target of one million queries per second.
Achieving one million queries per second
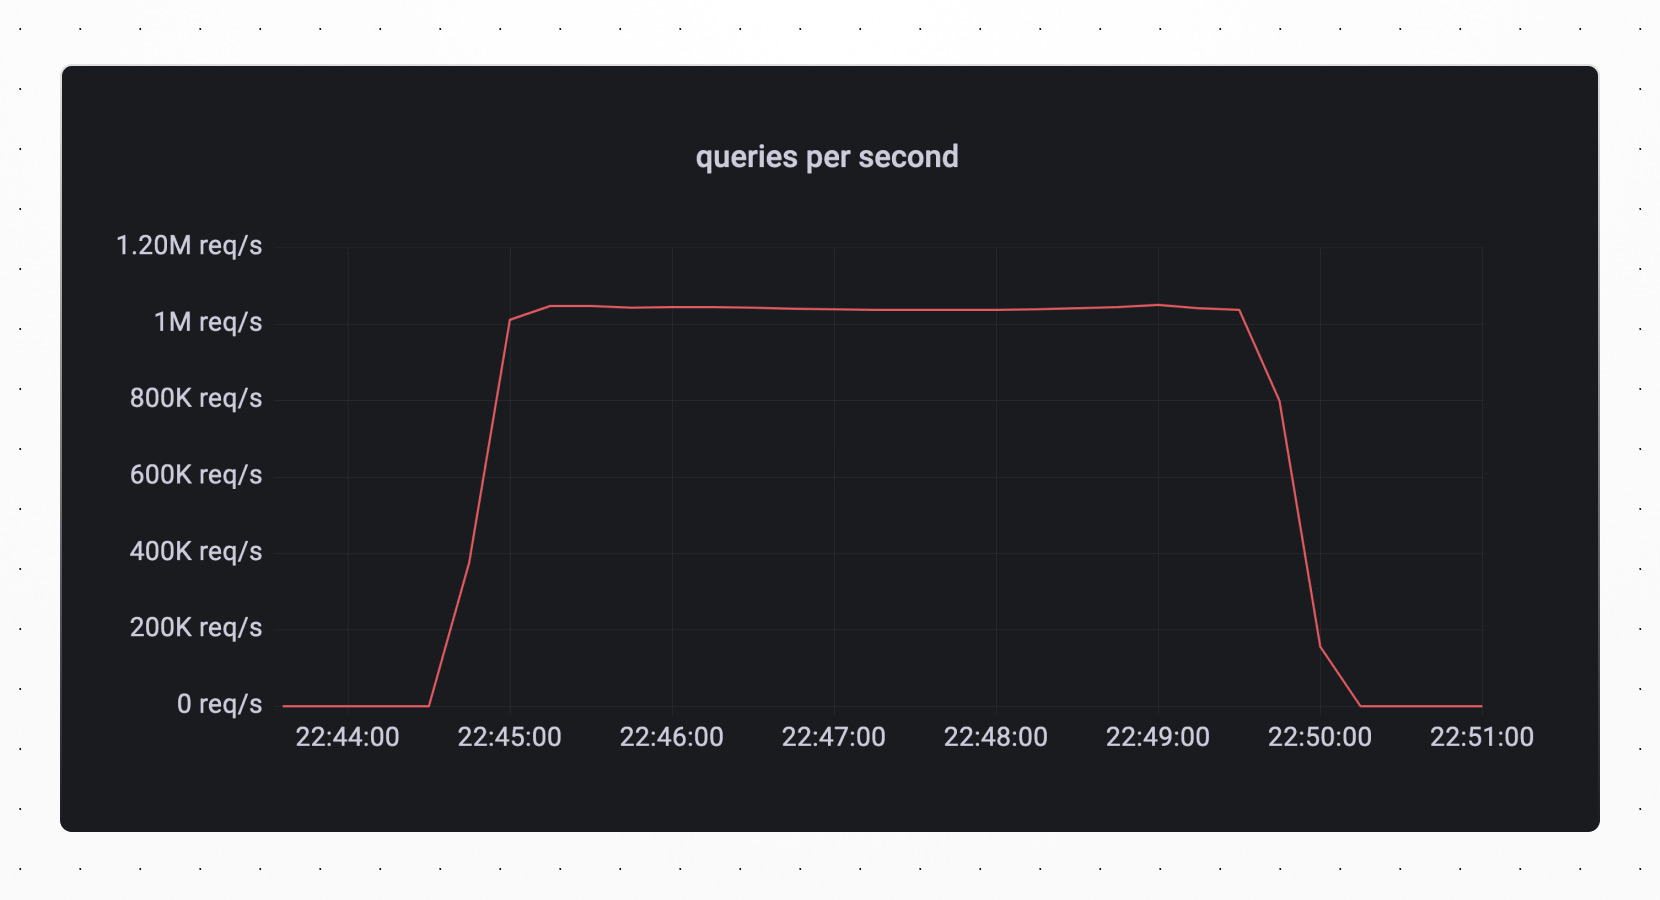
It’s important to note that, while we like powers of 2, this isn’t a limitation, and we can use other shard counts. Since we had just over 800k QPS with 32 shards, we calculated that 40 shards would satisfy our 1M QPS requirement. When we spun this database up and ran our parallel sysbench clients against it, these were the results: over one million queries per second sustained over our 5 minute run.
If you’d like to experience this level of database power, get in touch with our sales team. We ran this benchmark against a single-tenant environment, with levels of resources that we reserve for our enterprise customers. We also made a few non-standard configuration tweaks, including raising some query and transaction timeouts to accommodate this sysbench workload.
This is the first in a series of PlanetScale benchmark posts. Stay tuned for more.