






Funtap/iStock via Getty Images
Commodity markets, and energy markets especially, have always possessed a peculiar instability. Periods of acute shortage and extraordinary profitability have a habit of convincing investors that prosperity will persist indefinitely, while periods of collapse usually persuade them of precisely the opposite. The resulting swings can last far longer than logic would seem to permit.
Most of the large moves are driven not by geology, but by psychology and the capital spending cycle. When a commodity market slips into deficit, prices rise sharply and producers begin earning exceptional returns. Capital eventually follows, although bringing on meaningful new supply is rarely a quick process. New mines, pipelines, export terminals and offshore projects often require years before the first incremental barrel or ton reaches the market. By the time that supply finally arrives, the shortage that justified the investment has usually become widely recognized, and too much capital has been committed. The deficit turns into surplus, prices fall heavily, and investor enthusiasm
evaporates almost as quickly as it appeared. Capital leaves the industry, depletion gradually tightens the market once again, and the cycle begins anew. In commodity markets, these cycles often take a decade or more to fully resolve. There are very few quick cures.
Short-term volatility, however, is usually caused by something altogether different. In those instances, the problem is not psychology or overinvestment, but rather a physical bottleneck somewhere within the system itself. These disruptions can be sudden, violent, and wholly disproportionate to the underlying imbalance that caused them.
Natural gas markets offer some of the clearest examples. During especially cold winters, inventories can draw down at an alarming rate. In Boston, where pipeline infrastructure is notoriously constrained, the city occasionally finds itself perilously short of dispatchable supply during severe cold snaps. Under those conditions, prices have been known to rise twenty-fold in only a matter of days, as utilities and industrial users compete desperately for the last available molecules of gas.
Over long periods of time, commodity prices tend to gravitate toward their fully burdened cost of production. In the short run, however, prices are often determined not by average economics, but by the marginal barrel or molecule needed to balance the market at that particular moment.
During periods of acute surplus, the clearing price can collapse with astonishing speed. The opening weeks of the COVID lockdowns provided perhaps the clearest example in modern history. As demand evaporated and storage rapidly filled, oil prices briefly turned negative, forcing producers to shut in wells across several major basins. Shortages produce the opposite effect. When supply becomes insufficient, prices must rise high enough to ration demand, often very abruptly. The episodes in Boston during severe winter shortages are a good example: the physical shortage itself may be relatively small, but because the market must suddenly determine which users go without supply, prices can behave in a manner that appears almost irrational.
Inventories exist largely to absorb these sorts of shocks. They serve as a buffer between the steady pace at which energy is consumed and the far less stable pace at which it is produced, transported and refined. So long as inventories remain ample, the system can usually tolerate temporary disruptions without much visible strain.
The character of the market changes once that buffer begins to disappear — or proves inaccessible just when it is needed most. At that point, price becomes the rationing mechanism. What follows is rarely orderly. As inventories approach critically low levels, price movements tend to become increasingly erratic and nonlinear. Small disruptions that might ordinarily pass unnoticed suddenly produce outsized effects. The transition itself is often abrupt. A market that appears merely tight one week can look catastrophically undersupplied the next.
Energy history is full of such moments. The oil shocks of the 1970s produced the now-famous gasoline lines across the United States. In 2008, crude prices rose almost vertically as spare capacity and inventories dwindled simultaneously. In 2020, the process reversed spectacularly when storage tanks filled during the COVID lockdowns and WTI prices briefly collapsed below zero. In each case, inventories — either too scarce or too abundant — sat at the center of the dislocation.
Every so often, a longer-term commodity cycle collides with a shorter-term physical dislocation. When that happens, the result is often not merely a temporary price spike, but a much larger structural repricing.
The 1970s remain the classic example. After years of inadequate upstream investment, U.S. oil production unexpectedly peaked in 1971 and began to decline. At the time, few appreciated the significance of the reversal. Then came the Arab oil embargo in 1973, which created what was, at that point, an unprecedented physical disruption to global supply. Crude prices surged nearly 80% within a month. After a brief pause, they resumed their ascent, ultimately rising several-fold over the next year and a half. Oil had entered the decade trading near $3 per barrel. Before long, it was spending sustained periods above $30.
A remarkably similar pattern unfolded in the years leading up to 2008. Following another prolonged period of weak upstream investment, the two largest sources of non-OPEC supply growth — the North Sea and Mexico’s Cantarell field — both began to roll over unexpectedly. At the same time, emerging market demand growth accelerated sharply, leaving global inventories increasingly thin. With very little buffer remaining in the system, crude prices rose roughly three-fold in only eighteen months before eventually stabilizing near $95 per barrel between 2010 and 2014 — nearly eight times the lows reached in 1999.
In both episodes, the underlying market had already become structurally tight well before prices fully reflected it. The physical disruption merely exposed conditions that had been quietly building for years.
We believe the market may once again be entering one of these periods.
Following the shale boom of the 2010s, the upstream oil industry endured nearly a decade of chronically weak investment. For most of the last fifteen years, shale accounted for virtually all non-OPEC supply growth worldwide. That engine now appears to be faltering. Growth across nearly every major shale basin outside the Permian has already stalled or turned negative, and even the Permian itself is no longer growing at anything close to its former rate.
At the same time, the closure of the Strait of Hormuz has introduced a physical disruption without precedent in the modern history of global energy markets. Roughly one-fifth of the world’s seaborne oil trade ordinarily passes through the Strait each day. The market has never before attempted to function for an extended period with such a large volume impaired simultaneously.
The combination is unusual. The industry appears to have entered another structurally tight phase following years of inadequate capital spending, just as the market confronts an acute physical bottleneck of historic proportions. The last time crude traded at extreme lows was during the depths of the COVID lockdowns, when WTI briefly fell below $20 per barrel in April 2020. If oil were once again to experience the sort of eight- to ten-fold repricing seen during prior structural shifts, several years of $120 to $150 oil no longer seem nearly as implausible as investors presently assume. That eight-to-ten-fold frame is the thesis of this letter, and the analysis that follows is in service of it.
As we write, Operation Epic Fury is now in its seventy-sixth day, and the Strait of Hormuz has been closed for most of that time. There is little evidence that a resolution is any nearer today than it was several weeks ago. By any ordinary historical measure, this should have produced something close to panic in the oil market. Instead, the response has been remarkably subdued.
At least 15 million barrels per day of supply appears to be directly curtailed. On volume alone, the disruption exceeds every previous oil crisis. Yet dated Brent — still the best measure of physical delivered crude — managed at its peak to exceed its 2008 high by only $4 per barrel. Spot futures performed even less impressively, failing to reach their 2022 highs and remaining more than $30 below the peak recorded in 2008. The contrast is striking. Neither in 2008 nor in 2022 was the physical market nearly as impaired as it is today. There were even several days in 2011, a year with no comparable supply disruption at all, when oil traded at higher prices than it has during the present crisis. The market, in other words, has been presented with an energy dislocation larger than any previously recorded and has responded as though it were a difficult but ultimately temporary inconvenience.
At the beginning of the year, WTI crude traded near $58 per barrel, placing it in the lowest quartile of nominal prices observed over the past fifteen years. Adjusted for inflation, oil ranked in roughly the lowest decile of historical readings. Measured in gold terms — a framework we discussed at length in our previous letter — crude began the year cheaper than at any point in modern history apart from the extraordinary lows briefly reached during the COVID collapse in 2020.
Investor sentiment reflected this extreme pessimism. Much of the bearishness stemmed from forecasts published by the International Energy Agency, which projected a surplus of roughly 2 million barrels per day for 2025, widening to 3.5 million barrels per day in 2026. Had those figures proven correct, the market would have been facing the largest glut in its history.
We never found those estimates particularly convincing. Our own work suggested the previous year's surplus was materially smaller than widely believed, and that underlying demand was both stronger and growing considerably faster than consensus estimates implied. At the same time, shale production growth — which had supplied virtually all incremental non-OPEC production for more than a decade — was slowing rapidly. Taken together, the market appeared to us far closer to balance than most investors appreciated. We believed 2026 would likely begin in approximate equilibrium before slipping into outright deficit later in the year.
We positioned the portfolio accordingly. In January, we sold a substantial portion of our gold-equity holdings and redirected the proceeds into oil and natural gas investments.
On February 28th, the United States and Israel launched Operation Epic Fury. Crude prices responded immediately, rising roughly 75% within a month. At first glance, the move appeared dramatic. A closer inspection of the futures market, however, revealed something rather different.
While spot prices surged sharply, longer-dated crude contracts moved far less. Oil for delivery twelve months forward rose only about 25%, and even after the rally remained well below prior peaks in nominal terms — roughly $70 per barrel below the highs reached in 2008, $35 below those seen in 2011, and $27 below the 2022 peak.
The distinction matters. Spot markets tend to reflect immediate physical stress, whereas the outer years of the futures curve reveal what investors believe about the durability of that stress. In effect, the market was signaling that while the disruption might prove painful in the near term, conditions would normalize before long. The prevailing assumption seems to be that once the Strait reopens, the market will quickly revert to surplus and inventories will rebuild without much lasting difficulty. Implicit in this view is the belief that even if roughly one billion barrels of supply were disrupted during the closure, a return to a surplus of 3 million barrels per day would allow the system to restore inventories to their January levels within a year or so.
This confidence extends well beyond the oil market itself. After initially falling roughly 9% when hostilities began, the S&P 500 subsequently rallied nearly 20% and now stands materially above its prewar level. Speculative enthusiasm has returned most visibly to technology and artificial-intelligence shares. Since bottoming on March 30th, the tech-heavy Nasdaq Composite has advanced nearly 30%, roughly twice the gain recorded by the broader market. Financial markets are behaving as though the world is simultaneously confronting the largest physical disruption in energy history and no meaningful disruption at all.
Energy equities, meanwhile, have behaved far more like the deferred crude contracts than the spot market itself. The Energy Select Sector SPDR Fund (XLE), which is dominated by large integrated oil companies, has risen only modestly since hostilities began. The SPDR S&P Oil & Gas Exploration & Production ETF (XOP) — typically far more sensitive to changes in crude prices because of its heavier exposure to exploration and production companies — has performed somewhat better, though hardly in a manner one might expect during a supply disruption of this magnitude.
Investor flows tell a similar story. Since the end of February, only about $7 billion of net capital has entered the two ETFs combined. That figure is notable chiefly because of how small it is. Between 2022 and 2025, we estimate investors withdrew roughly $20 billion from the same vehicles. The broader pattern suggests that investors continue to view the present episode not as the beginning of a larger structural shift, but rather as a temporary interruption within a market they still fundamentally distrust.
Because the broader equity market has advanced much more rapidly than energy shares, the sector's weighting within the S&P 500 has actually drifted slightly lower since the conflict began. Energy today represents only about 3.2% of the index — a small fraction of the roughly 16% weighting reached during the 2008 commodity peak, and not dramatically above the all-time lows recorded during the depths of the COVID collapse.
Several news reports last week pointed to another supposedly reassuring development: the premium commanded by physical crude for immediate delivery has fallen sharply from the extreme levels reached earlier in the conflict. By some measures, those premiums have declined nearly 90% from their February highs.
Recent market action suggests to us that after a brief short-covering rally in energy, investors have largely returned to the so-called “carry trade. ” In our 4Q2025 letter, we described the mechanics of this feedback loop, in which investors become heavily levered short volatility. In essence, they are betting that whatever has been working will continue to work. As part of this trade, we suspect many investors are effectively short energy exposure in order to increase their long exposure to momentum stocks, technology shares, and other high-valued long-duration assets. Apart from the brief rally immediately following the outbreak of the war, this pattern appears to have remained firmly in place.
Investors continue to dramatically underprice the upside risks facing global energy markets, both over the short term and the longer term. Yet the underlying data increasingly suggests the market may be approaching an important inflection point.
In the immediate term, it is difficult to overstate the magnitude of the supply shock caused by the closure of the Strait of Hormuz, though the full physical effects have yet to be truly felt. Before the conflict, roughly 20 million barrels per day moved through the Strait. Since then, several bypass pipelines have increased throughput materially, but even after accounting for those adjustments, approximately 15 million barrels per day remains impacted.
In the opening days of the crisis, producers reacted in predictable fashion. Every available tanker trapped inside the Gulf was hastily filled, along with virtually every accessible onshore storage tank. In aggregate, this emergency stockpiling absorbed roughly 120 million barrels. Once the tanks and vessels were full — a matter of only several days — producers had little choice but to begin shutting in field production.
Accounting for this one-time inventory build, our analysis suggests that with the Strait now closed for more than seventy-five days, over one billion barrels of production that otherwise would have reached the market has been curtailed. At 15 million barrels per day, the disruption presently affects roughly 15% of global oil supply — approximately three times larger in absolute volume, and twice as large relative to the size of the world oil market, as the Arab oil embargo of 1973.
The physical market has no obvious replacement for this lost production, and our analysis suggests the global commercial system risks severe breakdown even if the Strait were reopened immediately. Why then, one might reasonably ask, have we not yet seen major global dislocations? And why do investors remain so calm?
We believe the answer lies largely in delays, both within the physical supply chain itself, and in the data investors use to attempt to measure it. Oil moves slowly through the global system. So does information. In both cases, the true condition of the market often reveals itself only after the underlying imbalance has become considerably more serious than first believed.
On the physical side, we estimate that the time required for oil to move from the wellhead to final consumption can approach ninety days. The process is considerably slower, and far more complicated, than is commonly appreciated.
Crude oil may require roughly five days simply to travel from the producing field to the export terminal or loading facility. From there, after accounting for loading, ocean transit and discharge, the cargo can spend another eighteen to twenty-two days in motion. Once unloaded, the crude typically does not move directly into the refinery process. Instead, it sits in storage tanks while refiners assemble the appropriate blend of feedstocks, a process that can itself require anywhere from five to fifteen days. The refinery stage adds further delay. Hydrotreating, reforming, cracking and blending can collectively consume another week before refined products are ready for shipment. Even then, gasoline, diesel and jet fuel usually remain in storage at the refinery gate for an additional five to fifteen days before entering the distribution network. From there, the products are batched and moved onward by pipeline, rail or coastal tanker to regional distribution centers, a process that generally takes between one and five days. Finally, fuel is delivered to airport terminals, retail stations and other end users, each of which maintains its own inventory — often enough to cover anywhere from two to ten days of consumption. The result is a supply chain that stretches across continents and oceans, and whose delays are measured not in hours, but in weeks.
If we assume field production began shutting in roughly one week after the conflict started, then end users should only now be beginning to experience the first meaningful physical effects on refined product supply. Owing to the long delays embedded throughout the system, the consequences of a supply disruption of this magnitude do not appear all at once. They propagate gradually through the chain.
Refiners, naturally, would have encountered the problem first, and there are already signs this is occurring. A number of refining complexes around the world have reportedly reduced or idled runs because they cannot secure the appropriate crude feedstock. The strain appears most acute in Asia, where many refineries are specifically configured to process Gulf crude.
Refined-product markets are now beginning to reflect these pressures as well. Prices for diesel and jet fuel, in particular, have recently risen sharply in several regions, suggesting the disruption is beginning to move downstream into the broader economy.
Complicating matters further, China has sharply curtailed refined-product exports in an effort to protect domestic supply. The decision has made gasoline, diesel and jet fuel materially harder to source throughout the rest of Asia, where many countries had grown heavily reliant on Chinese exports to balance their own markets. Because Chinese refiners no longer need to produce export volumes, many have been instructed to reduce operating rates, thereby lowering immediate demand for crude oil itself. The short-term effect on crude pricing appears almost reassuring at first glance — but the problem has merely been pushed further down the chain. With refinery runs reduced sharply, global refined-product inventories are now drawing rapidly ((likely faster than the available data presently captures)), even as crude demand temporarily softens. This is not a permanent solution so much as a temporary postponement. Eventually, refined-product inventories will need to be rebuilt, and when that occurs, demand for crude oil could rise much more sharply than the market presently expects.
A second cushion has come from OECD strategic petroleum reserves, which have agreed to release roughly 400 million barrels over a one-hundred-day period — equivalent to approximately 4 million barrels per day, or somewhat less than one-third of the disrupted Gulf production. The measure has helped absorb some of the immediate shock, though it falls well short of fully replacing the missing supply.
Many investors appear to assume that additional SPR releases could easily follow if conditions deteriorate further. We are less certain. Unlike commercial inventories, strategic reserves are often stored in underground salt caverns and cannot be drawn indefinitely without operational constraints becoming an issue. Moreover, the present release comes on top of two already substantial drawdowns since 2022. It is therefore not obvious that OECD governments remain in a position — operationally or politically — to continue supplying the market at comparable rates for an extended period.
There is also a second consideration that receives far less attention, and which we believe deserves considerably more weight than the market presently assigns it. Once the Strait eventually reopens, countries with depleted strategic reserves will almost certainly feel compelled to replenish them — and likely to higher levels than before, given the demonstration effect of the present crisis. In effect, today's emergency release becomes tomorrow's incremental source of demand. We suspect that SPR restocking could provide at least a 1 million barrel per day tailwind to global oil demand over the next several years, and quite possibly more if multiple governments move to rebuild reserves simultaneously. This is precisely the sort of second-order effect that markets typically ignore until it is already underway.
Taken together, these developments have made the data increasingly difficult to interpret. Real-time estimates of global oil demand are derived largely from models whose inputs depend heavily upon observed refinery runs. Under ordinary conditions, refinery throughput tends to correlate quite closely with end-use consumption, making the relationship reasonably reliable. The present situation, however, is not ordinary. As discussed earlier, refinery runs are now being influenced heavily by China's decision to prioritize its domestic market and curtail exports. Lower refinery throughput, therefore, may say less about weakening global consumption than about the growing difficulty of securing crude feedstock and refined-product supply within the broader system.
Making matters more difficult still, reliable global oil data operates with a considerable delay. Outside the United States, much of the world's inventory, demand and trade data is reported only monthly, often with revisions arriving well afterward. In practice, this means the global market is frequently attempting to assess present conditions using information that is already one or two months old. The United States is something of an exception, owing to the unusually high quality and frequency of its reporting. Weekly inventory and refinery data are available with a level of detail unmatched elsewhere. Yet the U.S. is also relatively insulated from the worst of the present disruption because of its large domestic production base and comparatively limited dependence on Gulf crude imports. Investors may not be able to properly assess the true physical impact of the conflict for another month or two, by which point the market itself may already have changed considerably.
The International Energy Agency is presently reporting that global oil demand declined by roughly 4 million barrels per day in March and another 2 million barrels per day in April. We remain skeptical of those estimates. Mr. Rothman of Cornerstone Analytics has correctly pointed out that real-time global flight activity has historically correlated surprisingly well with overall oil demand, despite jet fuel accounting for less than 10% of total petroleum consumption. At present, the flight data suggests little evidence of any meaningful slowdown in global demand.
Instead, we suspect many analysts are inferring weaker consumption from reduced refinery throughput — a reasonable conclusion under ordinary circumstances, but a misleading one in the current environment, where lower refinery runs likely reflect physical crude shortages and Chinese export policy far more than any genuine deterioration in end-use demand.
History supports this view. Between 2010 and 2014, crude oil averaged roughly $95 per barrel, yet global demand continued growing by approximately 1 million barrels per day annually throughout the period. Adjusted for inflation, that average price would equate to roughly $142 per barrel today. In 1980, crude briefly reached the equivalent of approximately $150 per barrel in today's dollars before meaningful demand destruction emerged, though oil expenditures then represented a much larger share of global incomes than they do today. The same pattern held in 2008, when demand destruction finally appeared only after oil approached the equivalent of roughly $200 per barrel in current dollars. Demand destruction will likely come eventually. Historically, however, it has tended to arrive not before higher prices, but because of them.
We turn now to the inventory picture, which is where the situation looks most precarious. At first glance, commercial stockpiles appear comfortably large. The International Energy Agency estimates that non-SPR inventories stood at roughly 6.5 billion barrels of crude oil and refined products at the end of February. Upon closer examination, however, the situation looks considerably less reassuring.
Much of this oil is not truly “inventory” in the ordinary sense of the word — that is, supply that can simply be withdrawn and consumed during a shortage. A substantial portion functions more like working capital within the global petroleum system itself. It exists not as surplus, but as the minimum volume required to keep a 106 million barrel-per-day market operating continuously.
While roughly 2 billion barrels of oil are reportedly floating aboard the global tanker fleet at any given time, we estimate that nearly 1.7 billion barrels must remain continuously at sea simply to sustain an 80 million barrel-per-day seaborne export market, given average laden voyage times approaching twenty days. Most of this oil is not excess inventory at all, but cargo in transit, permanently embedded within the functioning of the system itself.
The same principle applies elsewhere throughout the supply chain. We estimate that another 2.2 billion barrels are required within blending facilities, refinery systems and downstream distribution networks before normal operations begin to break down. Pipelines present a similar constraint. Roughly 1 billion barrels are needed globally as line fill — the minimum volume necessary to keep crude and products moving continuously through the system. Below that level, pipelines begin drawing air, impairing operations and risking damage to equipment.
Storage tanks, meanwhile, can never be fully emptied. Partly this is because a certain volume is needed to maintain enough hydrostatic pressure to move oil through the system. More importantly, tank outlets are intentionally positioned above the bottom of the tank in order to prevent sediment and contaminants from entering the stream. The residual volume left behind is known within the industry as the “heel. ” Combined with minimum operating requirements, it generally means that no more than roughly 90% of a storage tank’s nominal capacity can actually be accessed. On estimated global commercial storage capacity of approximately 5 billion barrels, this implies that roughly 500 million barrels are effectively unavailable under ordinary operating conditions.
Taken together, our analysis suggests the minimum commercial inventory required to keep the global petroleum system functioning is approximately 5.4 billion barrels — against reported non-SPR inventories of roughly 6.5 billion barrels at the end of February. The implication is rather sobering. If our estimates are approximately correct, the global energy system can realistically draw only about 1.1 billion barrels from commercial inventories before beginning to seize up operationally. Yet even if the Strait were reopened tomorrow, we estimate that roughly 1.5 billion barrels of production will already have been lost.
Strategic reserve releases will eventually contribute approximately 400 million barrels, which, at least on paper, nearly bridges the gap. Of course, the International Energy Agency entered the crisis believing the market was already running a meaningful surplus, implying that not all of the curtailed production would necessarily need to come from storage. We have long questioned that assumption — and the agency’s recent upward revisions to January and February demand figures appear to support the view that much of the supposed surplus may never have existed at all.
Similar concerns have recently begun surfacing elsewhere on Wall Street. A research report published by JPMorgan Chase (JPM) arrived at broadly comparable conclusions using a similar framework. Their analysts estimated that the global oil system, including strategic reserves, could likely withstand withdrawals of roughly 900 million barrels before acute stress begins to emerge, and approximately 1.6 billion barrels before the system risks outright breakdown.
There is an additional complication. Nearly 1.5 billion barrels of global petroleum inventories are believed to reside within China. Recent decisions by Chinese authorities to restrict refined-product exports suggest they may be increasingly inclined to preserve those inventories for domestic use rather than release them into the global market. In practical terms, this means that a meaningful portion of the world’s reported stockpiles may prove far less accessible during a crisis than headline inventory figures would initially imply.
The market is moving dangerously close to a severe physical bottleneck, one that risks producing an extremely nonlinear move higher in prices. At some point, demand will have to be curtailed as the market pushes deeper into the most inelastic portion of the supply curve. Once that threshold is approached, price movements historically become abrupt and disorderly. In April 2020, with COVID related lockdowns firmly in place, oil traders became concerned that storage tanks might overflow. As the physical bottleneck became acute, price collapsed from $30 to -$47 in a matter of days. We believe we could be on the verge of a similar bottleneck, albeit in the opposite direction. As tank volumes approach usable minimums, we believe the risk of a massive price spike in crude is quickly approaching.
For the moment, however, investors seem largely indifferent to the underlying data. So long as the Strait remains closed, the market has increasingly taken to trading on headlines, rumors and fleeting political commentary rather than on the condition of the physical system itself. Many participants continue to assume that the operational dislocations now emerging across parts of Asia will remain localized and manageable. Over the next several weeks, reliable data capable of fully capturing the scale of the problem will likely remain scarce. Yet physical shortages have a tendency to propagate outward through the system gradually before suddenly becoming impossible to ignore. We suspect the broader ramifications of the present disruption will ultimately prove considerably larger than the market presently anticipates.
The most consequential question facing investors today is not whether the closure of the Strait will eventually end. It will. The more important question is what the market looks like after it reopens. The prevailing assumption is that reopening restores balance — that supply returns, inventories rebuild, and the system reverts to the surplus the IEA had been forecasting before the war. We believe the opposite is closer to the truth. The market was already tightening structurally before the conflict began, and the eventual reopening of the Strait is likely to unleash a wave of deferred consumption and inventory restocking that leaves the system in deeper deficit than before. If that is correct, then what is presently viewed as a temporary disruption will instead come to be seen as evidence of a deeply undersupplied system, and the entire futures curve will need to reprice materially higher. The case for that view rests primarily on demand, and on a discrepancy in the IEA's own data that has been growing for the better part of two years.
At the beginning of the year, oil had become one of the most deeply disliked asset classes in the world — a level of pessimism comparable perhaps only to sentiment surrounding gold in 1999, when it traded below $300 per ounce shortly before embarking on what would become one of the great bull markets of the next quarter century. Much of this bearishness was rooted in the International Energy Agency's conviction that the oil market was entering a record surplus in 2025, that would grow even larger in 2026. As recently as February, the agency estimated that global production had exceeded demand last year by roughly 2.2 million barrels per day. Had that actually occurred, commercial inventories should have risen by a similarly large amount.
Instead, reported OECD inventories increased by only about 250,000 barrels per day — barely one-tenth of the implied surplus. The IEA attempted to reconcile the discrepancy by estimating that non-OECD inventories rose by approximately 360,000 barrels per day, while oil stored aboard tankers increased by another 700,000 barrels per day. As discussed earlier in this letter, however, these figures are materially less reliable than directly reported OECD inventory data. Both estimates rely heavily on satellite imagery interpreted by commercial third-party providers rather than on transparent reported statistics. The oil-on-water figures are particularly problematic because much of the increase reportedly came from sanctioned Iranian, Russian and Venezuelan crude moving through the shadow fleet — cargoes that are notoriously difficult to track accurately even with sophisticated satellite analysis.
Even after incorporating these estimates, the IEA's balances still failed to reconcile. Within its "miscellaneous to balance" category, the agency included a line item labeled "unaccounted for oil, " which totaled an extraordinary 850,000 barrels per day. To place that figure in context, the IEA estimated that total global oil demand growth for all of 2025 amounted to only 700,000 barrels per day. In other words, the unexplained portion of the data was larger than reported demand growth itself.
For some time, we have argued that much of this so-called "unaccounted for oil" likely represented underreported demand rather than statistical error. If that interpretation is correct, then actual oil consumption last year may have been roughly 800,000 barrels per day higher than officially reported. More importantly, demand growth itself would have been running at nearly twice the reported pace.
If even part of the reported increases in Chinese inventories or oil-on-water storage ultimately proves overstated, then true demand may have been stronger still. In total, we believe global oil demand in 2025 may have reached approximately 105 million barrels per day, representing growth of roughly 1.7 million barrels per day over 2024. Rather than the 2.2 million barrel-per-day surplus described by the IEA, the market may instead have experienced only a modest surplus of roughly 1 million barrels per day — a surplus that can largely be explained by OPEC's unexpected decision to accelerate production beginning last April.
More importantly, the IEA's "missing barrel" problem appeared to be worsening steadily over time. Even after accounting for the agency's estimated additions to Chinese inventories and floating storage, the "unaccounted for" category continued to expand at an increasingly alarming pace. As recently as April, the figures showed the discrepancy rising from nearly zero during the first quarter of 2025, to roughly 350,000 barrels per day in the second quarter, 750,000 barrels per day in the third, and finally 1.5 million barrels per day in the fourth quarter.
What struck us was not merely the size of the imbalance, but its consistency. The sequential acceleration was far too orderly to dismiss as random statistical noise. To us, it suggested the problem was becoming systemic — evidence not of temporary estimation error, but of a market whose underlying demand was persistently stronger than the official data recognized.
The discrepancy became materially larger in January and February. As recently as April, the International Energy Agency was still reporting "unaccounted for" balances of roughly 1.6 million barrels per day in January and an extraordinary 2.3 million barrels per day in February. In February alone, the year-over-year increase in the balancing item was roughly three times larger than the agency's reported year-over-year growth in global oil demand itself. The unexplained portion of the data was growing far faster than the officially reported consumption figures that investors were relying upon. The implication was straightforward: the market was likely much tighter, and considerably better balanced, than prevailing consensus believed.
In its latest report, the IEA revised first-quarter 2026 demand upward by roughly 900,000 barrels per day, even after incorporating adjustments to March following the outbreak of the war. The revisions reinforced our view that the balancing item reflects underreported demand rather than temporary statistical distortion. Even after these upward revisions, however, "unaccounted for" oil still averaged roughly 1 million barrels per day across January and February. If that discrepancy is eventually reconciled through further increases to reported consumption — as previous revisions would seem to suggest — then first-quarter global demand may ultimately have approached 105 million barrels per day, representing year-over-year growth of approximately 2.3 million barrels per day versus the first quarter of last year. We believe underlying global demand would likely have risen to approximately 107 million barrels per day this year, pushing the market into outright deficit by the third quarter — even before the war began.
This is what makes the reopening question so important. The market is presently being analyzed as though Gulf supply will return to a system that was previously in balance, or in surplus. We believe it will return to a system that was quickly tightening, that is now starved of inventory, and that faces simultaneous demand from end consumers, commercial operators rebuilding working stocks, and governments seeking to replenish strategic reserves. Inventories will not rebuild gracefully. They may not rebuild at all.
The supply side reinforces this concern. The International Energy Agency continues to assume that U.S. oil and natural gas liquids production will grow by roughly 400,000 barrels per day from March 2026 levels, reaching approximately 22 million barrels per day by year-end. Such an outcome would represent a sharp reversal from the trends developing across the shale industry.
Virtually all of the growth in U.S. crude production during the last decade has come from the shale basins, and that period of rapid expansion is now nearing its end. Every major shale basin outside the Permian has already entered structural decline. Since 2019, we have argued that the Permian itself would begin rolling over in 2025 — a view that at the time appeared almost absurd given that production growth from the basin alone was then averaging nearly 1 million barrels per day annually.
Although Permian output was recently revised somewhat higher, the data still suggest that production likely peaked on a monthly basis in August 2025. Since then, year-over-year growth has slowed dramatically, falling from roughly 1 million barrels per day to only about 100,000 barrels per day as of February. We suspect that sometime within the coming months, Permian year-over-year production growth may turn negative altogether.
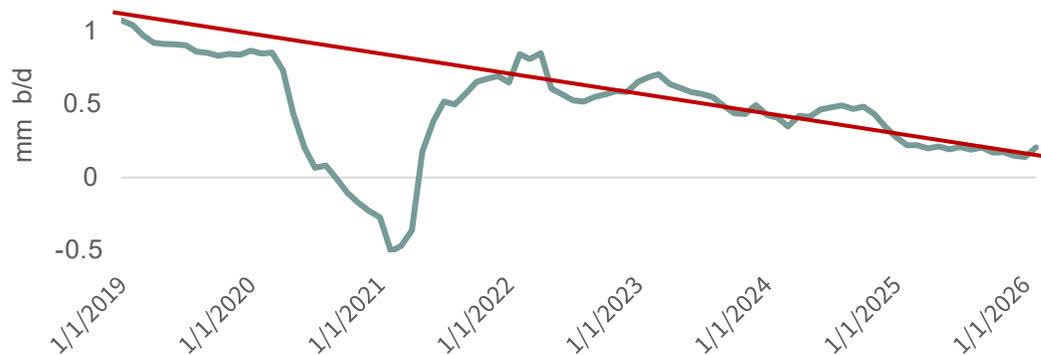
If U.S. supply growth falls short of the IEA's expectations, the implications for the broader market become considerably more serious. With shale no longer capable of delivering rapid incremental supply, the burden of balancing the market shifts increasingly toward longer-cycle projects such as deepwater developments and oil sands expansions — sources of production that typically require many years rather than months to materially increase output. Russian production, meanwhile, has also begun to decline under the strain of its prolonged conflict with Ukraine, and meaningful non-OPEC supply growth outside the United States appears limited as well.
The futures market will eventually need to reprice to levels sufficiently attractive to encourage new long-cycle projects to be sanctioned. The difficulty is that such projects require time — often many years — before meaningful production can reach the market. In the meantime, the burden of balancing the system will fall on price itself. Higher prices will be needed to restrain consumption.
Investors often assume that demand destruction is inherently bearish for oil. An important distinction must be made. There is a considerable difference between demand destruction caused by a weak economy unable to absorb higher prices, and demand destruction caused by a structurally undersupplied market using price to ration scarce supply. The former may indeed prove bearish. Historically, the latter has been anything but.
The historical record on this point is unambiguous. In real terms, material demand destruction has generally not emerged until oil prices approached roughly $150 per barrel or higher. WTI began this year at $58 per barrel. To clear at the levels history suggests would be required to ration demand in a structurally undersupplied market, prices would need to roughly triple from January's starting point — and that calculation assumes no further deterioration in supply, no inventory shortfall worse than presently expected, and no upward revision to demand. Each of those assumptions, in our view, is likely to prove too generous. The eight- to ten-fold repricing seen in prior structural shifts, which would conservatively imply $150 oil from the COVID lows, is not a tail-risk scenario in this context. It is the central case the market is refusing to price. We expect that to change.
For an organization supposedly in terminal decline, OPEC has displayed a remarkable instinct for survival. Over six decades the cartel has endured wars, embargoes, coups, revolutions, cheating scandals, price collapses, and repeated declarations of its imminent irrelevance. Yet somehow it has persisted. Which is why the announcement on April 28th, 2026—that the UAE would formally leave OPEC only days later, on May 1st—was greeted with such predictable excitement in financial circles.
The reaction was immediate and nearly unanimous. Analysts rushed to describe the move as evidence of deepening fractures within the cartel. The logic seemed straightforward enough. The Strait of Hormuz, once reopened, would allow Gulf production to surge back onto world markets. OPEC discipline, already strained, would disintegrate further. Another member had apparently concluded that cooperation was no longer worth the trouble. The implication was unmistakably bearish for oil.
Perhaps. But there is another way to view the matter.
A cartel derives its power from scarcity. So long as producers collectively withhold supply from the market, they possess influence over price. Once every producer begins selling all it can produce, however, the cartel ceases to function as a cartel at all. It becomes merely a collection of independent sellers participating in a free market.
This is why commodity cartels are so inherently fragile. Every member is asked to sacrifice revenue today in the hope that tighter supply will support prices tomorrow. The temptation to cheat is permanent. The negotiations over quota allocations are notoriously contentious because every barrel withheld by one country creates an opportunity for another. During periods of oversupply—when cuts become large and painful—the tensions often become severe.
Indeed, OPEC has nearly fractured several times before. In the late 1990s, rapidly rising Venezuelan production forced a painful renegotiation of quotas and triggered a marketshare conflict that badly weakened the organization. A similar dispute emerged during the late 1980s between Iraq and Kuwait, as both countries argued bitterly over output levels and pricing. The tensions escalated into one of the most consequential geopolitical crises of the modern oil era. More recently, in early 2020, Saudi Arabia and Russia (a member of OPEC+) failed to agree on production cuts during the collapse in demand caused by the COVID lockdowns. The resulting price war briefly drove oil futures negative in April of that year and brought the enlarged cartel system to the edge of collapse.
What makes the UAE's decision so curious is that it arrived during none of these conditions.
As of January, the so-called OPEC-9 were producing roughly 23.7 million barrels per day—among the highest levels ever recorded. The organization was not engaged in painful emergency cuts. Quite the opposite: it was in the process of gradually unwinding prior voluntary restraints. Official spare capacity had already fallen toward historically low levels, and effective spare capacity—the volume that could realistically and sustainably be brought to market on short notice—appeared to be approaching something close to zero.
Nor had recent meetings displayed the kind of public acrimony normally associated with cartel stress. The process, at least outwardly, appeared orderly enough.
So why leave now?
The conventional explanation is that the UAE wanted freedom to expand production aggressively. Yet this interpretation raises an awkward question. If OPEC members are already producing near effective capacity, then what exactly is the UAE being liberated to produce?
Perhaps the more important development is not that the UAE has abandoned OPEC, but that OPEC itself may already have ceased functioning in the manner most people still imagine.
If the cartel's practical influence depends upon holding meaningful production off the market, then a world with little remaining spare capacity is a world in which OPEC's real power has already begun to diminish. Membership, meanwhile, still imposes constraints. Participation in OPEC necessarily requires member states to subordinate portions of their sovereign decision-making to the collective interests of the group—and those interests do not always align.
The UAE, after all, has not always seen eye-to-eye with Saudi Arabia on regional policy, particularly regarding the Houthis in Yemen. Reports had also circulated for some time suggesting the Emirates were exploring warmer relations with Israel, a position unlikely to be universally welcomed within OPEC's membership. If the economic benefits of belonging to the cartel were steadily shrinking, then the political costs may simply have become harder to justify.
Viewed in this light, the timing of the UAE's departure begins to make more sense. Production quotas matter less when little spare production remains to allocate. And with Gulf exports constrained by the closure of the Strait, the announcement itself carried almost no immediate supply consequence. Under ordinary circumstances, news of a major producer leaving OPEC would almost certainly have pressured oil prices lower. Instead, prices rose on the day of the announcement—a small but revealing detail.
Markets may still be interpreting OPEC through the framework of past decades, when the cartel possessed abundant excess capacity and could meaningfully flood or starve the market at will. But perhaps the more important reality today is that the system has quietly tight-
If so, then the UAE's decision may ultimately be remembered not as the beginning of OPEC's collapse, but as an acknowledgment that the organization's era of genuine spare capacity had already ended. The implications of that possibility could prove profound.
The quarter began quietly enough and ended anything but. Gold and silver continuing their strong advances as the year started, reaching what traders of earlier generations would have called parabolic blow-off peaks just as January came to a close. Both metals then proceeded to collapse with equal speed. As gold and silver soared, a severe arctic blast settled over the central and eastern United States, sending domestic natural-gas prices sharply higher. In little more than a week, U.S. gas prices nearly tripled, only to give back the entire advance once weather forecasts began pointing toward an early conclusion to the winter heating season. By quarter's end, gas prices stood almost 20 percent below where they had begun.
Then President Donald Trump launched Operation Epic Fury, resulting in the immediate closure of the Strait of Hormuz. The effect on commodity markets was instantaneous. Anything that moved through the Strait was repriced almost at once. Crude oil surged 80 percent. LNG prices rose 130 percent. Refined products such as diesel jumped 115 percent, while nitrogen fertilizer prices advanced 80 percent. Markets abruptly rediscovered the degree to which modern industrial economies still depend upon uninterrupted energy flows through a remarkably narrow stretch of water.
The violence in commodity markets was quickly reflected in the major commodity indices. The Goldman Sachs Commodity Index, with its characteristically heavy exposure to energy, rose more than 35 percent during the quarter. The Rogers International Commodity Index, whose composition leans more heavily toward metals and agricultural commodities, performed nearly as well, advancing more than 30 percent. What had begun as a geopolitical shock in a narrow waterway soon spread, as commodity shocks invariably do, across the entire raw-materials complex.
Natural-resource equities proved to be excellent performers as well. The S&P North American Natural Resources Sector Index, aided by its substantial energy weighting, advanced a strong 26 percent during the quarter, while the S&P Global Natural Resources Stock Index, with relatively greater exposure to metals and agricultural companies, gained 20 percent.
The behavior of broader equity markets came as something of a surprise during the quarter, especially considering the sharp rise in geopolitical tension combined with surging commodity prices and its resulting negative impact on inflation. In the United States, the S&P 500 declined only a little more than 4 percent during the quarter. Globally, the MSCI World Index—a broad measure of international equities—proved even more resilient, falling only 3.5 percent. Markets appeared, at least for the moment, to regard the sudden upheaval in commodity prices not as the beginning of a broader economic disturbance, but merely as another isolated disruption to be absorbed and eventually forgotten.
There are decades where nothing happens, and there are weeks when decades happen. - Vladimir Lenin
The oil market seemed to follow Lenin’s famous observation in the first quarter: there are decades when nothing happens and weeks when decades happen. Events that ordinarily arrive years apart—and sometimes generations apart—were compressed into scarcely more than a few weeks. In the span of less than a month, oil went from being regarded as irrelevant by much of the investment world to becoming the single most important commodity in an unfolding geopolitical struggle.
On January 28, an ounce of gold bought 86 barrels of oil, the second-highest reading ever recorded. Only once before had the ratio climbed higher: on April 21, 2020, at the height of the COVID crisis, when a single ounce of gold purchased 97 barrels of Brent crude. The circumstances surrounding that earlier extreme were almost impossibly bleak. Global lockdowns had produced an unprecedented collapse in oil demand just as Saudi Arabia and Russia embarked upon a vicious price war at precisely the worst imaginable moment. The world suddenly found itself confronting a condition previously thought implausible—global oil-storage capacity nearing exhaustion.
Given how catastrophic the underlying fundamentals had become in the spring of 2020, it was hardly surprising that the gold-oil ratio reached such extraordinary levels. Indeed, the reading of 97 far exceeded the two previous peaks: the reading of 47 reached in January 2016, at the bitter end of the two-year market-share war between OPEC and the rapidly surging U.S. shale producers, and the reading of 40 reached during the summer of 1933, in the depths of the Great Depression.
What made the January 28 reading so remarkable was that it occurred absent any comparable catastrophe. Oil was not in the midst of a grueling market-share war such as the 2014–2016 battle between OPEC and non-OPEC producers, a conflict that drove oil prices down nearly 75 percent. Nor was the world confronting a global depression, financial panic, or demand collapse of historic proportions. Global inventories, while hardly tight, stood at levels not far from normal.
And yet an ounce of gold still bought 86 barrels of oil.
To us, this suggested something important about investor psychology. Oil had become not merely unloved, but effectively irrelevant in the minds of investors—an asset class no longer believed to possess either strategic importance or meaningful scarcity value. By the end of January, oil had become, in our view, among the most undervalued and under-owned assets in the world. Its valuation relative to gold told the story plainly enough.
Only four weeks later, the Iran war began, and the world suddenly found itself confronting what now appears to be the largest supply disruption in the 170-year history of the oil industry. In scarcely more than a month, oil had undergone a remarkable transformation in the public imagination. What had recently been regarded as a commodity of diminishing relevance became, almost overnight, the central variable in global economic and geopolitical calculations.
Having been left for dead by investors only weeks before, oil was abruptly rediscovered as something modern industrial societies still needed with an uncomfortable reliance. The uninterrupted flow of crude through a handful of strategic chokepoints, long treated as a relic of an earlier era, once again revealed itself to be indispensable.
These were indeed weeks when decades happen.
Reflecting the deeply negative psychology that gripped oil markets at the beginning of the year, crude prices entered January below $60 per barrel. Within weeks, however, prices had nearly doubled, with oil briefly approaching $120 before retreating from its highs. Even after the pullback, both West Texas Intermediate and Brent Crude finished the quarter comfortably above $100 per barrel. For the quarter as a whole, oil prices rose approximately 75 percent.
Energy equities responded accordingly. Leading the advance were the exploration-and-production companies, whose earnings and cash flows remain most directly exposed to changes in crude prices. The SPDR S&P Oil & Gas Exploration & Production ETF, which tracks the S&P Oil & Gas Exploration & Production Select Industry Index, surged 45 percent during the quarter. Oil-service stocks rose 42 percent, while the Energy Select Sector SPDR Fund, composed primarily of the large integrated oil companies, advanced nearly 38 percent. Only weeks after being broadly ignored, the energy sector had become the market's best-performing corner.
As for the eventual reopening of the Strait of Hormuz, we have no particular insight into how the political and military drama ultimately resolves itself. Events of this kind have a way of unfolding according to calculations unavailable to outside observers. We do, however, hold strong views regarding the closure's implications for oil prices going forward.
The Strait has now remained closed for seven weeks. During that period, we estimate that roughly 17 million barrels per day of oil supply have been disrupted, amounting in aggregate to nearly 600 million barrels of lost supply. Whatever the ultimate political outcome may prove to be, the physical consequences for the global oil market are already substantial.
The United States has pledged to release 172 million barrels of crude oil from its Strategic Petroleum Reserve as part of a broader coordinated release by Organisation for Economic Co-operation and Development nations expected to total roughly 400 million barrels. The purpose of the release is straightforward enough: to offset lost supply and bring down oil prices.
Even so, these releases appear likely to compensate for only a portion of the disruption. Some estimates suggest that the ultimate global release may total closer to 300 million barrels rather than 400 million. Either way, the arithmetic becomes increasingly unfavorable the longer the Strait remains closed. Lost supply continues accumulating day by day, while global inventories are steadily drawn down in response. What began as a temporary supply shock increasingly threatens to become a sustained inventory problem—one that would place additional upward pressure on oil prices over time.
In the opening section of this letter, we discussed the global inventory drawdown resulting from the closure of the Strait and its implications for long-term oil prices. The important point, in our view, is that the oil market had already been relatively balanced before the disruption began. This was not a market suffering from chronic oversupply or burdened by excessive inventories.
At the same time, non-OPEC supply growth has slowed markedly over the past two years. As a result, rebuilding global inventories back toward normal levels—even with the planned Strategic Petroleum Reserve releases—is likely to prove far more difficult than many observers currently assume. The present disruption is therefore colliding with an oil market that had already become structurally tighter beneath the surface.
The underlying forces that we believe will drive this oil bull market forward were not created by the closure of the Strait itself. The closure merely exposed conditions that had already been developing for years. As we have argued repeatedly, non-OPEC supply growth has been slowing steadily, and there now exists a meaningful possibility that it could turn negative within the next several years. Should that occur, the geopolitical implications would be profound.
Oil-market analysts have consistently chosen to minimize this reality. Yet the relationship is neither subtle nor especially complicated: when non-OPEC supply growth slows while global oil demand continues to rise—as is happening today—OPEC inevitably regains both market share and pricing power. For much of the last fifteen years, surging U.S. shale production obscured this dynamic. As that growth now begins to falter, the balance of power in global oil markets may be shifting back toward the traditional producers of the Middle East.
With U.S. shale production now beginning to roll over—the sole meaningful source of non-OPEC supply growth for much of the last fifteen years—we believe this period has already begun. The implications extend well beyond the present conflict. It is entirely possible that the current crisis represents only the first of a series of geopolitical confrontations that will increasingly shape the Middle East as OPEC’s control over global oil production steadily expands.
In our view, the great bull market in oil has only just begun.
For investors who missed the initial advance in oil prices and energy equities, periods of weakness should, we believe, be viewed as opportunities rather than warnings. In particular, any pullback associated with a reopening of the Strait of Hormuz may ultimately prove temporary in nature, obscuring much larger structural forces now developing beneath the surface of the oil market.
Extreme volatility has always been the defining characteristic of the U.S. natural-gas market. Indeed, among major commodities, natural gas occupies a category largely its own. Subject to violent swings in demand driven by unpredictable winter cold and summer heat, and constrained by the physical limitations of storage and export infrastructure, gas prices have long exhibited a capacity for sudden and often brutal price movements. Few markets have inflicted greater punishment on speculators caught leaning the wrong way. As 2026 unfolded, natural gas once again demonstrated that its reputation for instability remains thoroughly deserved.
U.S. natural-gas prices began the year at $3.62 per mcf and, by January 28, had surged to $7.50—an increase of more than 100 percent in less than four weeks. The move proved short-lived. Over the following ten days, prices collapsed by more than 50 percent. By quarter's end, natural gas traded near $3.00 per mcf, roughly 20 percent below where it had started the year. Few other markets are capable of producing such extraordinary price movements in so compressed a span of time, only to end almost precisely where they started—or lower.
The quarter's dramatic surge and subsequent collapse in natural-gas prices was driven almost entirely by weather. Bitterly cold temperatures settled over the eastern half of the United States through much of January, producing the largest weekly storage draw ever recorded. For the week ending January 30, approximately 360 bcf of gas was withdrawn from storage, narrowly surpassing the previous record withdrawal of 359 bcf set during the first week of January 2018.
At the time, weather models projected colder-than-normal temperatures extending deep into February and perhaps even into March, raising fears that inventories could become dangerously depleted before the arrival of spring. Then, in a fashion recognizable to anyone with long histories of gas market investment experience, forecasts abruptly reversed themselves. Models began projecting significantly warmer-than-normal temperatures for the balance of the winter season—a forecast that, in retrospect, proved remarkably accurate. March, for example, now appears likely to rank among the warmest ever recorded on the continental US.
The market responded with characteristic violence. As warmer-weather forecasts spread through trading desks and storage models alike, the prompt natural-gas contract collapsed, falling nearly 50 percent in a matter of days. In few markets does a shift in atmospheric expectations translate so quickly—or so ruthlessly—into financial consequences.
Global natural-gas prices were also extraordinarily volatile during the quarter, although in this case the instability had little to do with weather. International gas prices began the year near $9.50 per mmbtu, a level closely aligned with their traditional six-to-one BTU relationship to a $60 Brent Crude oil price. Then came war, followed by the closure of the Strait of Hormuz.
Qatar supplies nearly 20 percent of the world's LNG, and with the shutdown of the Strait—and the corresponding surge in oil prices—international gas markets quickly repriced. LNG prices eventually climbed well above $22 per mmbtu, a remarkable level but one still broadly consistent with the historical energy-equivalent relationship between gas and oil.
More troubling, however, were reports that Iranian missile strikes had caused extensive damage to Qatar's Ras Laffan Industrial City, home to the country's LNG export trains as well as its gas-to-liquids facilities, which themselves represent an important source of global diesel supply. Although reliable details remain limited, our conversations with major LNG participants suggest that the damage may be substantial and that restoring Qatar's LNG export capacity could require considerable time—even after the Strait of Hormuz is ultimately reopened. What initially appeared to be a temporary transportation disruption increasingly risks becoming a more prolonged impairment to global LNG supply itself.
The divergence between domestic and international natural-gas prices has once again reached extraordinary levels. U.S. gas presently trades near $3.00 per mcf, while international prices remain close to $20 per mmbtu. Put differently, the BTU contained within a U.S. natural-gas molecule now trades at roughly an 85 percent discount to the BTU contained in an internationally traded molecule.
Such disparities are difficult to sustain indefinitely. They persist not because the energy content differs, but because infrastructure, export capacity, and geography temporarily prevent the two markets from fully converging. In effect, the same unit of energy now carries radically different values depending solely upon where it happens to reside.
We have written for several years now about the eventual convergence between depressed U.S. natural-gas prices and far higher international prices, and we remain firmly convinced that this convergence will ultimately occur. We have, however, been wrong about certain aspects of the timing. Most notably, we were too early in forecasting a rollover in Permian Basin natural-gas production, a subject we discussed extensively in our previous letter.
The Permian today remains effectively the only meaningful source of growth in the U.S. natural-gas story, and we continue to believe that production growth there will begin materially slowing during the second half of 2026. Yet many of the forces delaying our bullish thesis have been largely outside anyone's control. Three of the last four winters have been warmer than normal across the United States. The winters of 2022–2023 and 2023–2024 were both among the warmest on record. The winter of 2024–2025, though materially colder, still averaged roughly two degrees Fahrenheit above normal. And the most recent winter has again proven exceptionally warm. While an intense cold outbreak gripped the eastern half of the country during January, the western United States experienced its warmest December-through-February period ever recorded.
Another important delay came from the explosion at the Freeport LNG facility in June 2022, which temporarily removed nearly 2 bcf per day of demand from the U.S. gas market—roughly 2 percent of total domestic consumption—for almost an entire year.
Despite these setbacks, our central thesis remains unchanged. The primary reason we continue to expect eventual price convergence is the slowing growth rate of shale-gas supply itself. As the accompanying chart illustrates, essentially all growth in U.S. dry-gas production over the last decade has come from the shale plays. Increasing evidence now suggests that nearly every major shale-gas basin outside the Permian has already begun to roll over.
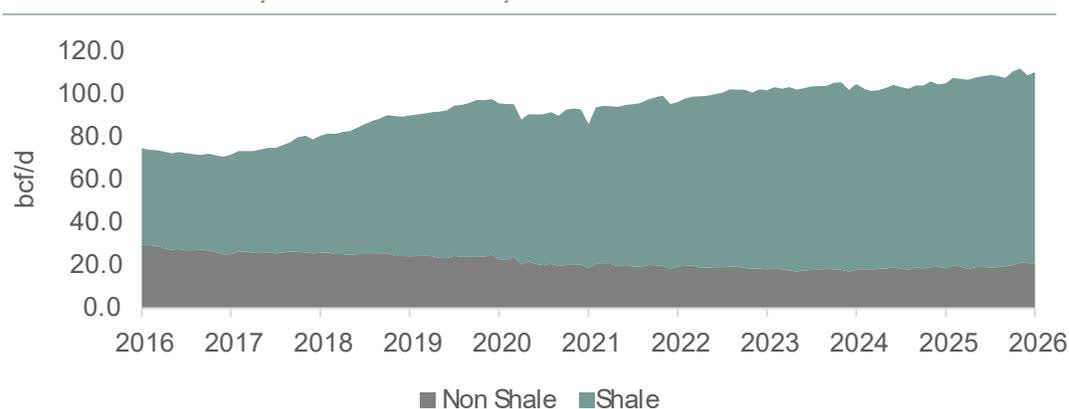
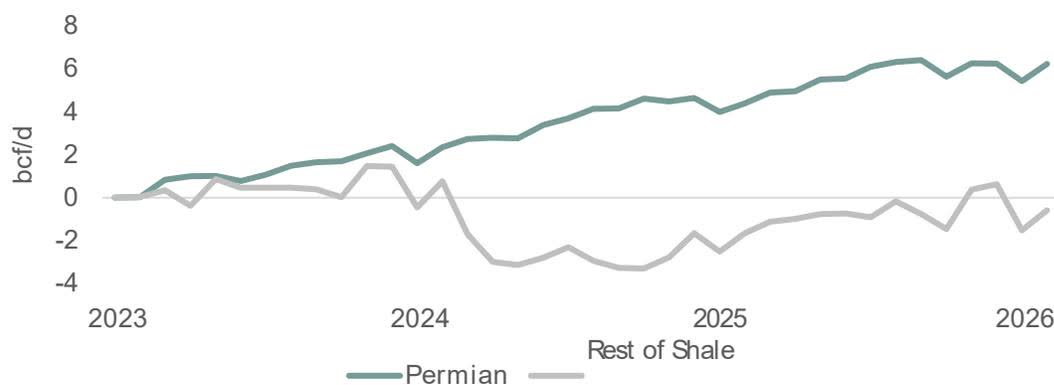
Natural-gas bears have enjoyed a remarkable succession of favorable developments over the last four years. Exceptionally warm winters across the United States have repeatedly obscured the tightening forces quietly building beneath the surface of the domestic gas market. Time and again, weather has arrived to temporarily relieve conditions that otherwise appeared increasingly constructive for prices.
In our view, another unusually warm winter has once again provided natural-resource investors with an attractive opportunity. Moreover, the damage sustained by Qatar's natural-gas infrastructure may keep international LNG prices elevated for a considerable period even after the Strait of Hormuz eventually reopens.
The result is a pricing disparity that remains difficult to ignore. At present, the U.S. natural-gas molecule trades at nearly a 90 percent discount to international prices. Markets can sustain such dislocations longer than many expect, but they rarely sustain them forever. To us, purchasing American natural gas at a fraction of the prevailing world price continues to represent one of the more compelling opportunities in commodity markets today.
Global agricultural markets absorbed yet another wartime shock in the first quarter, though this one arrived in forms quite different from the upheaval following Russia's invasion of Ukraine in 2022. The earlier conflict struck at the very heart of the world's grain trade as well as its fertilizer supply. At the time, Ukraine accounted for roughly 15% of globally traded seaborne corn, while Ukraine and Russia together supplied nearly 30% of the world's seaborne wheat exports. Both flows, so long taken for granted by world commodity markets, were severely disrupted once the war began.
The Strait of Hormuz crisis, by contrast, presents an altogether different picture. The Gulf states export virtually no grain into world markets, and so the disruption caused by the Iran war has centered not on crops themselves, but on fertilizers. Unlike the Ukraine-Russia conflict—which simultaneously disrupted both grain supplies and the fertilizers needed to grow them—the closure of the Strait of Hormuz has, at least thus far, produced a far more concentrated shock: a fertilizer supply shock, pure and simple.
Powered by their enormous natural gas reserves—particularly those of Saudi Arabia and Qatar—the Gulf states have quietly grown into some of the most important suppliers in the global fertilizer trade. Nearly 50% of all seaborne traded urea, the solid form of nitrogen fertilizer, and roughly 25% of globally traded ammonia, its liquid counterpart, pass through the Strait of Hormuz. In phosphate as well, the Gulf states occupy a position of considerable importance, accounting for nearly 20% of total world production.
Roughly 50% of globally traded seaborne sulfuric acid—another critical input in fertilizer production—also flows through the Strait of Hormuz. Sulfuric acid occupies a surprisingly central role in global agriculture; nearly 80% of the world's supply is ultimately consumed in the manufacture of various fertilizer compounds, particularly phosphates.
Agricultural commodities responded in sharply different ways during the first quarter, largely according to the degree to which each market was exposed to Gulf War-related supply disruptions. Urea, whose seaborne trade routes were hit hardest by the closure of the Strait, surged 70%. Phosphate fertilizer, the second most exposed nutrient market, rose 13%. Potash, by contrast—largely untouched by Gulf-related disruptions—actually declined 2% over the same period.
Grain markets, oddly enough, remained comparatively subdued. Wheat prices led the complex higher, advancing 20% during the quarter. From September through February, the lower 48 states experienced their third driest such period on record, and conditions for the 2025–2026 winter wheat crop continued to deteriorate steadily. The USDA now rates only 35% of this year's crop as being in “good” condition, down from 47% a year ago. Corn prices rose 4%, while soybeans advanced 10%.
As we enter the 2026–2027 agricultural year, the landscape presents a curious mixture of near-term negatives alongside several potentially explosive bullish developments. Most immediate, of course, is the fertilizer shortage created by the Gulf War and the closure of the Strait of Hormuz—a disruption that, if prolonged, could begin to weigh meaningfully on global crop yields during the 2026 growing season. Set against this, however, are the still-bearish inventory conditions prevailing in U.S. corn markets today, where ample stockpiles continue to exert a calming influence on prices despite the growing list of supply-side risks beginning to emerge elsewhere in the system.
The USDA's latest WASDE report continues to project very high corn ending stocks for the 2025–2026 crop year, a reality that, for the moment at least, has helped preserve the market's broadly complacent tone. Over the longer term, however, weather conditions—particularly across North America—continue to deteriorate in a manner that is becoming increasingly difficult to dismiss. As noted earlier, the United States has just experienced its third driest winter on record, a development starkly illustrated in NASA's drought maps.
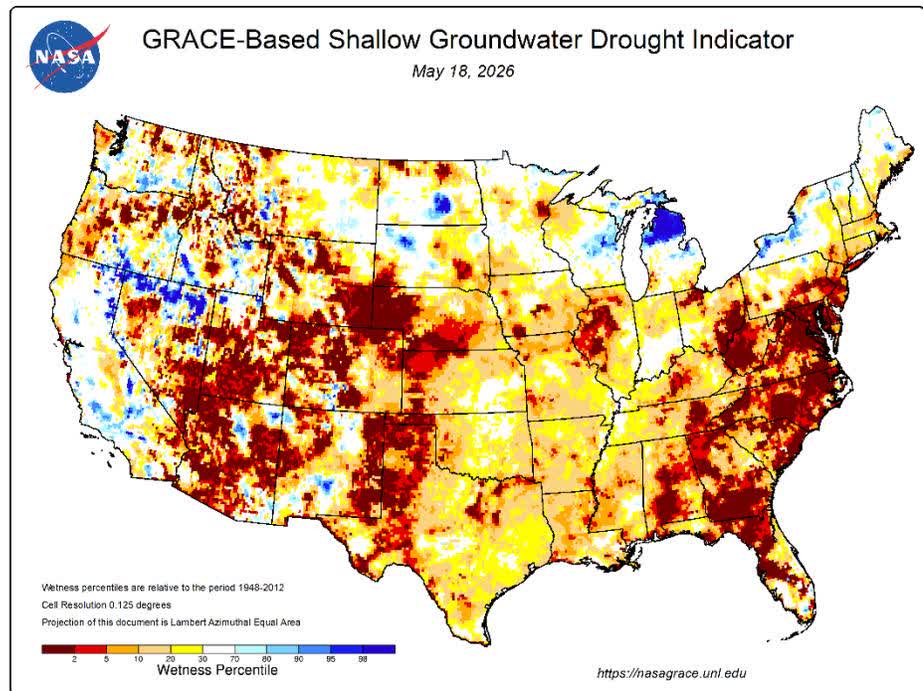
Even officials within the USDA have begun to sound unusually uneasy. Brad Rippey, author of the agency's weekly U.S. Drought Monitor, recently warned: "We're in a position here where we're going into the growing season and into the spring with record low, or near-record-low soil moisture across the country. Things are bad and getting worse in a hurry. "
Last quarter, confronted with persistently bearish ending stocks—particularly in corn—and with virtually no constructive news emerging from the grain markets, we discussed our decision to reduce fertilizer equity exposure toward the end of 2025. The bear market in both grains and fertilizers, now stretching into its fourth year, appeared stubbornly determined to persist longer than many investors had expected.
In retrospect, that decision proved mistaken, though chiefly because we failed to anticipate an event as consequential as the closing of the Strait of Hormuz. The resulting disruption to global fertilizer supply—especially within the nitrogen complex—has been immense. At the same time, growing conditions across North America have deteriorated materially over the past three months. Taken together, these developments have led us to begin reaccumulating positions in fertilizer equities, which, under today's tightening supply conditions, could perform exceptionally well should grain prices finally emerge from their prolonged bear market sometime within the next six months.
There is, however, another development beginning to unfold—one less dramatic than war headlines perhaps, but potentially just as important for agricultural markets over the next several years. A meaningful shift in global climate patterns now appears to be underway: the transition from La Niña conditions toward an emerging El Niño.
Global weather patterns over the past four years have been shaped largely by a significant La Niña event—a climatic phenomenon associated with unusually cold temperatures across the eastern and central Pacific Ocean. One of La Niña's more familiar consequences is the persistent dryness it tends to impose upon the western and southern United States, a pattern now plainly visible in the soil moisture maps discussed earlier.
Meteorological signals, however, increasingly suggest that an El Niño may now be beginning to form in the central Pacific. In contrast to La Niña, an El Niño event is characterized by unusually warm Pacific Ocean temperatures, and its effects on North American weather patterns can be profound. Depending on both its timing and eventual strength, an El Niño could bring substantially greater rainfall this summer not only to the western and southern United States, but also to the critically important Corn Belt.
At present, though, considerable uncertainty remains. We do not yet know whether the El Niño will arrive in late spring or much later in the summer, nor do we have any reliable sense yet of how intense it may ultimately become. A strong and early-forming El Niño could rapidly transform today's exceptionally dry U.S. growing conditions into something far more favorable, an outcome that would likely place significant downward pressure on grain prices. Given these uncertainties, we believe the prudent course today is to establish only partial positions, with the intention of adding more aggressively should the El Niño arrive later than expected or prove materially weaker in strength.
Gold and silver markets provided no shortage of drama during the first quarter. Gold prices, which began the year at roughly $4,340 per ounce, surged in the opening weeks with a manic energy usually seen only in the final stages of a precious metals bull market. Over the next four weeks prices surged nearly 25%, ultimately peaking above $5,300 per ounce on January 28th.
The ascent, however, proved no more durable than it was spectacular. The following week gold prices abruptly collapsed 15%, only to rally sharply once again and produce a double top by March 2nd. After nearly recording yet another all-time high, gold reversed violently for a second time, falling almost 20%. By quarter's end, after all the excitement, gold prices had finished not very far from where they began.
The silver sell signal—which arrived with remarkable force at the beginning of 2026—already appears to be exerting its familiar and deeply negative influence over both gold and silver markets. Readers interested in the mechanics of this signal, and the important role it has historically played in precious metals cycles, should consult our 3Q2025 and 4Q2025 quarterly letters, where we discussed the phenomenon and its implications in detail.
What is notable today is how closely silver's recent trading behavior resembles the early stages of prior post-signal periods. The message being sent by the silver market is not an encouraging one. At best, it suggests gold may spend the next two to three years grinding sideways in frustrating fashion; at worst, it points toward a much weaker environment altogether—one potentially reminiscent of the difficult periods that followed the sell signals of 1974, 1979, 2011.
Silver's movements during the quarter were even more violent. Beginning the year at roughly $70 per ounce, silver embarked on a breathtaking advance over the following four weeks, surging nearly 65% and reaching a peak of $115 per ounce on January 28th; however, the enthusiasm proved fleeting. Prices soon collapsed almost 60%, erasing nearly the entirety of the year's gains in remarkably short order.
What followed was perhaps even more telling. Unlike gold, whose rebound carried prices back toward prior highs, silver's reflex rally was notably weak. Prices never came close to revisiting their earlier peak. After this failed recovery attempt, silver rolled over once again, declining another 30% and finishing the quarter only marginally above where it had begun.
Gold and silver equities faithfully mirrored the turbulence of the underlying metals themselves. The stocks surged, collapsed, rallied again, and then collapsed once more, ultimately finishing the quarter only modestly above where they had begun. Gold equities, as measured by the GDX ETF (GDX), ended the quarter up 9%, while silver equities, represented by the SIL ETF (SIL), finished higher by 8%.
There are already signs that bearish divergences may be beginning to emerge beneath the surface of both gold and silver markets. Most important, the sharp rise in oil prices has introduced the increasingly uncomfortable possibility that real interest rates may rise rather than fall—a development that has rarely been friendly to gold prices.
Western investors may already be reacting to this changing backdrop. Across the 18 physical gold ETFs we track, investors steadily accumulated gold throughout January and February, adding nearly 60 tonnes over the two-month period. But once the Strait of Hormuz closed and oil prices began their rapid ascent, the behavior of investors changed abruptly. Accumulation quickly gave way to liquidation. In March alone, western investors sold nearly 90 tonnes of gold from these physical ETF holdings.
For the quarter as a whole, the 18 physical gold ETFs we monitor recorded net liquidations of nearly 30 tonnes. Meanwhile, the steady liquidation in physical silver holdings may already be evolving into a more established trend. The eight physical silver ETFs we track appear to have peaked at the end of 2025 and have remained in persistent liquidation mode ever since.
Collectively, these silver ETFs have liquidated nearly 2,000 tonnes since the beginning of the year, representing roughly one-third of the metal accumulated during the great silver accumulation phase that began in the summer of 2024.
Outside the West, the picture for physical gold demand was more mixed. Jewelry demand in both China and India weakened sharply during the first quarter as surging gold prices discouraged buyers. Investment demand, however, diverged meaningfully between the two countries. In India, physical gold investment demand fell 35% compared with the fourth quarter of last year. In China, by contrast, investment demand surged 72%, aided in part by changes to the VAT structure. Taken together, Asian physical gold demand presented a far more complicated and uneven picture than headline price action alone might suggest.
There are also tentative signs that the era of exceptionally strong central bank gold demand may be beginning to slow. The great surprise in the first quarter was the Turkish Central Bank's sale of 70 tonnes of gold—a transaction that caught many precious metals investors off guard. The apparent purpose of the sale was to secure desperately needed foreign currency reserves to help defend the Turkish lira, which has weakened substantially amid surging oil and natural gas prices.
While Turkish officials have made no formal announcement regarding the motivation behind the sale, the implications may nevertheless prove important. For several years central banks have functioned as some of the most reliable and price-insensitive buyers in the gold market. Turkey's decision, however, potentially hints at the beginning of a reversal in that role—from buyers to sellers—as economic pressures intensify and governments increasingly find themselves forced to defend weakening currencies during what appears to be the early stages of a broader energy-driven economic crisis, now further aggravated by the turmoil in the Gulf.
Setting aside the Turkish sale, which was only disclosed at the very end of March, central bank buying activity earlier in the quarter had already appeared surprisingly subdued. In January, net central bank purchases totaled only 5 tonnes. By far the most notable transaction during the month was a 9-tonne sale by the Russian government, almost certainly undertaken to help finance the continuing war effort in Ukraine.
In February, official sector buying recovered modestly, rebounding to 27 net tonnes, though Russia again remained a seller, liquidating an additional 6 tonnes. While none of these figures alone are decisive, they do suggest that the previously relentless pace of central bank accumulation may already be losing some momentum beneath the surface.
For the quarter as a whole, total central bank gold purchases amounted to 244 tonnes—up 17% from the fourth quarter, though essentially flat on a year-over-year basis. One quarter, of course, does not establish a trend. Yet the combination of Turkey's newly announced gold sale and the noticeably diminished enthusiasm displayed by China's central bank—which purchased only 7 tonnes during the quarter—raises the possibility that official-sector demand may finally be beginning to slow after several years of extraordinary accumulation.
Central bank activity will be extraordinarily important to monitor over the next twelve months, particularly now that the silver sell signal has been triggered. If official-sector buying remains robust—as it did following the 2020 signal—the coming decline in gold prices could prove relatively manageable. In the post-2020 correction, gold prices fell only 20% peak-to-trough, while silver declined 40% and gold equities nearly 50%. Painful, certainly, but still well within the range of an ordinary cyclical retrenchment inside a broader secular bull market.
The risks become far more serious, however, if central bank demand begins to weaken materially. In that case, the current environment could begin to resemble the period that followed the 2011 silver sell signal. The declines that followed were substantial: gold prices ultimately fell 45% from peak to trough, silver collapsed 75%, and gold equities declined by nearly 80%. The difference between those two historical outcomes may ultimately depend less on western investors and more on the behavior of central banks. Will they continue buying aggressively—or begin stepping away from the market altogether?
Following both the 2011 and 2020 silver sell signals, western investors spent the subsequent four years liquidating enormous quantities of gold—well over 1,200 tonnes after the 2011 signal and more than 1,000 tonnes following the 2020 episode. The crucial difference between those two periods, however, concerned the behavior of central banks.
In the four years after 2011, central banks purchased roughly 2,400 tonnes of gold. While substantial, those purchases ultimately proved insufficient to offset the scale of western liquidation. The result was a brutal decline in gold prices of approximately 45%.
The period following the 2020 signal unfolded very differently. Over the next four years, central banks accumulated roughly 3,700 tonnes of gold—a remarkable 50% increase relative to the post-2011 period. That buying fell only slightly short of fully absorbing western selling pressure, and in retrospect, central bank demand became the crucial stabilizing force preventing the post-2020 correction from developing into something far more severe.
We believe investors now stand at the beginning of what is likely to be a long and frustrating period for gold prices. The central question is no longer whether a pullback in gold, silver, and precious metals equities will occur, but rather how deep and prolonged that pullback ultimately becomes.
The sharp rise in oil prices has materially increased the probability that real interest rates may begin rising rather than falling, a development that may already be exerting a negative influence on western investment demand for precious metals. Should those pressures intensify, the current environment could begin to resemble the difficult post-2011 period far more than the comparatively mild correction that followed the 2020 signal.
For precious metals investors, therefore, the real question is one of severity. Will the coming decline resemble the painful retrenchments of 1974, 1979, and 2011, or will it prove relatively contained, as it did after 2020? In our view, the answer will depend overwhelmingly on the behavior of central banks. Whether they continue absorbing western liquidation—or begin retreating from the market themselves—will likely determine the ultimate depth of the correction. It is a development we intend to monitor very closely over the next twelve months.
Precious metals presently appear less compelling relative to other asset classes, particularly for portfolios operating under meaningful performance constraints. We remain convinced that the coming years will eventually present extraordinary buying opportunities in gold, silver, and related equities. But in our view, that opportunity has not yet arrived.
As we have argued repeatedly in prior letters, we believe energy-related investments—especially those possessing strong earnings leverage to higher oil prices—are likely to outperform gold and silver investments by a considerable margin. That relative outperformance, accelerated dramatically by the closure of the Strait of Hormuz, appears already to be underway.
Accordingly, we believe investors should continue reducing exposure to gold, silver, and precious metals equities while significantly increasing exposure to energy-related investments. The correction in precious metals, in our opinion, has only just begun. The bull market in oil, by contrast, may only be entering its opening stages.
Coal prices in the United States rose only modestly during the quarter; however, the same could not be said for the rest of the world. Domestic coal benchmarks in Central Appalachia, the Illinois Basin, and the Powder River Basin advanced 6%, 5%, and 8% respectively. International markets, however, reacted far more violently to the closure of the Strait of Hormuz. Australian seaborne thermal coal prices surged 35%, while South African thermal coal exported through Richards Bay rose a strong 30%.
The reason was straightforward enough. Across Asia, governments have begun rapidly increasing coal consumption as they struggle to compensate for severe energy shortfalls created by the disruption in liquified natural gas flows following the closure of the Strait. LNG, of course, remains one of the primary fuels used to generate electricity throughout much of Asia. Now twelve weeks into the crisis, nearly 20% of global LNG trade has been disrupted, leaving countries scrambling for replacement energy supplies. In response, at least eight nations have already either increased coal consumption outright or authorized substantial increases in coal-fired electricity generation.
China has already increased coal consumption as it races to compensate for the loss of LNG supply. India, meanwhile, has ordered coal-fired power plants to operate at full capacity as the country endures a severe early-spring heatwave, with temperatures across many regions reaching between 40 and 45 degrees Celsius—roughly 104 to 113 degrees Fahrenheit.
Japan, in a move that would have seemed politically improbable only a short time ago, has suspended restrictions on older and less-efficient coal-fired plants through 2027. South Korea has gone further still, temporarily removing the country's 80% cap on coal-fired power generation. The immediate effect has been a noticeable increase in South Korea's coal consumption, but perhaps more importantly, growing doubts as to whether South Korea will ultimately proceed with its earlier pledge to retire 40 of its 61 operating coal-fired plants.
Indonesia, even before the closure of the Strait, had already begun sharply restricting coal exports in order to prioritize supply for its domestic coal-fired generating fleet. Elsewhere across Asia, governments have responded with increasing urgency. Thailand has ordered previously decommissioned coal plants to restart operations and has directed existing facilities to increase electricity output. The Philippines has declared a "national energy emergency" and initiated plans to expand coal-fired generation materially.
Vietnam, meanwhile, is aggressively increasing coal-fired electricity production while simultaneously searching for additional imported coal supplies. Bangladesh has likewise announced plans to raise coal-fired generation. Across the region, measures that only recently would have been described as temporary exceptions increasingly resemble the early stages of a much broader policy reversal.
In each of these countries, coal is being called upon to replace lost natural gas supply for one simple reason: it remains the cheapest and most readily available substitute capable of delivering reliable baseload power at scale.
How long the Strait of Hormuz will remain closed is, at least for now, still an open question. Most analysts continue to assume that the current surge in coal consumption is merely temporary and that usage levels will quickly revert to their pre-war trends once LNG flows normalize. We are less certain. In our view, the situation may prove considerably more complicated—and far more durable—than current consensus expects.
Even if the Strait of Hormuz were to reopen completely and normal passage resume without restriction, we suspect many Asian governments have now been reminded—rather forcefully—of the dangers inherent in relying so heavily on an energy source vulnerable to sudden geopolitical disruption. As we have argued repeatedly in prior letters, for many of these countries continued economic growth ultimately depends upon maintaining large-scale access to cheap, reliable electricity, and that reality almost certainly requires coal-fired generation to remain a major part of their future energy mix.
Many energy analysts continue to insist that rising investment in renewables will steadily eliminate the need for coal. Our readers already know that we disagree with this view quite strongly. Events of the past several months have only reinforced our skepticism.
Indeed, one of the more important long-term consequences of the Strait closure may be political rather than purely economic. The crisis may provide governments across Asia with the justification needed to delay, soften, or quietly abandon previously announced coal phaseout commitments. Indonesia had already begun moving in this direction even before the current crisis emerged. Will South Korea now quietly follow? Japan, for example, has pledged to retire its least efficient coal plants by 2030—facilities that nonetheless still account for nearly 25% of the country's coal-fired generating capacity. One increasingly wonders whether those phaseout plans will simply fade away, as wrenching geo-political events divert public attention and provide distractions.
For these countries, future economic prosperity will depend above all on the ability to generate large quantities of cheap and reliable electricity—qualities that renewable energy systems, at least in their current form, have consistently struggled to provide. The implication seems increasingly difficult to avoid: coal, and in the long-run nuclear power, will certainly remain a significant part of Asia's future generating mix.
Yet perhaps the single most important development affecting global coal markets during the quarter attracted remarkably little attention: Indonesia—the world's largest coal exporter by a considerable margin—announced plans to reduce national coal production by 25%.
Indonesian coal production reached a record 840 million tonnes in 2024. Plans are now in place to reduce output to roughly 600 million tonnes this year. Export quotas for the country's major producers have also been cut materially. The logic behind both the production cuts and export restrictions is straightforward. First, the Indonesian authorities are attempting to stabilize and improve coal prices after years of weakness, and in turn improve the profitability of the domestic coal industry, which has suffered hugely because of low prices. In many respects, the policy resembles a classic commodity-market supply response, in this case forced by the government.
Second, the Indonesian government is seeking to increase domestic coal consumption materially, and the reduction in export quotas is intended to ensure adequate supplies remains available for the country's own power generation needs. Over the past decade, Indonesia expanded coal production by nearly 400 million tonnes—a staggering increase surpassed only by China's roughly 900 million tonne expansion and India's 440 million tonne increase.
In the process, Indonesia transformed itself into the world's dominant coal exporter. Indonesian coal exports, which peaked at roughly 550 million tonnes in 2024, now account for more than 30% of the global seaborne coal trade. For a market so dependent upon Indonesian supply growth for the better part of a decade, the implications of such a large and deliberate production reduction are potentially enormous.
At precisely the moment global coal demand is beginning to show renewed signs of strength, Indonesia's decision to impose such large production cuts is likely to introduce substantial additional tightness into world coal markets over the next several years. In commodity markets, it is rarely comfortable when the largest supplier begins withdrawing supply just as demand unexpectedly accelerates.
We view this as an enormously bullish development for global coal markets. What is perhaps most striking, however, is how little attention these developments have received. Despite the scale of the shift now underway, remarkably few analysts appear willing to discuss the increasingly constructive fundamentals emerging across the coal industry.
As a final point, we noted in last quarter's letter that the fifteen-year decline in U.S. coal consumption appeared finally to have come to an end. We also suggested that coal demand in the United States could begin growing again in the years ahead as rapidly rising electricity demand forces utilities to dispatch more power from existing coal-fired plants—a development that first began to emerge during 2025.
It now appears that U.S. coal consumption is growing at roughly a 7% rate—the first meaningful increase recorded in nearly fifteen years. Most analysts remain convinced that the long-term secular decline in coal demand is firmly intact and that last year's increase will reverse itself sometime during 2026. We are less persuaded.
As we discussed in last quarter's letter, we believe the long era of coal plant retirements may itself be approaching an end. Indeed, coal consumption could continue rising as surging electricity demand from data centers increasingly strains the power grid. In the short term, much of that additional demand can realistically be met only by existing coal-fired generation capacity.
There may also be an important weather component developing. As discussed earlier in the agricultural section of this letter, climate patterns now appear to be shifting toward a possible El Niño event. Should that transition occur, it could produce significantly above-average summer temperatures across large portions of the United States this year—another development that would likely prove supportive for domestic coal consumption through increased electricity demand.
It may sound difficult to believe, but we could even be witnessing the early stages of a new construction cycle for coal-fired generating plants in the United States. This possibility may not be as far-fetched as it first appears; as evidence we would highlight Terra Energy's recent announcement that it plans to construct a new 1.25 gigawatt coal-fired generating facility in Alaska.
The proposal represents a remarkable reversal for the U.S. coal industry, which has not seen a new coal-fired plant built since 2013. Yet Alaska's circumstances illustrate the increasingly uncomfortable realities now confronting many power markets. Electricity demand in the state—particularly around Anchorage—is rising rapidly, while the region simultaneously faces a developing energy shortage. With natural gas production from the Cook Inlet in long-term decline, Alaska has recognized that building a large coal-fired facility is not merely an option, but the only practical solution to a looming electricity shortage.
In previous letters, we have discussed how coal equities have led virtually every major commodity bull market of the past 120 years. Since the current commodity cycle began, coal stocks once again appear to have resumed that familiar leadership role.
From the commodity market lows reached in the summer of 2020, the Dow Jones Coal Mining Index has risen roughly 700%, compared with a 150% return for the S&P 500 Index and approximately 235% for the S&P North American Natural Resources Index. Beneath those extraordinary returns lies a fundamental backdrop that has once again become exceptionally bullish for the coal industry.
Unexpected surges in global demand, combined with enormous production cuts from Indonesia—the world’s largest coal exporter—are likely, in our view, to drive coal prices materially higher in the years ahead. Commodity markets rarely remain balanced for long when supply discipline emerges just as demand begins surprising to the upside.
What makes the current setup especially unusual is how neglected the industry remains. Very few analysts still actively cover coal, and even fewer investors appear to appreciate how constructive the underlying fundamentals have become. Yet the conditions now falling into place bear all the hallmarks of the early stages of a major bull market.
We believe a substantial advance in coal prices is now beginning to unfold. Coal equities currently stand out as one of the more favorably positioned segments within the global natural-resource equity universe.
“Berlin urged to join nuclear power revival” Financial Times April 1, 2026
Uranium markets displayed a decidedly upward bias during the first quarter. Spot prices began the year at roughly $82 per pound and then advanced sharply, ultimately climbing above $103 by the end of January. Strong investor demand, combined with the reemergence of utility buying, pushed uranium prices back through the psychologically important $100-per-pound level for the first time since the market briefly crossed that threshold in January 2024.
As has often been the case in uranium markets, however, strength was followed by volatility. After peaking near $103 per pound, prices pulled back sharply before stabilizing. Even so, uranium ultimately finished the quarter at approximately $85 per pound, up 4% overall for the period.
Long-term uranium contract prices also continued moving higher during the quarter. Cameco (CCJ)’s published long-term contract price, which stood at $85.50 per pound at the end of 2025, finished the first quarter at $91.50—a gain of roughly 6%. Beneath the volatility of the spot market, the longer-term pricing structure of the uranium market continues to strengthen steadily.
In prior letters, we have discussed at length the remarkably robust demand story that has emerged in uranium markets over the past five years. Nuclear plants once slated for retirement are receiving life extensions. Facilities previously shut down are being reopened. Momentum continues building behind the restart of Japanese nuclear reactors idled after Fukushima. New reactor construction programs continue expanding globally, including the potential development of 20 new Westinghouse AP1000 reactors in the United States. At the same time, the rapid growth of data-center electricity demand has accelerated interest in small modular reactors, or SMRs, as a scalable long-term power solution. Taken together, these trends point toward a substantial increase in uranium demand extending well into 2040.
The World Nuclear Association, in its widely followed 2025 report, raised its estimates for future nuclear fuel requirements by substantial amounts. Under the organization’s upper-case scenario, uranium demand could reach 530 million pounds by 2040—an extraordinary figure representing roughly a doubling of demand relative to 2025 levels.
Even the WNA's most conservative projections imply a market that is materially tighter than today's. In its low-case scenario, uranium demand still rises to 278 million pounds by 2040, approximately 100 million pounds above estimated 2025 demand. What was once viewed as a short duration cyclical recovery story is increasingly beginning to resemble a long-duration structural demand expansion.
Yet despite the increasingly powerful demand story, we continue to believe the real driver of the uranium market will ultimately be supply disappointment. The market already appears to be slipping into an ever-widening structural deficit, and further supply disappointments will only increase the size of future deficits.
In our view, that deficit may eventually become so severe that only by pushing prices high enough will you be able to coax uranium back into the market from investors themselves, primarily through the liquidation of physical inventories held by large closed-end uranium funds. This dynamic, which we believe will become increasingly important in coming years, is one we intend to explore in much greater detail in future letters.
On the supply side, two particularly important announcements emerged during the quarter. First, NexGen Energy (NXE) announced that it had received the final permits required to begin construction on its massive Rook uranium project, a development we touched upon in our previous letter and will return to again shortly.
Second, Kazatomprom (NATKY) confirmed that 2026 uranium production is expected to range between 71.5 and 75.4 million pounds, up from 67.1 million pounds produced last year. While that would still represent a new production record for the company, the figures nevertheless mark a significant disappointment relative to the 85 million pounds of production Kazatomprom had originally projected back in 2024.
Much of the production shortfall appears centered around the large Budenovskoye project, which has encountered repeated construction and organizational difficulties. Although Kazatomprom continues to insist the project will eventually achieve its targeted annual production rate of 15 million pounds, both the project itself and its long-term production assumptions remain increasingly open to question.
Indeed, while Kazatomprom's amended subsoil-use agreement with the Kazakhstan government technically permits the company to produce as much as 82 million pounds annually, our recent conversations with management strongly suggest those production levels are unlikely ever to be reached. Kazatomprom's tone surrounding future growth has changed noticeably. Confidence now increasingly sounds like caution.
We met with Kazatomprom management at the BMO (BMO) conference at the end of February and pressed them repeatedly regarding the company's future production growth plans. What emerged from those conversations represented a remarkable departure from strategies pursued for much of the past decade. Growth, we were told several times, is no longer the primary objective.
Kazatomprom has now pivoted decisively toward what management described as a "value-over-volume" strategy. Rather than continuing to chase market share through aggressive production increases, the company intends to maximize profitability by directing a greater portion of sales into long-term contracts instead of the spot market, presumably at much higher prices.
Management's reasoning was straightforward enough. With the uranium market increasingly slipping into what they view as a sustained structural deficit, the company sees little reason to accelerate depletion of its resource base merely to increase output. Kazatomprom now appears quite content to allow higher prices to develop over time while simultaneously conserving the quality of its remaining assets.
Over the past twenty years, no company has contributed more to global uranium supply growth than Kazatomprom. In 2005, the company produced only 10 million pounds of uranium, representing roughly 10% of total world supply. By 2025, Kazatomprom's production had risen to 67 million pounds, accounting for well over 40% of global uranium output.
For two decades, Kazatomprom effectively became the single largest engine of uranium supply growth in the world market. What now appears increasingly clear, however, is that this era of rapid and seemingly limitless production expansion has likely come to an end.
When we met with Kazatomprom management in Almaty in April 2024, one conclusion emerged from our discussions more clearly than any other: the company is now confronting two increasingly important geological realities.
First, over the past twenty-five years Kazatomprom has understandably prioritized development of the highest-quality portions of its resource base. The company's remaining undeveloped inventory is now measurably lower in quality than what was previously mined. As a result it becomes more and difficult to replace production, as the productivity of new projects fall short of the productivity of projects developed years before.
These realities go a long way toward explaining Kazatomprom's strategic shift away from aggressive production growth towards resource base conservation. As recently as two years ago, management spoke quite confidently about the company's ability to meet large increases in future global uranium demand. That confidence has now faded noticeably.
The second major supply announcement came from NexGen Energy, which received final federal approval from the Canadian Nuclear Safety Commission to proceed with construction of its flagship Rook I uranium project. The company stated that first production is expected to begin roughly four years after construction commences—which, effectively, is now. If that timeline holds, initial production from Rook would begin in April 2030.
The Rook project is enormous by uranium industry standards, with production expected to reach roughly 25 million pounds annually not long after operations commence. Current projections suggest that the global uranium market could face deficits approaching 75 million pounds by 2030, making Rook's future production critically important to market balances.
In previous letters, we discussed at length how difficult it may ultimately prove to bring a project of this scale online according to schedule. Recently, however, we have begun to suspect that an additional—and potentially very important—dimension may be developing in the Rook story.
We met with NexGen Energy management at this year's BMO conference, and one observation lingered with us afterward. Most uranium producers attempt to place the majority of future production under long-term contracts with utility customers well before bringing a mine into operation. Uranium spot markets are extremely thin, and large incremental sales
into the spot market can have highly disruptive effects on pricing. Given the sheer scale of the Rook project, one might naturally have expected NexGen to aggressively forward-sell substantial portions of future production prior to development.
Yet this has not been NexGen's approach. The company has committed only a small portion of Rook's future production under long-term contracts. The overwhelming majority of the project's expected output remains entirely uncontracted. During our meeting, management stated quite plainly that they believe uranium prices remain far too low and that they would rather accept the risks associated with future spot-market exposure than lock in what they view as inadequate long-term pricing today.
That stance has reportedly unsettled Cameco considerably. Cameco, unlike NexGen, sells almost all of its production under long-term contracts and has historically favored a far more controlled and stable market structure. It may also help explain why Cameco has at times spoken negatively about the Rook project. Indeed, it could even shed light on longstanding market rumors suggesting Cameco may once have considered acquiring NexGen. Such an acquisition would, among other things, remove what could eventually become a highly disruptive new pricing force within the uranium market.
Yet we suspect there may be another layer to this story. Because NexGen Energy has forward contracted so little of Rook's future production, the company remains almost fully exposed to rising uranium prices. Management also appears acutely aware of the rapidly widening gap emerging between uranium supply and demand, as well as the critical importance of Rook's eventual production to balancing that deficit.
We left our meeting with the distinct impression that NexGen understands this dynamic extremely well—and understands equally well that any meaningful delay in Rook's production timetable would likely push uranium prices substantially higher, with NexGen itself standing to benefit enormously from such a move.
Does this create an additional incentive for the company to tolerate delays more comfortably than the market currently assumes? Particularly since large-scale mine and mill construction projects frequently encounter delays even under normal conditions? If the Rook project ultimately slipped beyond its current timetable, materially higher uranium prices would result with NexGen being the biggest beneficiary.
To be clear, we have no evidence whatsoever that NexGen Energy management intends anything other than bringing Rook into production on time and on budget. Even so, we could not entirely shake the suspicion that the single largest beneficiary of any future delay to the project might ultimately be NexGen itself.
Alongside these longer-term structural demand trends—which still have not been fully reflected in spot uranium pricing—shorter-term investment demand is also beginning to exert a much more noticeable influence on the market. Since the Sprott Physical Uranium Trust (SRUUF) resolved its balance-sheet issues last June, the fund has embarked on an extraordinarily aggressive uranium buying campaign.
Since June, SPUT accumulated roughly 10 million pounds of uranium. By comparison, between January 2024 and June 2025, the trust had accumulated only 3 million pounds. By year-end 2025, SPUT's holdings had reached 74.3 million pounds, and aggressive physical buying has continued into the first quarter. During the quarter alone, SPUT acquired an additional 5.8 million pounds, pushing total holdings above 80 million pounds.
But SPUT was hardly the only uranium investment buyer during the quarter. On March 16, Yellow Cake plc (YLLXF)—the other major closed-end vehicle focused on holding physical uranium—successfully completed a $110 million equity raise. Following the offering, Yellow Cake notified Kazatomprom that it intended to exercise its option to purchase 1.3 million pounds of uranium.
In addition, the company disclosed that it had purchased another 100,000 pounds directly in the spot market. Following these acquisitions, Yellow Cake’s total uranium holdings now stand at approximately 24.4 million pounds. What was once viewed as a niche investment strategy is increasingly beginning to exert measurable influence on the physical uranium market itself.
Back in our 3Q2018 letter, in an essay entitled “ Uranium: New Sources of Demand Tighten the Market , ” we highlighted what was then a largely underappreciated development: the emergence of investment demand as a potentially major bullish force in uranium markets. At the time, we wrote: “. . . another source of unexpected physical demand has entered the market—one that we believe could become substantial as this bull market unfolds. We are referring to the emergence of investor demand for physical uranium. ”
Since those words were written, uranium prices have risen nearly fourfold. More importantly, both Sprott Physical Uranium Trust and Yellow Cake plc have evolved into significant sources of physical demand within the uranium market itself. Over the past eight years, the two funds together have accumulated nearly 80 million pounds of uranium—an amount substantial enough to materially influence market balances in an already tightening industry.
Because western investors tend, almost by instinct, to behave as trend followers, we suspect investment demand for physical uranium will increase materially as the uranium bull market enters what we believe will be its second major leg over the next several years. In our view, these two closed-end funds may ultimately move from being important market participants to becoming central actors in the supply crisis that could grip uranium markets during the next five years.
At the same time, utilities have quietly allowed a dangerous imbalance to develop. For the past thirteen years, long-term reactor fuel requirements have exceeded utilities’ long-term contracting volumes by more than 50 million pounds annually. In the years following Fukushima, utilities gradually came to believe that uranium supplies would remain abundant indefinitely. As a result, the industry adopted a remarkably relaxed attitude toward the structural deficits quietly developing beneath the market’s surface—and, for the most part, that complacency remains firmly in place today.
Over the past two years, utilities have once again materially underpurchased relative to their long-term fuel requirements. Reactor demand currently requires roughly 175 million pounds of uranium annually. Yet according to UxC LLC data, utilities purchased only approximately 115 million pounds in both 2024 and 2025, leaving procurement levels dramatically below underlying consumption needs. The gap between what utilities require and what they are actually securing continues to widen in a way that increasingly resembles the early stages of a classic commodity shortage.
At some point, it is entirely conceivable that utilities themselves panic and rush back into the uranium market in response to tightening inventories and sharply rising prices. Commodity markets have seen this behavior many times before, and uranium markets are hardly immune to it.
Indeed, something very similar occurred during the last major uranium bull market, which culminated in the summer of 2007 with spot prices rising above $150 per pound. At that time, utilities reacted to tightening supply conditions by aggressively over-contracting fuel needs. Long-term contracting volumes exceeded actual reactor demand by nearly 100 million pounds annually—the exact opposite of the profoundly under contracted market structure that exists today.
The next phase of the bull market is likely to be driven not merely by rising demand, but by utilities and financial investors competing directly against one another for an increasingly scarce physical supply of uranium, especially when supply begins to disappoint. Commodity markets become particularly volatile when strategic buyers suddenly discover they are bidding against investors rather than producers. We suspect uranium markets may be approaching precisely such a moment.
Accordingly, we remain bullish on uranium prices and believe the second major leg of the uranium bull market may already have begun. Uranium-related investments remain well aligned with a market structure characterized by tightening supply and sustained long-term demand growth.
Price action in the platinum group metals closely resembled the volatile trading patterns seen earlier in both gold and silver markets. PGM prices surged roughly 30% during the opening weeks of the quarter, reached a peak near the end of January, and then steadily surrendered virtually all of those gains. By quarter-end, platinum prices had fallen 6%, while palladium declined 10%. Only rhodium managed to retain any meaningful strength, finishing the quarter higher by approximately 10%.
The major platinum producers traced a nearly identical path. Mining equities rallied sharply during the first half of the quarter, only to give back those advances almost entirely during the second half. Once again, the sector demonstrated its familiar tendency to move with amplified emotion relative to the underlying metals themselves.
Platinum group metal prices and related equities have remained under pressure recently, due in large part to the unwinding of excessively speculative long positioning in gold and silver markets. Yet beneath that weakness, we believe an important buying opportunity may now be beginning to emerge.
Platinum prices continue to trade at extraordinarily depressed levels relative to their own history, and we remain convinced that the enormous valuation gap separating platinum from gold today will eventually close as the PGM bull market progresses. Between 1980 and 2010, platinum traded below the price of gold only briefly and on relatively few occasions. Over that thirty-year span, platinum prices averaged roughly a $150-per-ounce premium to gold—a relationship that for decades was treated by commodity markets as entirely normal.
How dramatically the precious metals world has changed since then. After 2010, platinum's longstanding premium to gold gradually reversed itself, transforming first into a discount and then into a discount of astonishing size. By the first quarter of 2025, platinum traded more than $2,000 per ounce below gold. Even today, as we write, platinum still trades at an extraordinary discount of roughly $1,700 per ounce to gold.
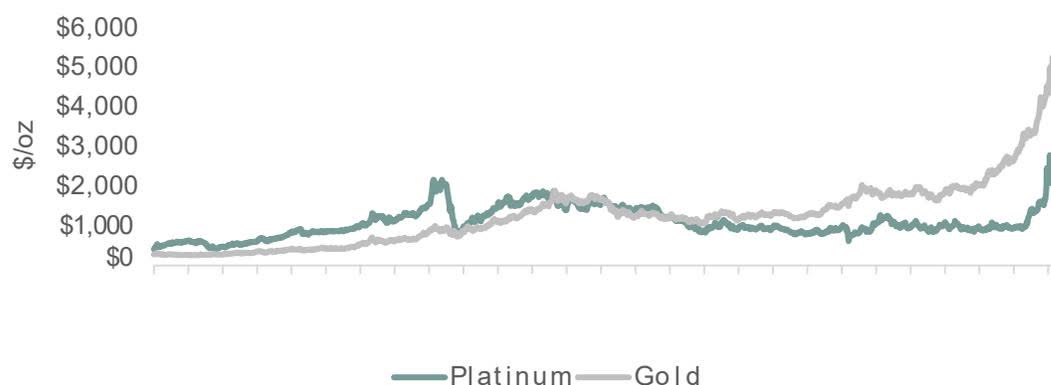
What for decades would have been regarded as an almost inconceivable pricing relationship has now become so familiar that markets scarcely seem to notice.
Platinum's enormous discount to gold is, in many respects, the financial expression of the deeply bearish narrative that has dominated PGM markets for the better part of the last fifteen years—the very same narrative that has weighed so heavily on global oil markets. According to this widely accepted view, by 2035 the world will largely have abandoned the internal combustion engine in favor of electric vehicles, leaving both oil and platinum consigned to the economic equivalent of the historical scrap heap.
It is hardly coincidental, therefore, that both oil and platinum prices peaked at almost precisely the same moment—during the first half of 2008—and that both have struggled through long and frustrating bear markets ever since. Markets, after all, have spent the last decade and a half attempting to price not simply weaker demand, but the presumed eventual obsolescence of the industries themselves.
As our readers know, we have long disagreed with the prevailing assumption that electric vehicles will ultimately dominate the global passenger car market. Increasingly, that narrative appears to be fraying in real time. The disappointing EV sales trends that have emerged over the past twelve months, combined with the enormous write-offs now being taken by automakers on prior EV investments, provide what we view as a very important Bayesian confirmation of our broader thesis.
Absent massive government subsidies—or outright regulatory mandates effectively outlawing alternatives—we do not believe EVs will achieve anything close to the market penetration rates transportation analysts have projected over the past several years. In our view, consumers are ultimately reluctant to adopt a technology they perceive as possessing inferior real-world energy efficiency and utility relative to the internal combustion engine.
Consumers will, however, embrace technologies that offer clear improvements in efficiency without requiring meaningful sacrifices in convenience or functionality. This is precisely why hybrid vehicles appear to be gaining momentum globally. That shift in consumer preference carries highly bullish implications for platinum group metal demand, particularly within autocatalyst markets—a theme we have discussed extensively in previous letters. According to data from the World Platinum Investment Council, the platinum market is expected to remain in deficit during 2026. In its fourth-quarter 2025 report, the WPIC projected a deficit of roughly 240,000 ounces—a sharp reduction from the estimated 1,080,000-ounce deficit recorded in 2025. Even so, 2026 would still mark the fourth consecutive year in which platinum demand exceeds available supply.
It is also worth noting that, in recent years, the WPIC has consistently underestimated the size of platinum market deficits. That pattern has become important enough that we believe current projections should be viewed with a certain degree of caution.
Looking back to 2023, the World Platinum Investment Council projected platinum market deficits of 530,000 ounces for 2024 and 620,000 ounces for 2025. In reality, both deficits proved substantially larger than expected. The 2024 deficit ultimately reached 921,000 ounces, while the 2025 deficit expanded further to approximately 1,082,000 ounces.
The forecasting errors were revealing. In 2024, recycled supply from the automotive sector was materially overestimated. In 2025, investment demand proved much stronger than anticipated. Together, those two factors caused the platinum market deficit to be understated by very significant margins.
The WPIC’s original projection for the 2026 platinum market deficit, published back in 2024, called for a shortfall of approximately 770,000 ounces. Since then, however, the organization has revised that estimate sharply downward to only 240,000 ounces. The reduction rests largely on assumptions of a substantial increase in recycled platinum supply, weaker automotive demand, and a pronounced pullback in investment demand.
As in prior years, we suspect these deficit estimates may again prove too conservative. Used car prices remain elevated and continue trending higher, a dynamic that has materially reduced the amount of recycled platinum returning to the market. As consumers postpone scrapping older vehicles, less catalytic material becomes available for recovery—a pattern that has now persisted for roughly five years. Our suspicion is that recycled supply will once again disappoint relative to expectations during 2026.
The World Platinum Investment Council is currently projecting that platinum demand during 2026 versus 2025 will decline by roughly 500,000 ounces, an assumption we intend to monitor very carefully as the year progresses. The two physical platinum ETFs we follow have indeed experienced investor liquidations over the past three months. Even so, shares outstanding in both funds remain materially above levels seen on average throughout 2025.
If these ETFs are reasonably representative of broader investment demand, the data suggest that platinum investment demand has softened recently, but still remains above average 2025 levels. Will investment demand truly collapse by 50%, as implied by current WPIC projections? At present, market trends do not appear to support that conclusion, though it is a situation we will continue watching closely.
Over the past three years, platinum market deficits have consistently been underestimated, and we believe that pattern is likely to continue throughout much of the coming decade. Historically, the forecasting errors have stemmed primarily from two areas: overestimation of recycled platinum supply returning to the market and underestimation of end demand. Looking ahead, however, we suspect the largest forecasting mistake may increasingly come from underestimating automotive demand itself.
The assumption of stagnant or declining automotive platinum demand rests heavily on forecasts calling for continued rapid growth in EV penetration rates—forecasts we remain convinced will not be achieved. Our view has been reinforced in part by the increasingly thoughtful work of Rob West of Thunder Said Energy. Over the past two years, in response to the disappointing reception EVs have received from many consumers, Mr. West has materially reduced his own projections for future EV penetration.
Back in 2024, he projected EV penetration rates could reach roughly 60% during the 2030–2032 period, a scenario that would have still implied long-term growth in PGM demand. Since then, however, he has significantly lowered those EV penetration estimates to approximately 45%. That reduction, if correct, would imply substantially stronger long-term auto-catalyst demand for platinum group metals—far more than most market participants currently expect.
The bearish narrative that has dominated platinum group metal markets for the past fifteen years has rested almost entirely on the assumption of relentlessly rising EV sales, offset by declines in the use of internal combustion engines. Now that EV adoption trends have begun falling materially short of expectations, we believe the outlook for auto-catalyst demand is beginning to change in material ways.
Auto-catalyst demand still accounts for nearly 65% of total PGM consumption, and in our view this key source of PGM demand is likely to resume meaningful long-term growth. At the same time, mine supply continues facing persistent structural challenges. The combination of stronger-than-expected automotive demand and constrained supply leads us to believe that future deficits in both platinum and palladium markets will once again prove materially larger than current consensus expectations—a pattern that has already repeated itself consistently over the past three years.
Ultimately, we suspect only materially higher prices will be capable of bringing these markets back into balance as the decade progresses.
We remain firmly bullish on platinum group metals and continue to believe the PGM bull market is still in its early stages. The recent pullback in gold prices over the past three months has heavily weighed on platinum and palladium prices too, but in our view that weakness is creating another attractive PGM buying opportunity.
Historically, platinum traded at a premium to gold for long stretches of time. Today, that traditional relationship has inverted into an extraordinary discount. We believe this reflects a deeply pessimistic narrative that has dominated PGM markets for more than a decade—a narrative that now appears increasingly vulnerable to reversal.
The exceptionally optimistic EV penetration assumptions underpinning that bearish thesis, in our view, will simply not be realized. As this PGM bull market unfolds over the coming years, we believe platinum prices will eventually return to trading at substantial premiums to gold once again.
Among the base metals, aluminum was by far the commodity most directly affected by the closure of the Strait of Hormuz. Roughly 10% of global primary aluminum supply is produced in the Gulf states and passes through the Strait. Once that flow was disrupted, aluminum prices responded quickly. During the quarter, aluminum became the strongest-performing major base metal, rising more than 15%.
Outside aluminum, however, price movements across the broader base metals complex were comparatively subdued. Nickel prices advanced roughly 3%, zinc rose 4%, and copper managed a gain of only slightly more than 1%.
Base metal equities displayed considerably greater strength than the underlying metals themselves. The XBM CN ETF, which tracks the S&P Global Base Metals Index, rose nearly 11% during the quarter, while the COPX copper equity ETF (COPX) advanced more than 6%. Investors, it seems, remain far more enthusiastic about the long-term narrative surrounding base metals than the spot markets themselves currently justify.
Copper, in particular, continues to occupy a special place in investors' imaginations. And yet the underlying fundamentals continue sending deeply conflicting signals.
On the bullish side, considerable attention has focused on the possibility of a looming sulfuric acid shortage tied directly to the closure of the Strait of Hormuz. Nearly 50% of global sulfur supply—an essential input in sulfuric acid production—normally transits through the Strait, and sulfuric acid prices have surged almost 50% since the disruption began.
This matters greatly for copper markets because approximately 20% of global copper supply is derived from oxide deposits that rely on being leached with sulfuric acid. As sulfuric acid prices have risen sharply, concerns have emerged among copper traders that shortages could materially impair this important source of copper production.
Concerns surrounding SX-EW copper production, combined with recurring rumors that Chinese copper demand may finally be rebounding after several years of disappointment, have helped propel copper prices to new all-time highs. As we write, copper has just reached $6.50 per pound—a record high price for the metal.
Offsetting the potentially bullish implications of sulfuric acid shortages, are underlying copper data that continues to lean increasingly bearish on both the supply and demand sides.
World Bureau of Metal Statistics data, now updated through February, continues to indicate that copper markets remains in surplus, a condition that appears to have persisted since 2023. Supporting this conclusion, readily mobilized copper inventories held in exchange warehouses continue building at a remarkable pace. During the first quarter alone, warehouse inventories surged by more than 500,000 tonnes, an increase approaching 70%.
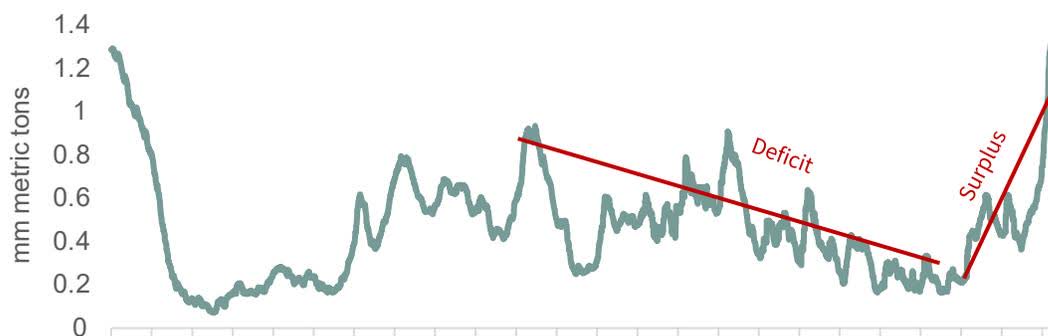
To find exchange inventory levels remotely comparable to today's, one must go all the way back to 2003—a time when copper prices averaged 75 cent per lbs.
The copper market has slipped into surplus because of unexpected demand slowdowns and supply accelerations. Regarding demand, the largest disappointment continues to come from China. As we have discussed extensively in prior letters, China has transitioned from being an under-consumer of copper relative to its level of per-capita economic development into what now increasingly appears to be an over-consumer.
Given that shift, it should not be surprising that Chinese copper demand growth has decelerated sharply in the past four years, and 2025 now appears likely to mark yet another year of disappointingly weak growth. China's 2025 copper demand has increased by only approximately 90,000 tonnes—growth of barely more than 0.4%.
Since 2022, Chinese copper consumption has increased by only 700,000 tonnes, or by roughly 175,000 tonnes annually. To appreciate how dramatic this slowdown has been, recall that between 2010 and 2020 China's copper consumption expanded, on average, by 700,000 tonnes every year. Also, remember China accounted for nearly all global copper demand growth during that period. Given the big slowdown in Chinese copper consumption, it should hardly come as a surprise that global copper consumption over the past year has also shown essentially no growth.
Indeed, the sluggishness in Chinese demand appears to be continuing as the new year begins. According to World Bureau of Metal Statistics data—currently available only through February—Chinese copper consumption has declined roughly 5% year-over-year. In prior letters, we discussed extensively the implications of China transitioning from an under-consumer of copper into an over-consumer. The effects of that transition now appear increasingly visible in global copper balances.
Our models had predicted the slowdown in consumption now taking place, and those same models continue to suggest that a return to strong Chinese copper demand growth remains unlikely for the foreseeable future. Put simply, the scale of copper-intensive investment already embedded within the Chinese economy now appears more than sufficient to support substantially higher levels of per-capita GDP. This represents a complete reversal from the conditions that prevailed during the previous twenty-five years, when China remained structurally underinvested in copper-intensive infrastructure and industrial capacity.
Given the deep structural problems still embedded within China's residential real estate sector—problems likely to require years rather than quarters to resolve—combined with slower overall economic growth, we believe it may be many years before China again generates meaningful incremental copper demand growth.
In an upcoming letter, we intend to revisit and update our China copper consumption models in detail and discuss the implications for future market balances. At present, however, those implications continue to lean decidedly negative for copper fundamentals.
Supply has become equally problematic for the bullish copper thesis. Consensus opinion entering this decade held that copper mine supply growth would prove deeply disappointing as depletion pressures intensified and new mine development struggled to keep pace. Yet the long-anticipated “no-growth” mine supply scenario has simply failed to materialize.
Even after the closure of the Cobre Panamá (FQVLF) mine and the severe disruptions experienced last year at Freeport-McMoRan (FCX)'s Grasberg operation, global mine supply has continued advancing steadily. Since 2022, copper mine production has increased by approximately 2.1 million tonnes, or nearly 700,000 tonnes annually. Over the same period, demand growth totaled only about 1.0 million tonnes, or roughly 330,000 tonnes per year. Supply growth, in other words, has exceeded demand growth by more than two-to-one.
Nor does supply growth appear to be slowing in the near term. Even with major operational problems at both Grasberg and Ivanhoe Mines (IVPAF)'s Kakula mine in, 2025 global mine supply still managed to grow by another impressive 500,000 tonnes. Once again, the overwhelming amount of that incremental production originated from the Democratic Republic of the Congo.
One of the more fascinating aspects of this unexpected 2.1 million tonne increase in copper mine supply is the source of the growth itself. Roughly 1 million tonnes of additional supply has come from the Democratic Republic of the Congo, while another 300,000 tonnes has come from Peru and approximately 200,000 tonnes from Serbia. In each case, much of the expansion has been driven by mining projects controlled by Chinese companies.
Add to this another 300,000 tonnes of increased domestic Chinese mine production, and one arrives at a striking conclusion: nearly all recent global copper supply growth appears to have originated from mines controlled by Chinese interests.
In future letters, we intend to examine these developments much more closely. Increasingly, we wonder whether the Chinese economic phenomenon known as “involution” may now be extending into the global copper industry itself. Involution, broadly speaking, describes a self-defeating cycle—often encouraged by government support—in which companies continue expanding production aggressively while paying little attention to underlying profitability.
Is this dynamic now operating within global copper mining? And could it explain why mine supply growth has accelerated so unexpectedly during the past four years? We believe these questions deserve considerably more attention than they are currently receiving and intend to explore them in greater detail in future work.
Twenty years ago, the underlying fundamentals in the copper market turned decisively bullish, yet the investment community largely refused to believe the story. Investors spent much of the 2000 decade fighting the copper bull market even as prices advanced more than fivefold.
A similar pattern emerged again in 2016. Copper prices had collapsed, sentiment toward the sector was deeply pessimistic, and yet another highly constructive setup had quietly developed beneath the surface. Once again, however, investors largely dismissed the bullish fundamentals. Since those lows, copper prices have more than tripled.
Today, the situation has reversed completely. Everyone, it seems, has become a copper bull. What was once viewed as a relatively ordinary industrial commodity has now been elevated into a kind of indispensable strategic asset class. Investors routinely describe copper as the “greenest” of metals, citing forecasts of enormous future demand growth alongside assumptions of chronically disappointing supply.
The contrast with the early 2000s could hardly be more striking. Back then, few investors believed the bullish copper story even as positive fundamental data accumulated steadily beneath the surface. Rising prices did not attract enthusiasm so much as disbelief. Indeed, each advance in copper prices merely strengthened hedge funds’ determination to short the metal.
Today, however, the psychology surrounding copper has become almost the exact inverse of what it was twenty years ago. Supply has repeatedly surprised to the upside. Demand assumptions have steadily proven too optimistic. Global inventories continue building unexpectedly. And yet investor enthusiasm remains remarkably strong even as the underlying fundamentals continue deteriorating.
We continue to believe the copper market has now shifted into a structural surplus—one that could persist for many years. In our view, Chinese copper demand will likely continue disappointing relative to prevailing expectations, while supply growth, much of it driven by Chinese-controlled mining expansion, will continue proving materially stronger than the market anticipates.
Copper-related equities appear increasingly constrained by surplus conditions and weakening underlying fundamentals.
Managing Partners: LEIGH R. GOEHRING ADAM A. ROZENCWAJG Registration with the SEC should not be construed as an endorsement or an indicator of investment skill, acumen or experience. Investments in securities are not insured, protected or guaranteed and may result in loss of income and/or principal. Historical performance is not indicative of any specific investment or future results. Investment process, strategies, philosophies, portfolio composition and allocations, security selection criteria and other parameters are current as of the date indicated and are subject to change without prior notice. This communication is distributed for informational purposes, and it is not to be construed as an offer, solicitation, recommendation, or endorsement of any particular security, products, or services. Nothing in this communication is intended to be or should be construed as individualized investment advice. All content is of a general nature and solely for educational, informational and illustrative purposes. This communication may include opinions and forward-looking statements. All statements other than statements of historical fact are opinions and/or forward-looking statements ((including words such as “believe, ” “estimate, ” “anticipate, ” “may, ” “will, ” “should, ” and “expect”)). Although we believe that the beliefs and expectations reflected in such forward-looking statements are reasonable, we can give no assurance that such beliefs and expectations will prove to be correct. Various factors could cause actual results or performance to differ materially from those discussed in such forward-looking statements. All expressions of opinion are subject to change. You are cautioned not to place undue reliance on these forward-looking statements. Any dated information is published as of its date only. Dated and forward-looking statements speak only as of the date on which they are made. We undertake no obligation to update publicly or revise any dated or forward-looking statements. Any references to outside data, opinions or content are listed for informational purposes only and have not been independently verified for accuracy by the Adviser. Third-party views, opinions or forecasts do not necessarily reflect those of the Adviser or its employees. Unless stated otherwise, any mention of specific securities or investments is for illustrative purposes only. Adviser’s clients may or may not hold the securities discussed in their portfolios. Adviser makes no representations that any of the securities discussed have been or will be profitable. Past performance is not a guarantee of future results.


Editor's Note: The summary bullets for this article were chosen by Seeking Alpha editors.
Editor's Note: This article discusses one or more securities that do not trade on a major U.S. exchange. Please be aware of the risks associated with these stocks.
此内容由惯性聚合(RSS阅读器)自动聚合整理,仅供阅读参考。 原文来自 — 版权归原作者所有。