



Summary: We find that roughly half of test-passing SWE-bench Verified PRs written by mid-2024 to mid/late-2025 agents would not be merged into main by repo maintainers, even after adjusting for noise in maintainer merge decisions. Since the agents are not given a chance to iterate on their solution in response to feedback the way a human developer would, we do not claim that this represents a fundamental capability limitation. Rather, our results indicate that a naive interpretation of benchmark scores may lead one to overestimate how useful agents are without more elicitation or human feedback.
It is often unclear how to translate benchmark scores into real-world usefulness. For example, if a model’s SWE-bench Verified score is 60%, does that mean it can resolve 60% of real-world open-source issues? One reason to doubt this is that benchmarks are clean and verifiable in ways the real world is not. To study this quantitatively, we take SWE-bench Verified and zoom in on one such difference — it uses an automated grader rather than the real-world standard of maintainer review.
To study how agent success on benchmark tasks relates to real-world usefulness, we had 4 active maintainers from 3 SWE-bench Verified repositories review 296 AI-generated pull requests (PRs). We had maintainers (hypothetically) accept or request changes for patches as well as provide the core reason they were requesting changes: core functionality failure, patch breaks other code or code quality issues.
To deal with noise in maintainer decisions, we also record maintainer merge decisions on 47 original human-written PRs that were actually merged into main (hereafter “golden patches”). We report all our scores as % of golden baseline, e.g., as the golden baseline is 68%, if a model gets 34%, then the golden-baseline-adjusted score is 50%.1
Figure 1 shows our main result that on average maintainer merge decisions are about 24 percentage points lower than SWE-bench scores supplied by the automated grader. Moreover, the rate of improvement, as measured by percentage points gained per year (pp/yr), is 9.6 pp/yr slower for maintainer merge decisions. However, we believe our results on the rate of improvement are shakier and only provide suggestive evidence that it is slower for maintainer merge decisions.
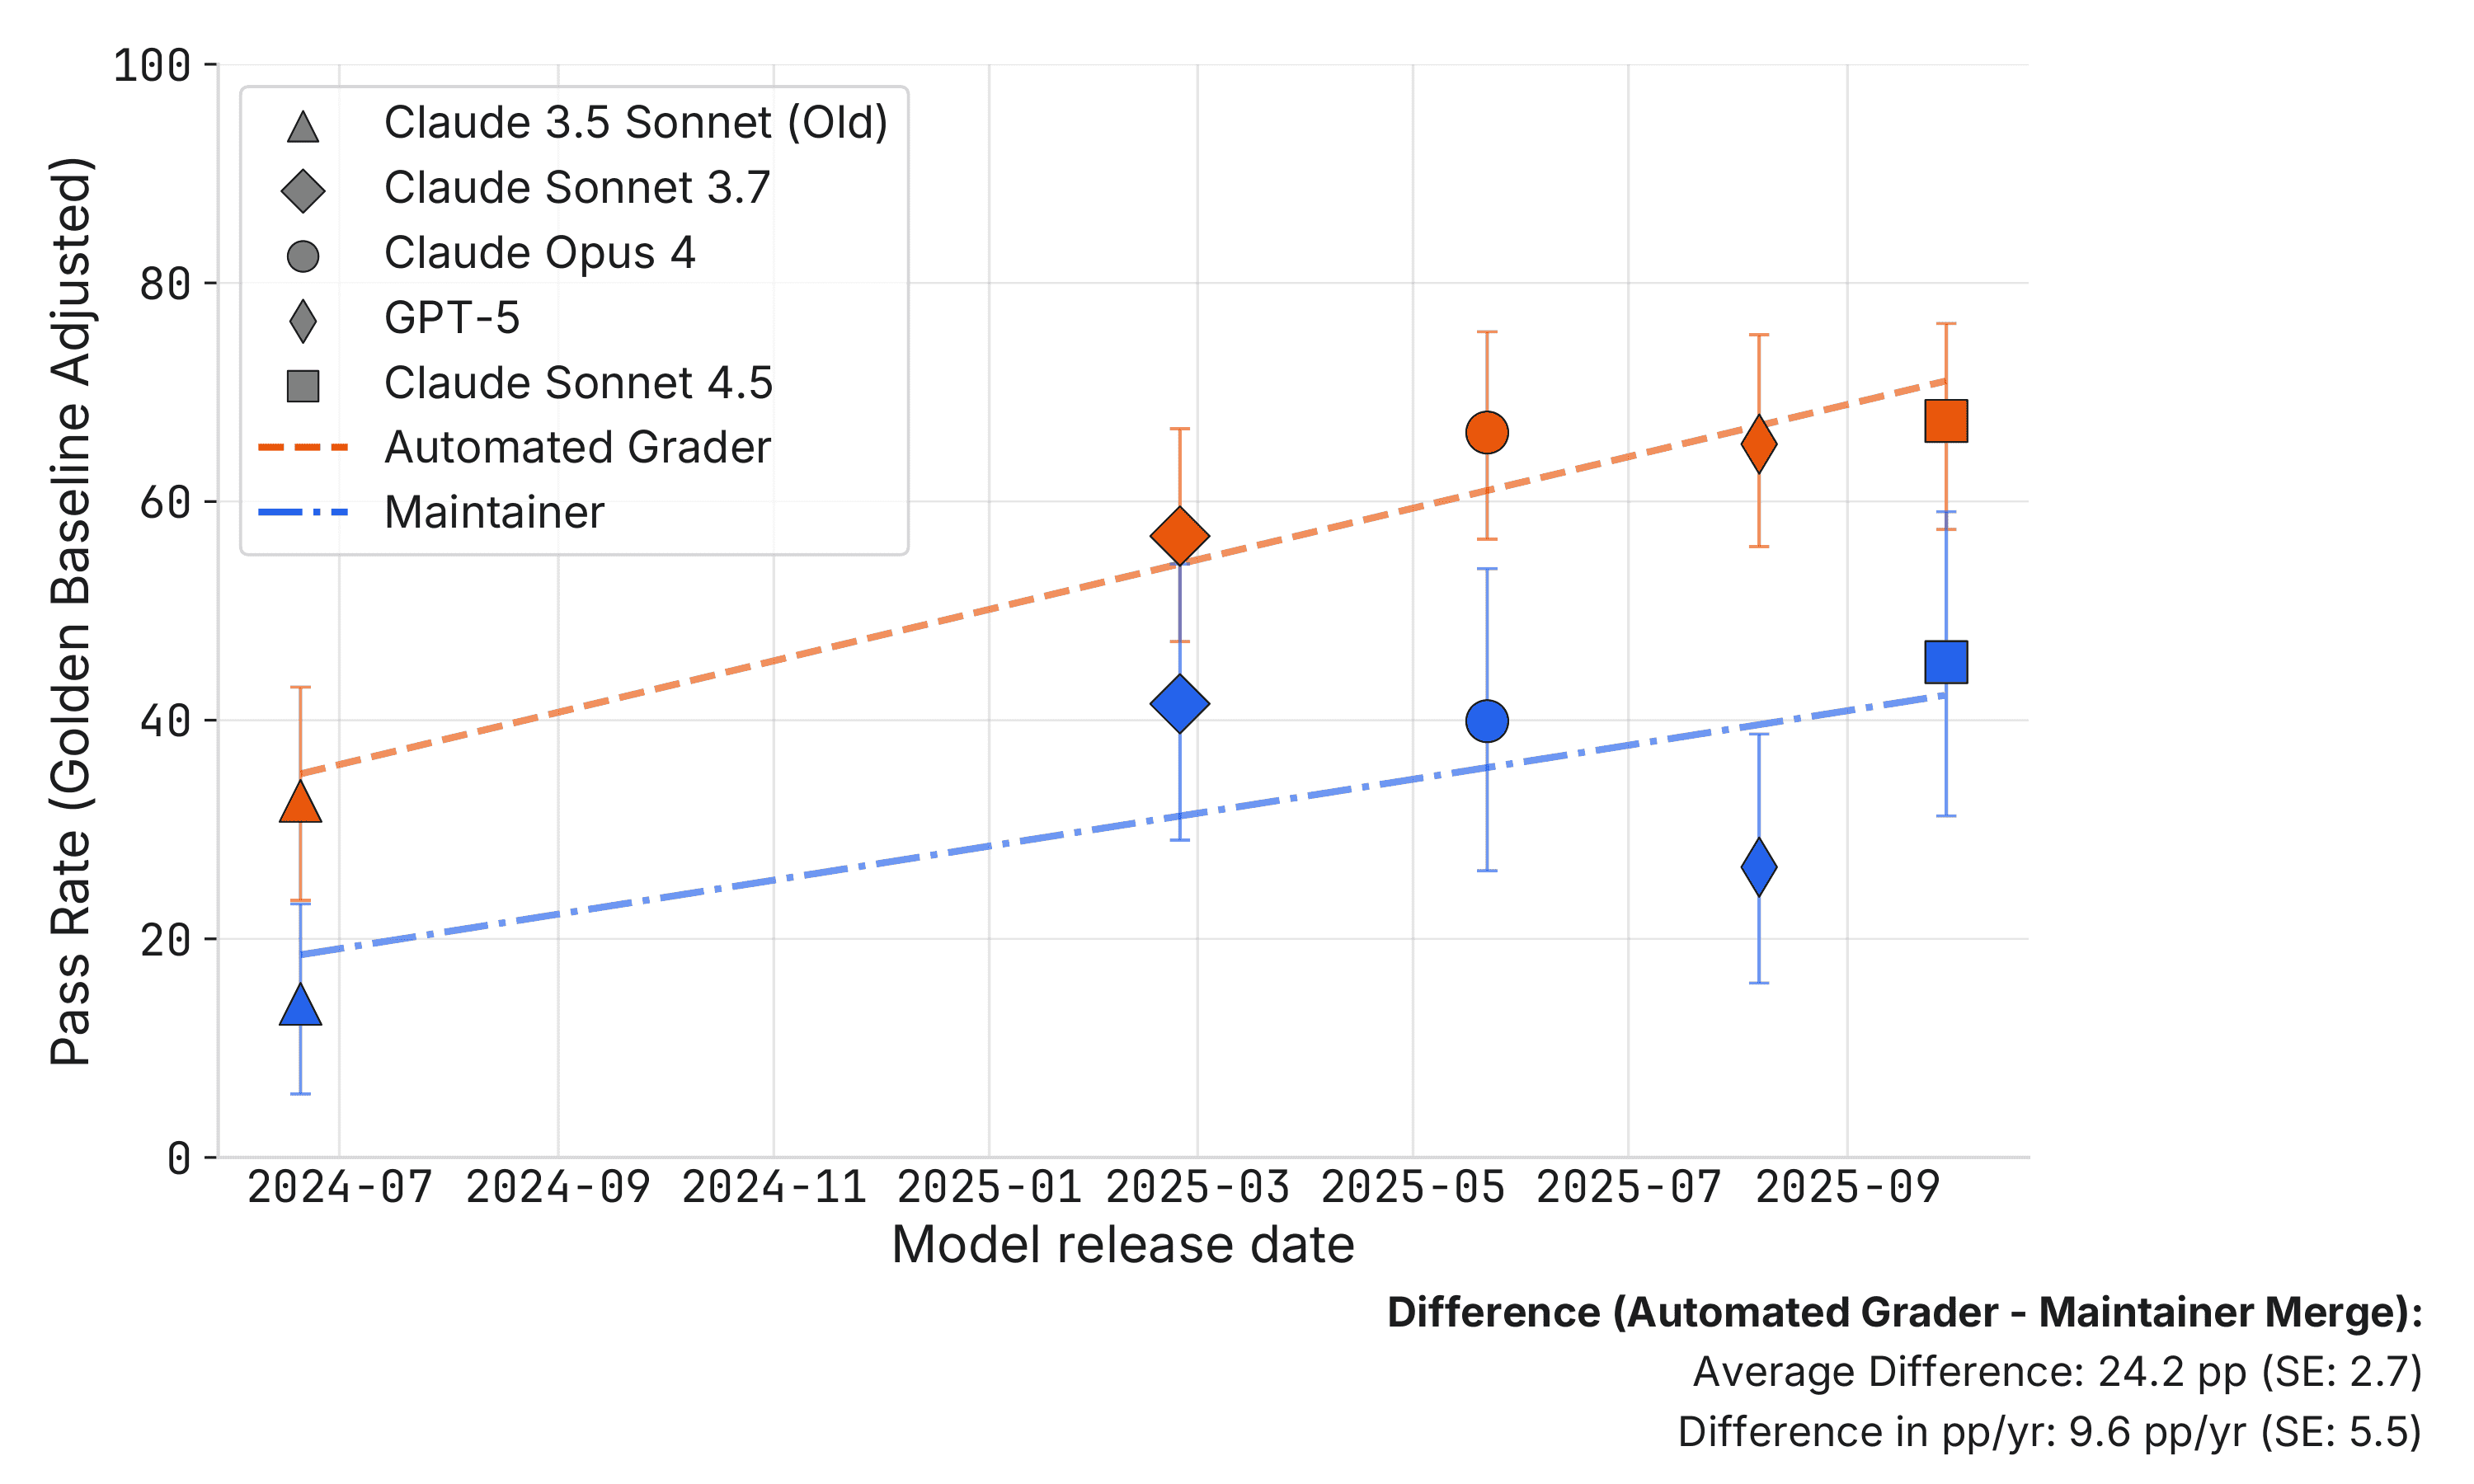
Figure 1: Pass rates normalized as a percentage of the golden baseline, where 100% represents golden patch performance. SWE-bench Automated Grader (orange) records the percentage of patches that pass the automated grader, divided by the golden baseline (100%) and then converted back into a percent. Maintainer Merge (blue) records percent of patches that are merged by maintainers, divided by the golden baseline (68%) and then converted back into a percent. Error bars indicate 95% confidence intervals.
Our central claim is about comparing a naive interpretation of benchmark scores with a richer view of agent usefulness. It is important to note what we are not doing:
In a previous blog post, we compared a small number of PRs that passed algorithmic tests vs. our own code review. This investigation makes 5 advances over that post:
While we believe these advances make our current results more reliable, they are not strictly comparable to the results in our previous post. In particular, the previous post considered much more difficult PRs. In our sample of SWE-Bench Verified golden patches, the average lines of code changed is about 17 while for our previous post this was over 500.
Our basic methodology is to take PRs that are scored as correct by the SWE-bench automated grader, and have current maintainers review whether the patches would be merged into main.
We recruited 4 active maintainers covering 3 SWE-bench Verified repos: 2 from scikit-learn, 1 from Sphinx, and 1 from pytest. Therefore, we have coverage for 3/12 (25%) of the repos in SWE-bench Verified, covering 95/500 (19%) of the issues. Maintainers were recruited via cold email. In the appendix, we show that our sample is representative of SWE-bench Verified when measured by pass rates. Maintainers are paid hourly with a bonus if peers label their reviews as high quality.
We use the SWE-bench Verified agent runs from Epoch’s benchmarking hub (Epoch AI, 2025).2 We pull patches from the following:
We focus primarily on Anthropic models because they have been state-of-the-art on SWE-bench Verified for most of its history.
We use patches in their original state, except we manually remove miscellaneous debugging files to avoid penalizing agents for artifacts they were not instructed to remove prior to submission.3 We upload the patches to a private copy of the repo in its historical state on GitHub.
For our main analysis, we only submit PRs for review if they pass the SWE-bench automated grader. We impute maintainer review as failure if the PR fails the automated grader. This amounts to assuming SWE-bench Verified has no false negatives (cases where the automated grader says fail, but the maintainer would actually merge it). We think this is a fairly reasonable assumption because:
The appendix has results without this assumption and results that try to relax it.
For AI-generated patches, maintainers review all of the patches that pass the SWE-bench automated grader.5 For the golden patches, we have maintainers review only half of them (randomly selected) to save time. In the case of scikit-learn, where we have more than one maintainer, we randomly split which patches are reviewed by which maintainer.
Maintainer review is done in GitHub, to match real code review as closely as possible. The review is done in waves. Each wave contains non-overlapping issues attempted by different models. The maintainers are not told the source of the pull request.6
We ask maintainers to review these PRs exactly as they do PRs in real life, with two exceptions:
We ask the maintainers to give an accept/request changes decision, structured feedback, and natural language feedback. The structured feedback covers:
Finally, maintainer reviews may be noisy, as they involve subjective decisions on code quality, etc. Therefore, we benchmark agent pass rates vs. the level of noise in the golden patches. Recall that SWE-bench Verified is made from real-world PRs that were merged. We take these real-world PRs and re-submit them to our maintainers to establish a baseline for noise in our maintainer merge pipeline.7 We found that about 68% of golden patches are indeed merged by our maintainers, and the average progress towards a mergeable PR among all golden patches is about 90%. Moreover, around 85% of golden patches are rated as making 80% or more progress towards a mergeable PR. The percentage merged is low, but the percentage rated as making 80% or more progress toward a mergeable PR is high, indicating that there is a degree of maintainer subjectivity playing a role in the last mile of PR acceptance. We report all our scores as % of golden baseline accordingly, e.g., if the golden baseline is 68% and a model gets 34%, then the golden-baseline-adjusted score is 50%.
All confidence intervals are 95% and computed via nonparametric bootstrap at the patch level. For trend lines, we fit an unweighted linear regression of pass rates against model release dates. Trend confidence intervals reflect only uncertainty in pass rates, conditioning on which models are in the sample. We do not account for the uncertainty in the golden baseline.
Figure 1 plots the pass rate for our language models according to the SWE-bench automated grader and according to maintainers. There are two immediate conclusions from this graph.
First, the maintainer merge rate is well below the SWE-bench pass rate. In the bottom right, the top row shows the automated grader is on average about 24.2 percentage points (standard error: 2.7) higher than the maintainer merge decision. This is strong and statistically significant evidence that the naive interpretation of the benchmark as passing maintainer review is misleading.
Second, at the bottom of Figure 1, we show the difference in percentage points gained per year (pp/yr). Notice that the maintainer merge decision is gaining about 9.6 pp/yr (standard error: 5.5) less than the automated grader. This is a weaker effect than the level difference; it is only statistically significant at a 10% significance level rather than 5%. Moreover, the pp/yr result is less robust than the level result, e.g., the result changes if trend lines are filtered to SOTA models only, so we take this as only weak evidence that the rate of improvement is slower for maintainer merge decisions.
Next, as a robustness check, Figure 2 changes the pass criteria from maintainers merging the PR to maintainers saying the PR makes sufficient progress towards a mergeable PR. Concretely, we define a 0–1 pass as maintainers rating that the PR is more than 80% of the way towards a mergeable PR, continuing to impute no pass if the automated grader fails the patch. Note that 80% progress cutoff is the 15th percentile of the golden patches, so this is a fairly low bar. We find very similar results: scores are roughly half and the trend is about 10 pp/yr slower.
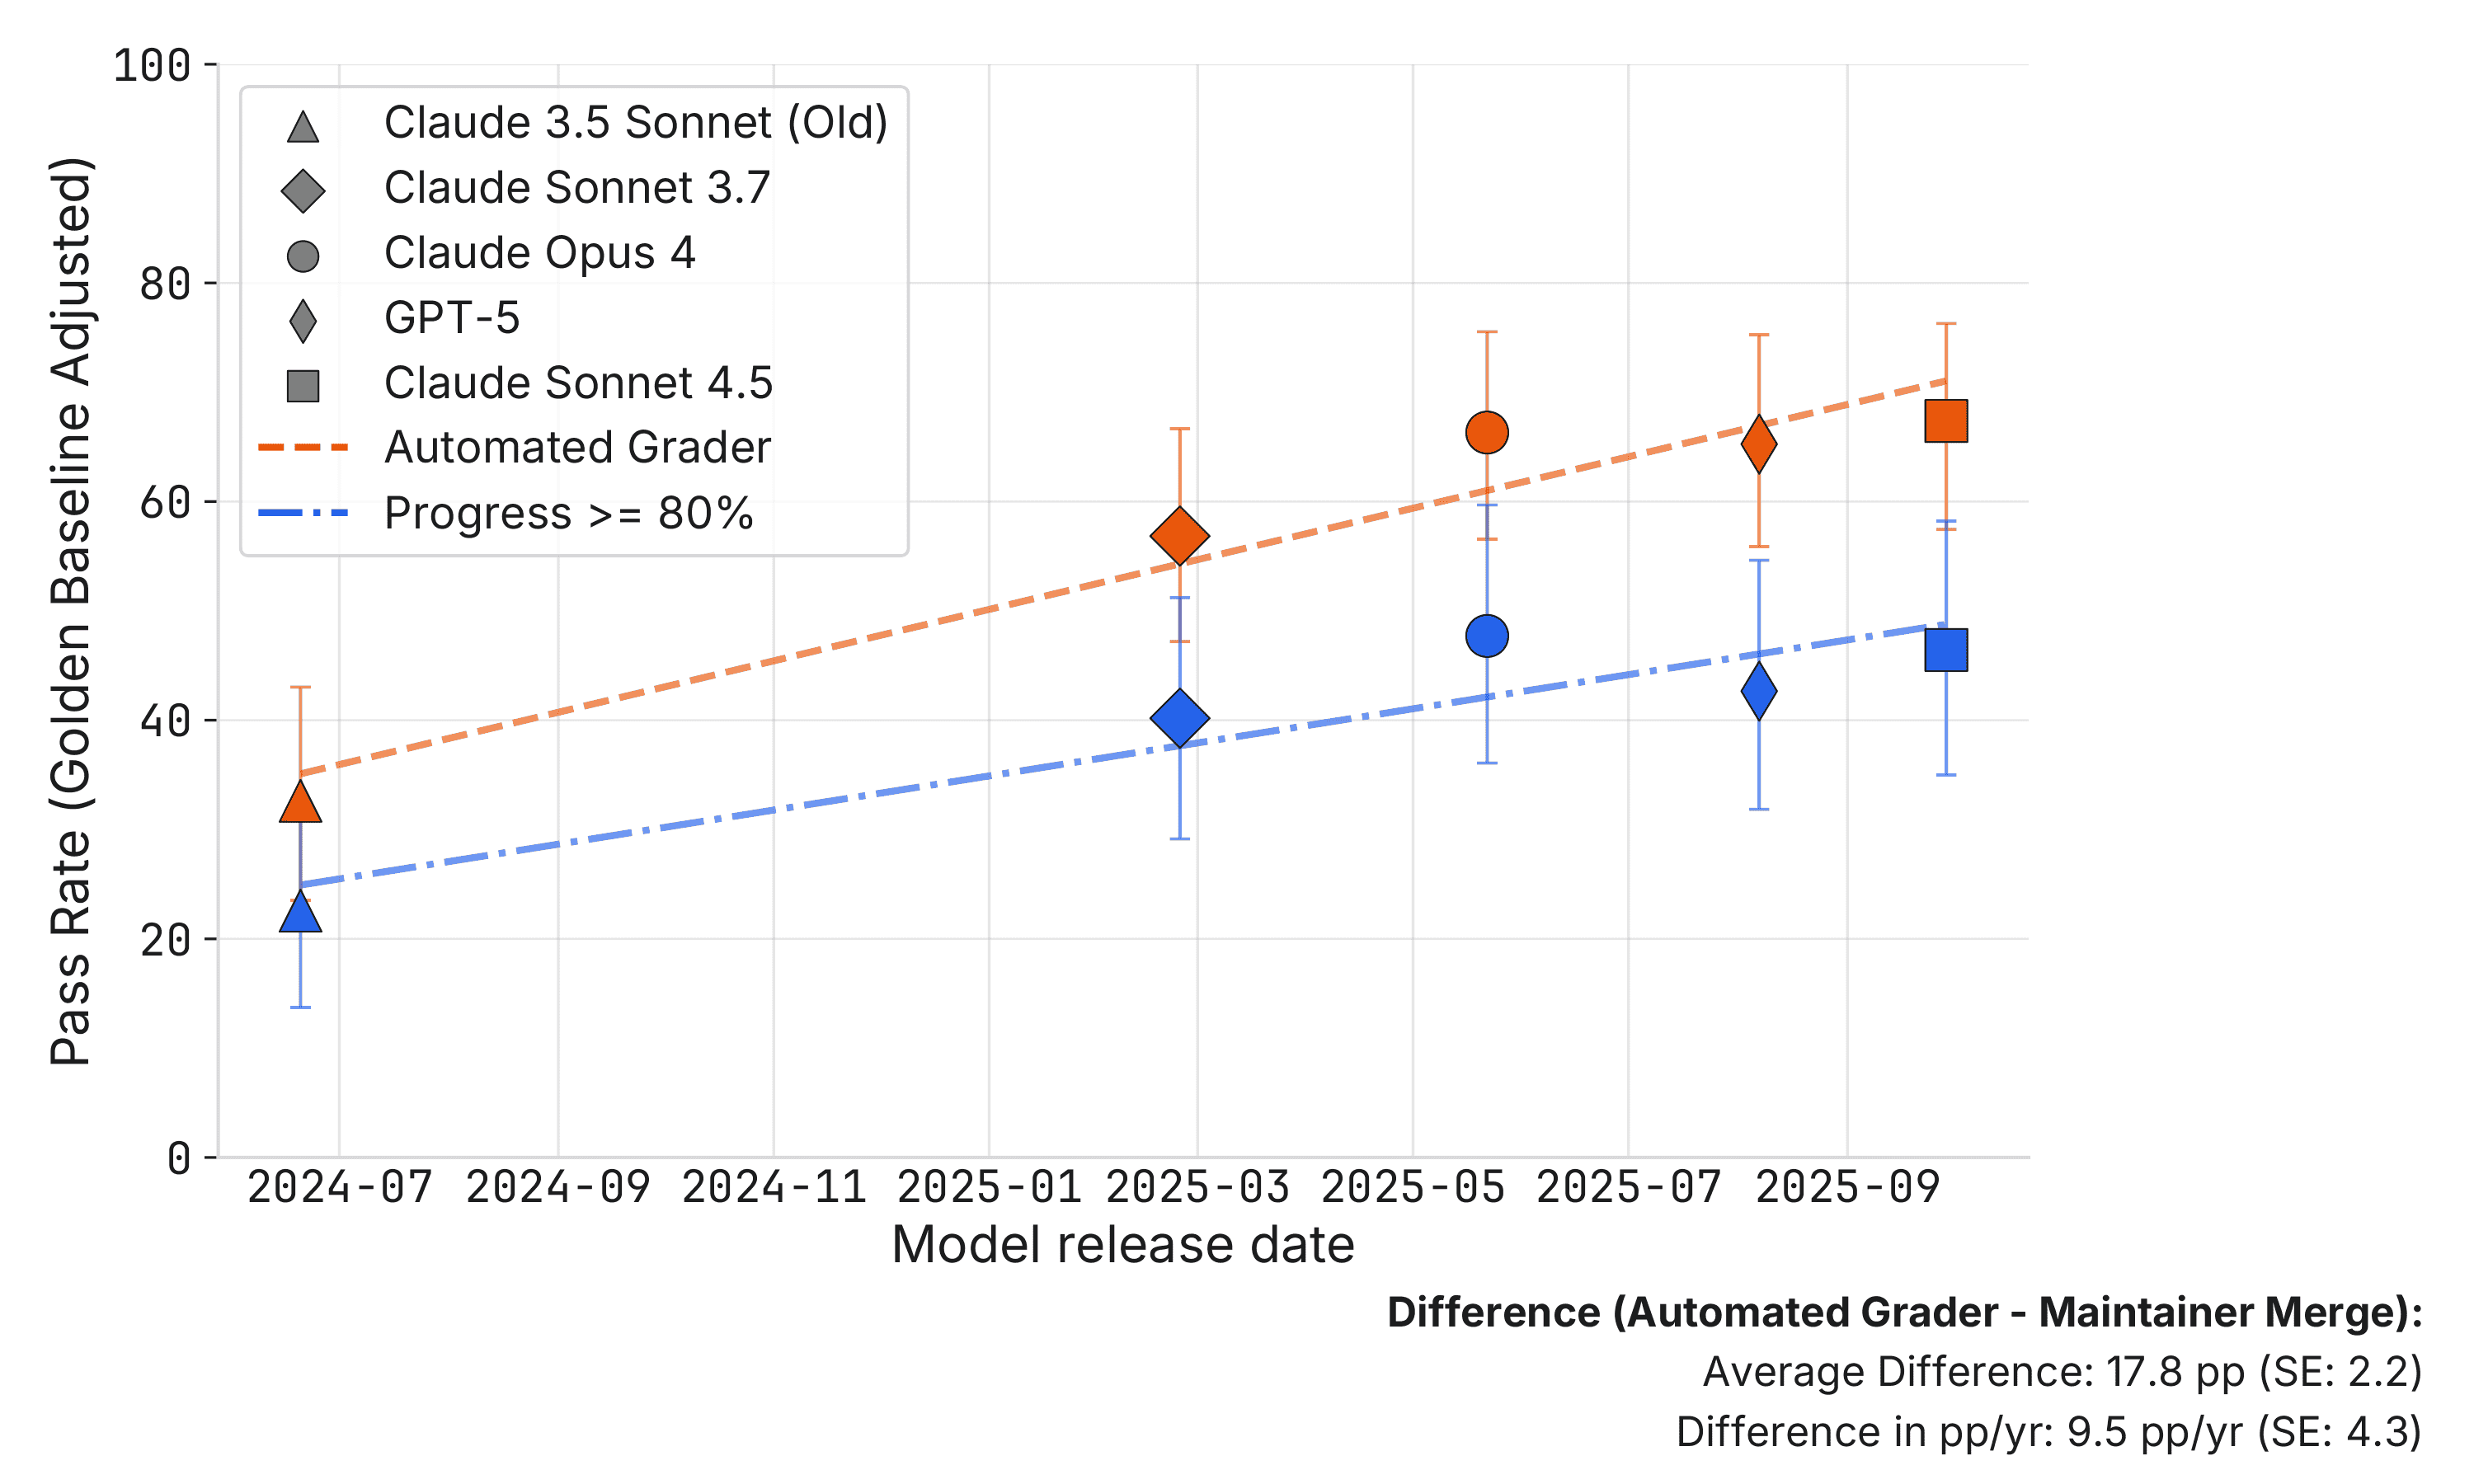
Figure 2: Pass rates normalized as a percentage of the golden baseline, where 100% represents golden patch performance. SWE-bench Automated Grader (orange) records the percentage of patches that pass the automated grader, divided by the golden baseline (100%) and then converted back into a percent. Progress >= 80% (blue) records percent of patches that maintainers said the progress the patch makes towards merging is greater than 80%. This is divided by the golden baseline and then converted back into a percent. Error bars indicate 95% confidence intervals.
To understand why some PRs passed the automated grader but failed maintainer review, Figure 3 breaks out failures by their primary reason, from least serious to most serious problem:
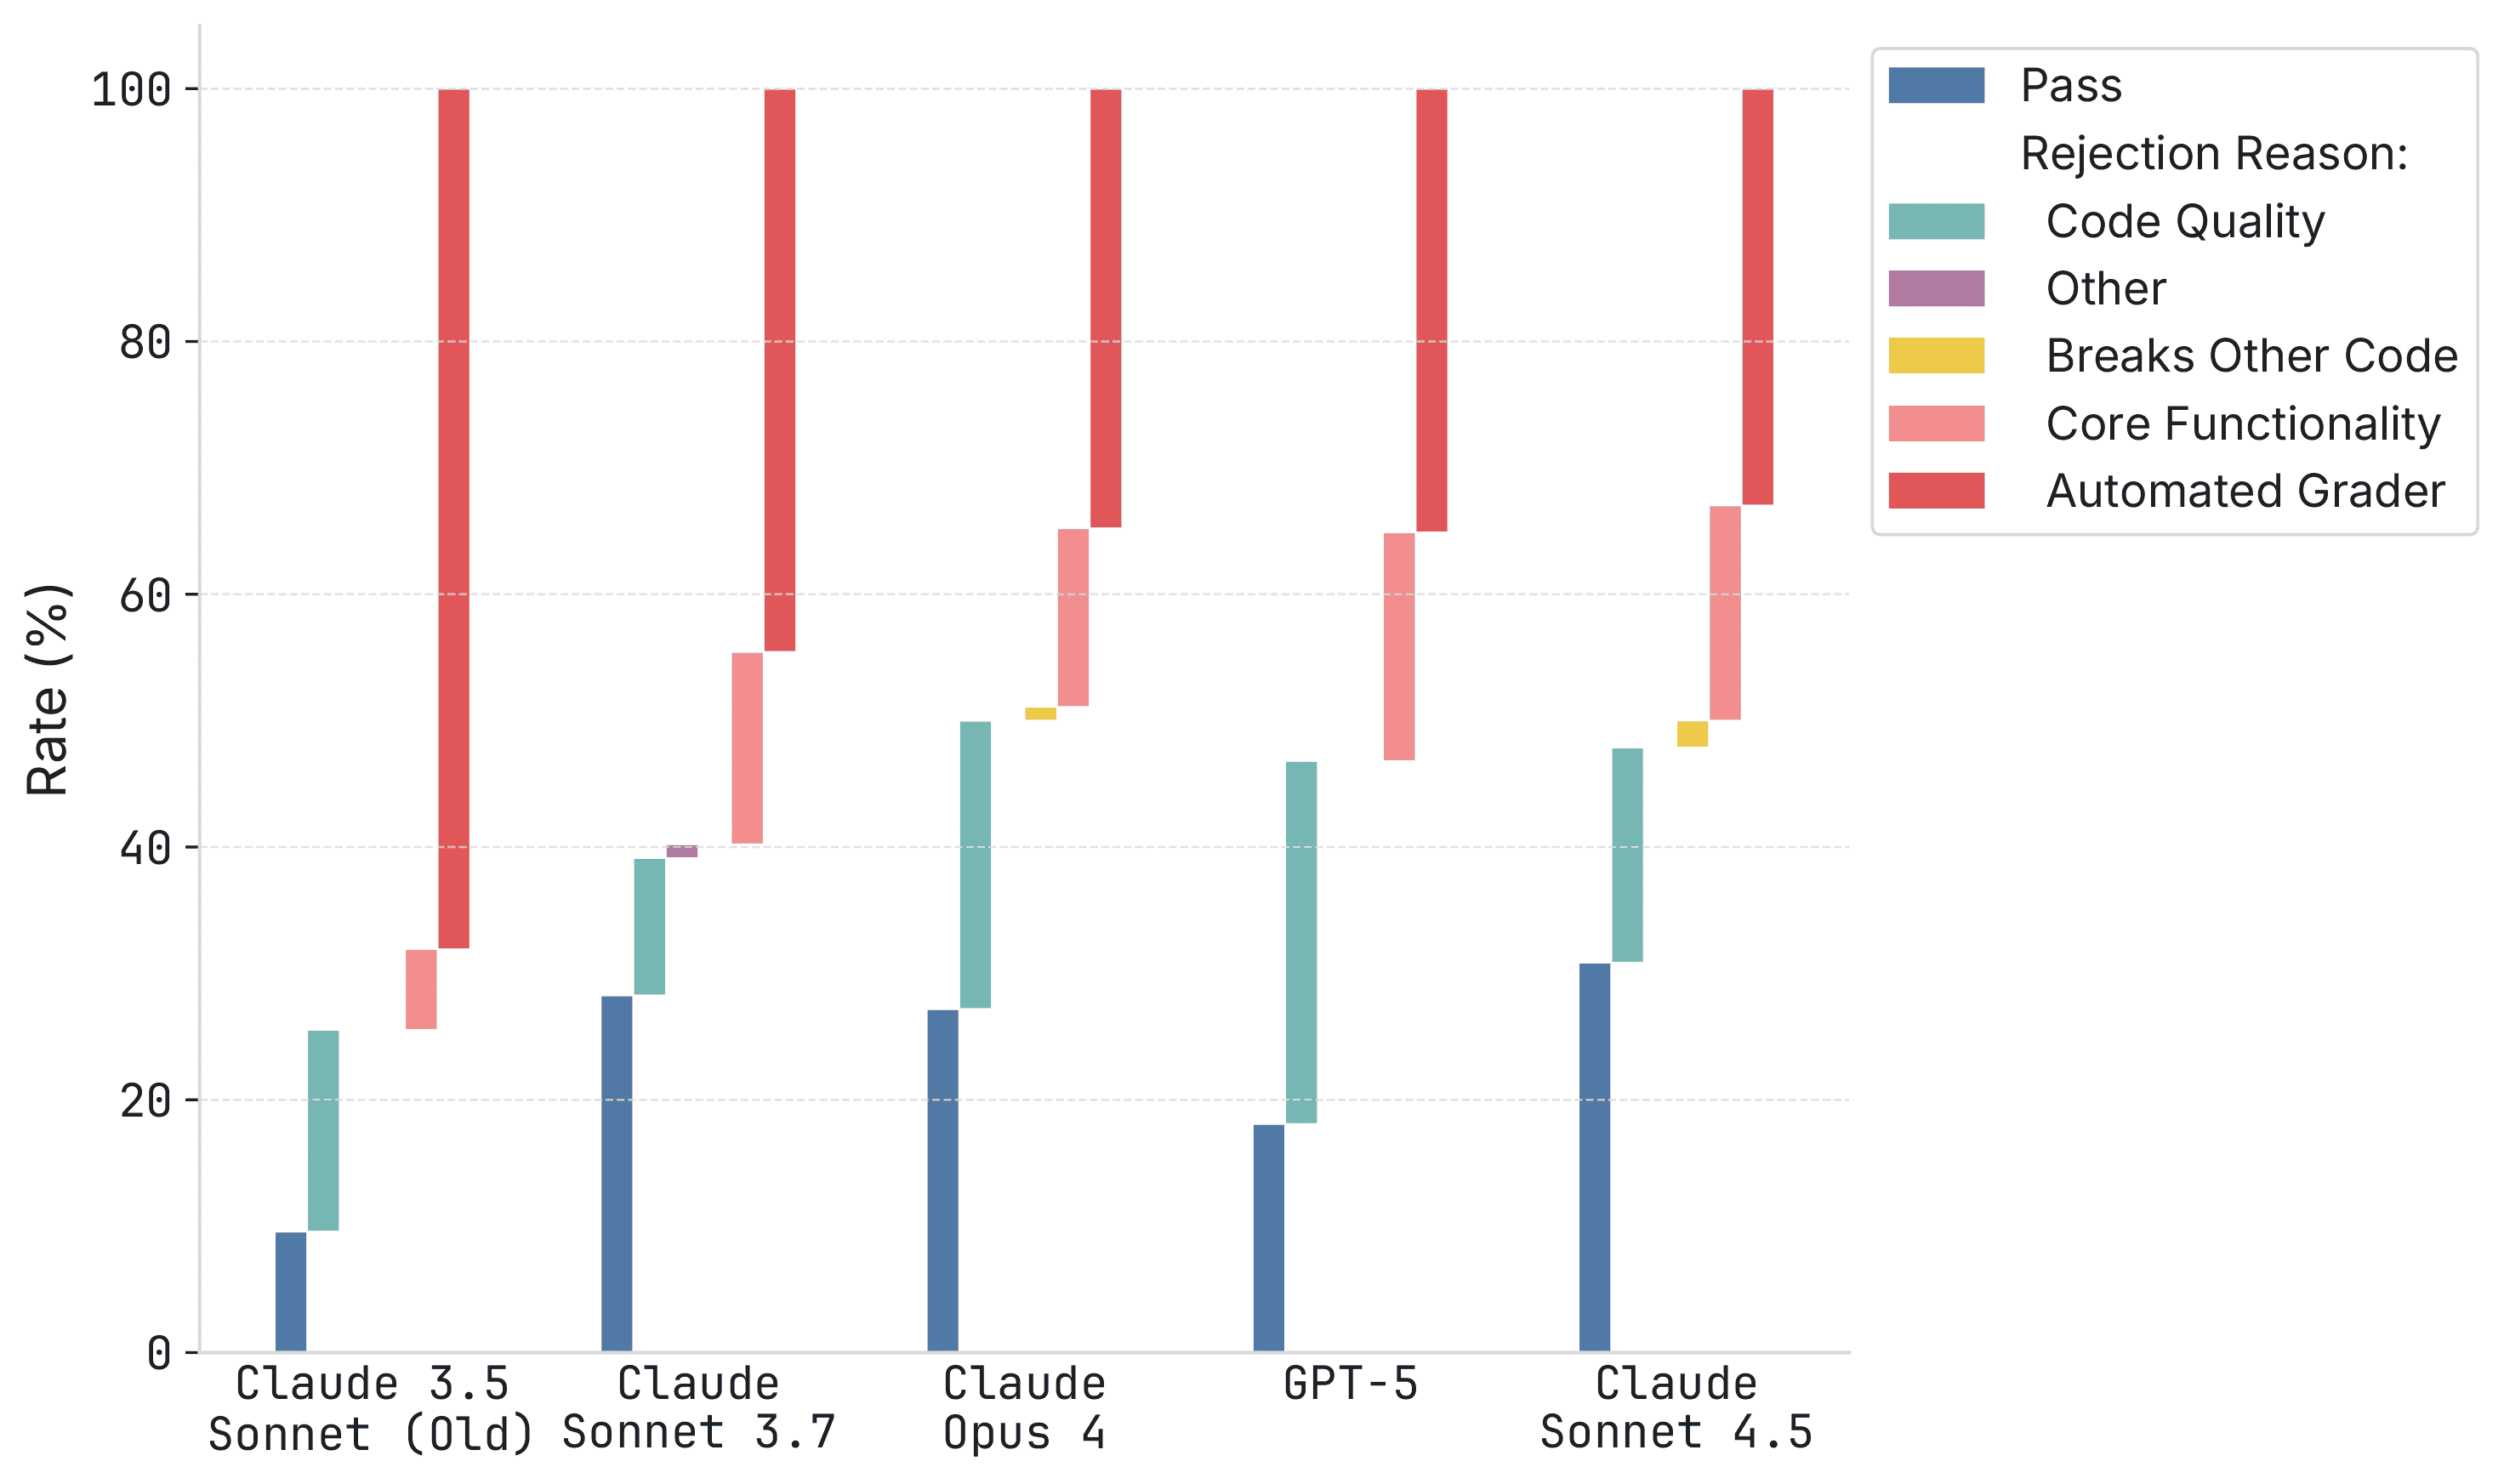
Figure 3: Stacked bars report the distribution of outcomes for each model (bars sum to 100%). Pass denotes patches that passed the automated grader and were accepted by repository maintainers. Automated Grader denotes patches rejected by the automated grader. The remaining segments break down maintainer rejections into Code Quality, Other (uncategorized), Breaks Other Code, and Core Functionality. These are roughly in the order of severity of the issue.
This figure provides more texture to our understanding of AI progress on SWE-bench Verified:
Figures 4 and 5 show example rejections for code quality. Figures 6 and 7 show example rejections for core functionality and breaking other code respectively.
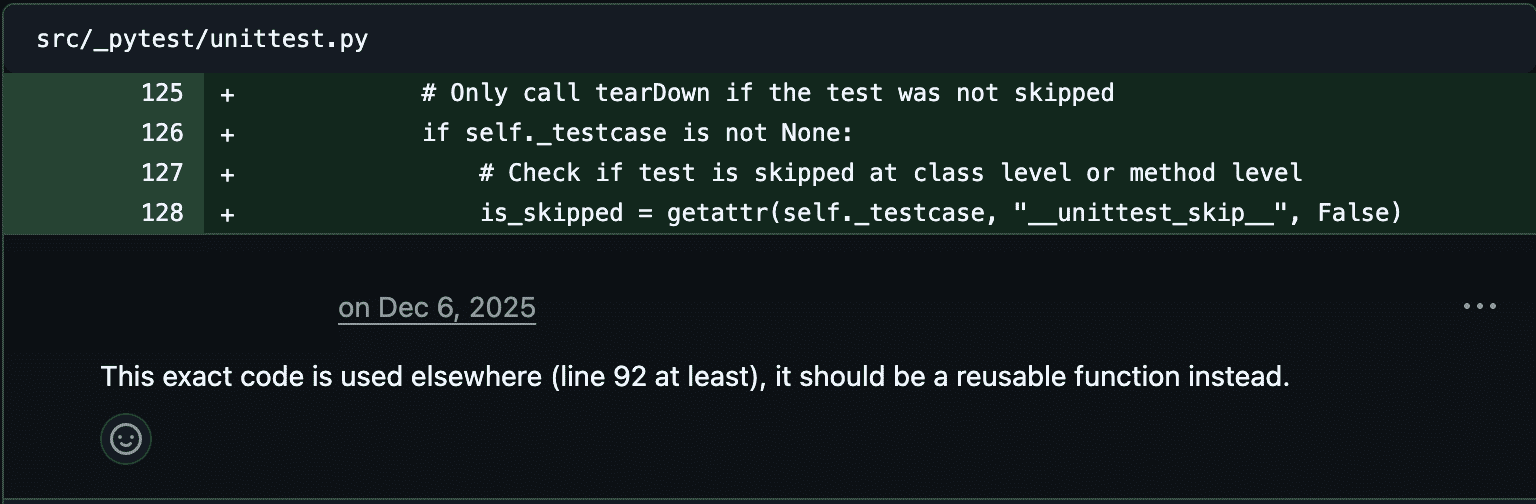
Figure 4: Maintainer Review, Example 1
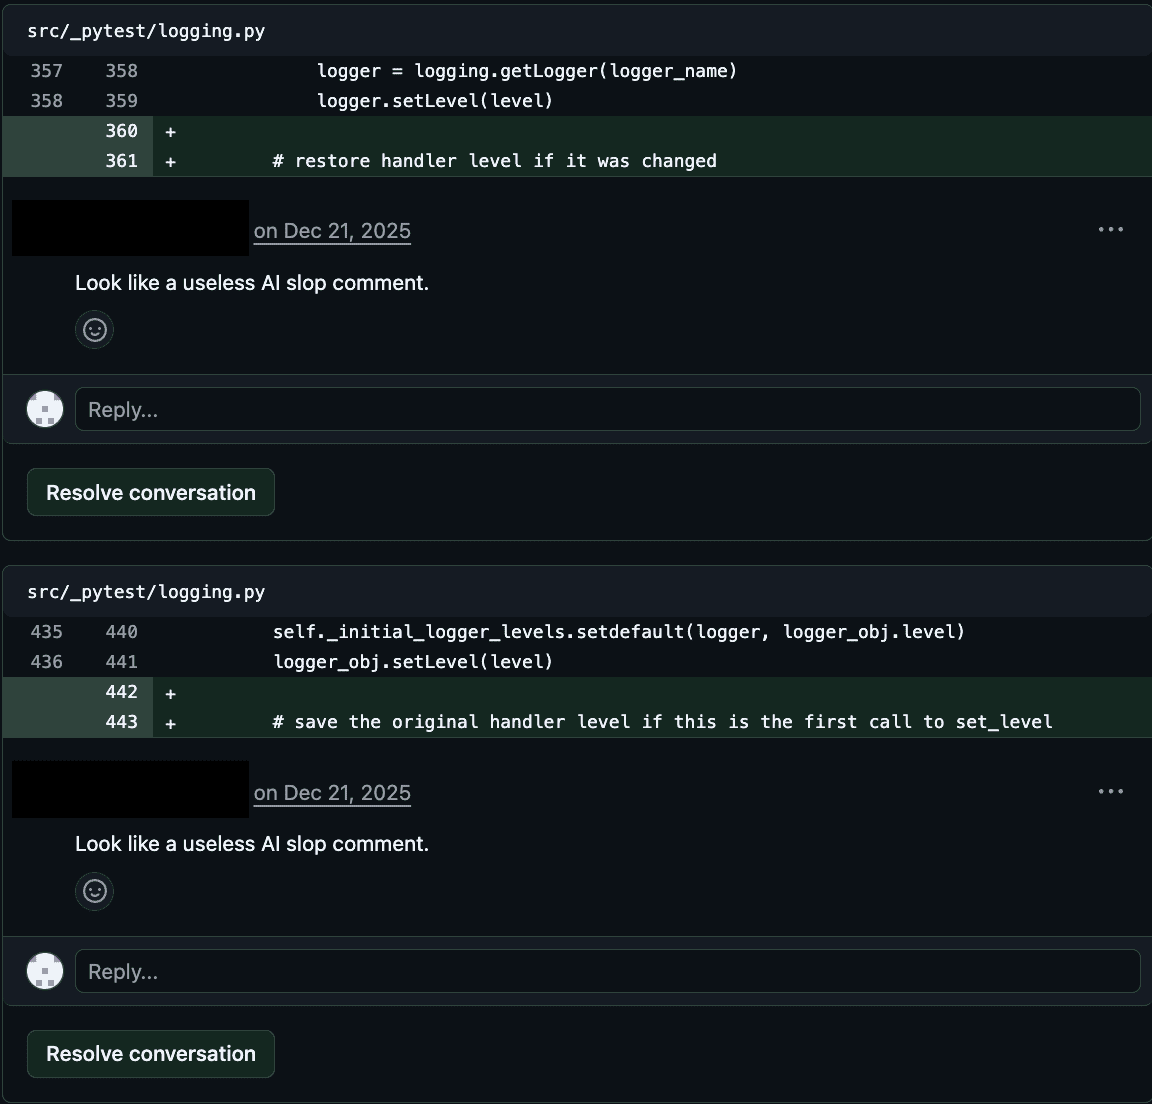
Figure 5: Maintainer Review, Example 2
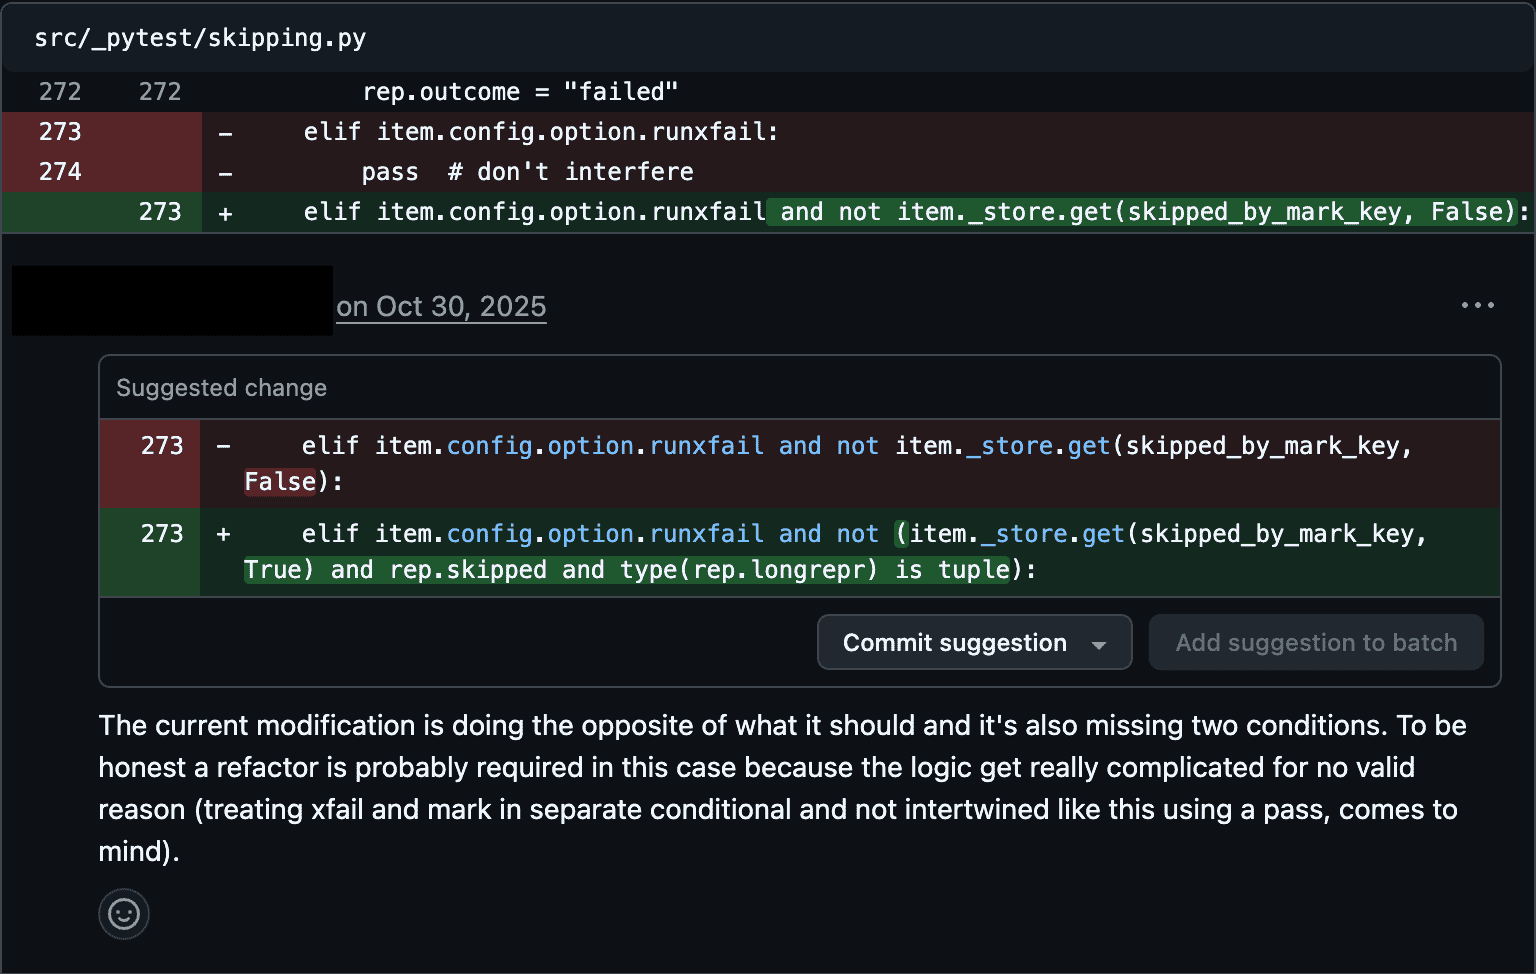
Figure 6: Maintainer Review, Example 3
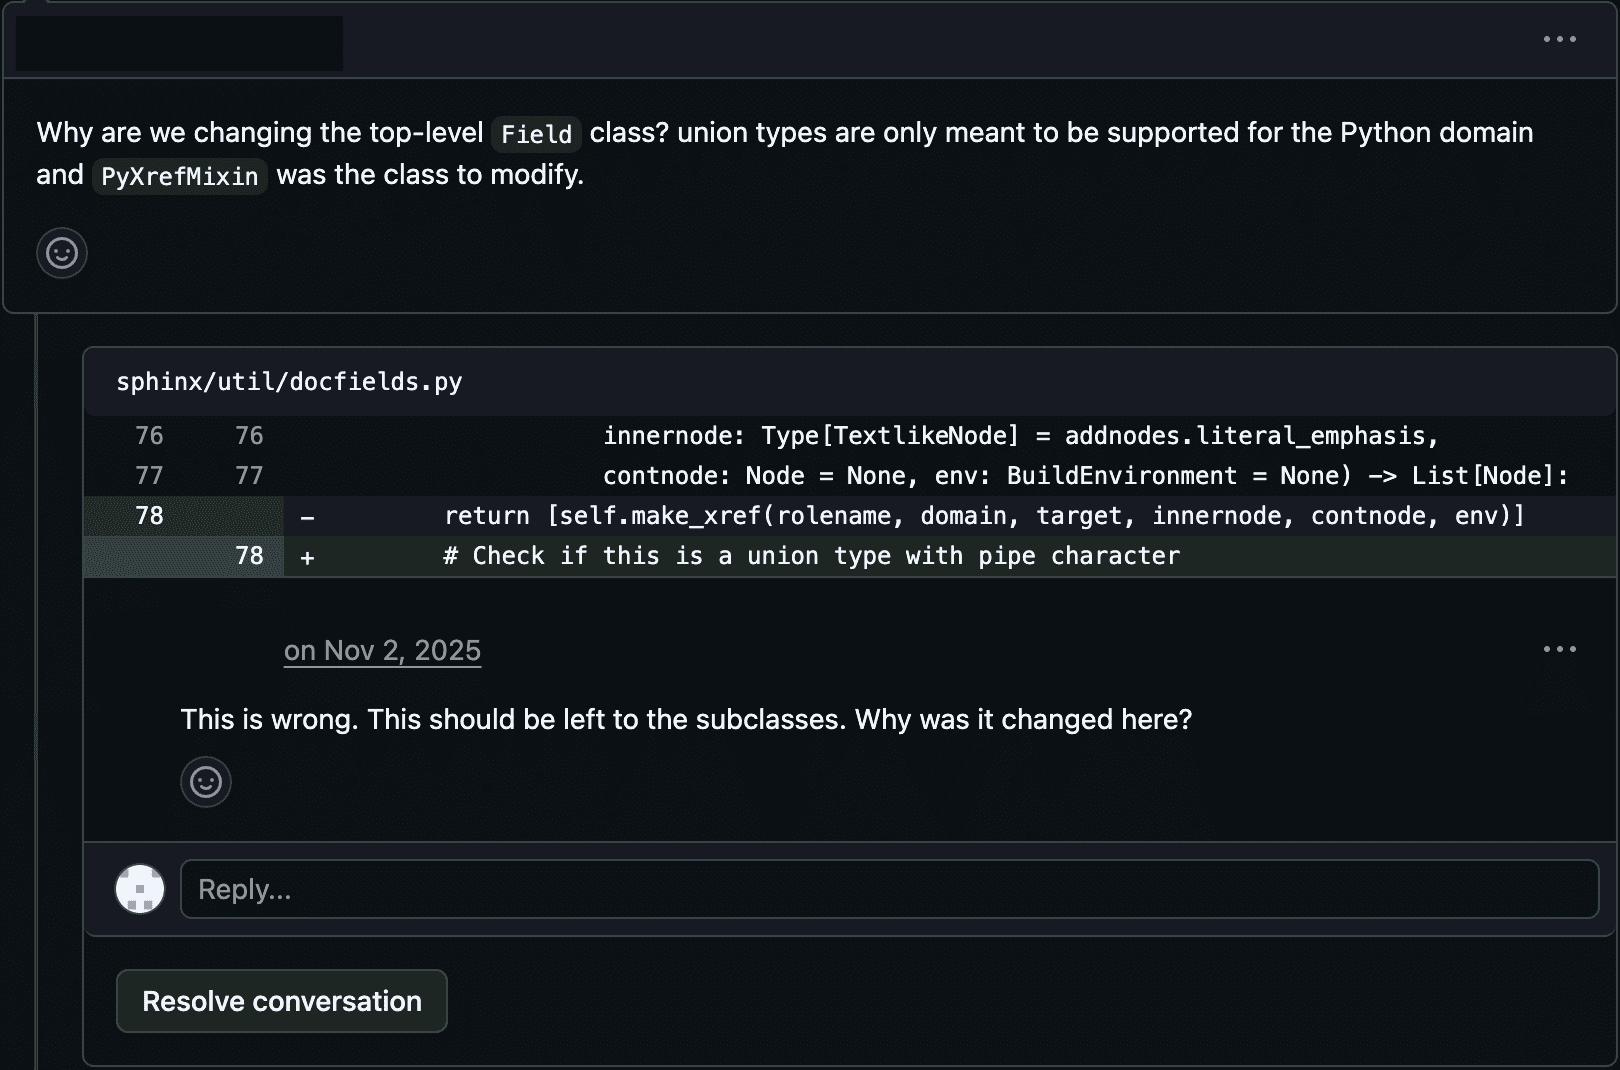
Figure 7: Maintainer Review, Example 4
Our study has many technical limitations, including:
In early 2025, METR published results showing that open-source developers were slowed down when they used AI. This was surprising to us and other experts, at least in part because SOTA models at the time could autonomously complete 40-52% of issues in SWE-bench Verified. The gap between the automated SWE-bench Verified grader and maintainer review perhaps makes this slowdown slightly less surprising.
In general, these results caution against naive extrapolation of some benchmarks to real-world usefulness. The results above focus on SWE-bench Verified, but we suspect similar lessons apply to other benchmarks interpreted in the context of human workflows, e.g., GDPval-AA, UpBench, etc.
Figure 1: Conditional Maintainer Merge Rate Among Automated-Grader-Passing Patches
Notes: This plots the share of automated grader passing patches that are merged by repo maintainers. The Golden Patch Rate shows the human baseline as a horizontal dashed line. Error bars denote 95% confidence intervals.
Figure 2: SWE-bench Automated Grader Scores: Our Maintainer Subset vs. Full Dataset
Notes: For each model, we compute pass rates separately for our sample (n=95) and all SWE-bench Verified tasks (n=500), with error bars indicating 95% confidence intervals based on standard errors.
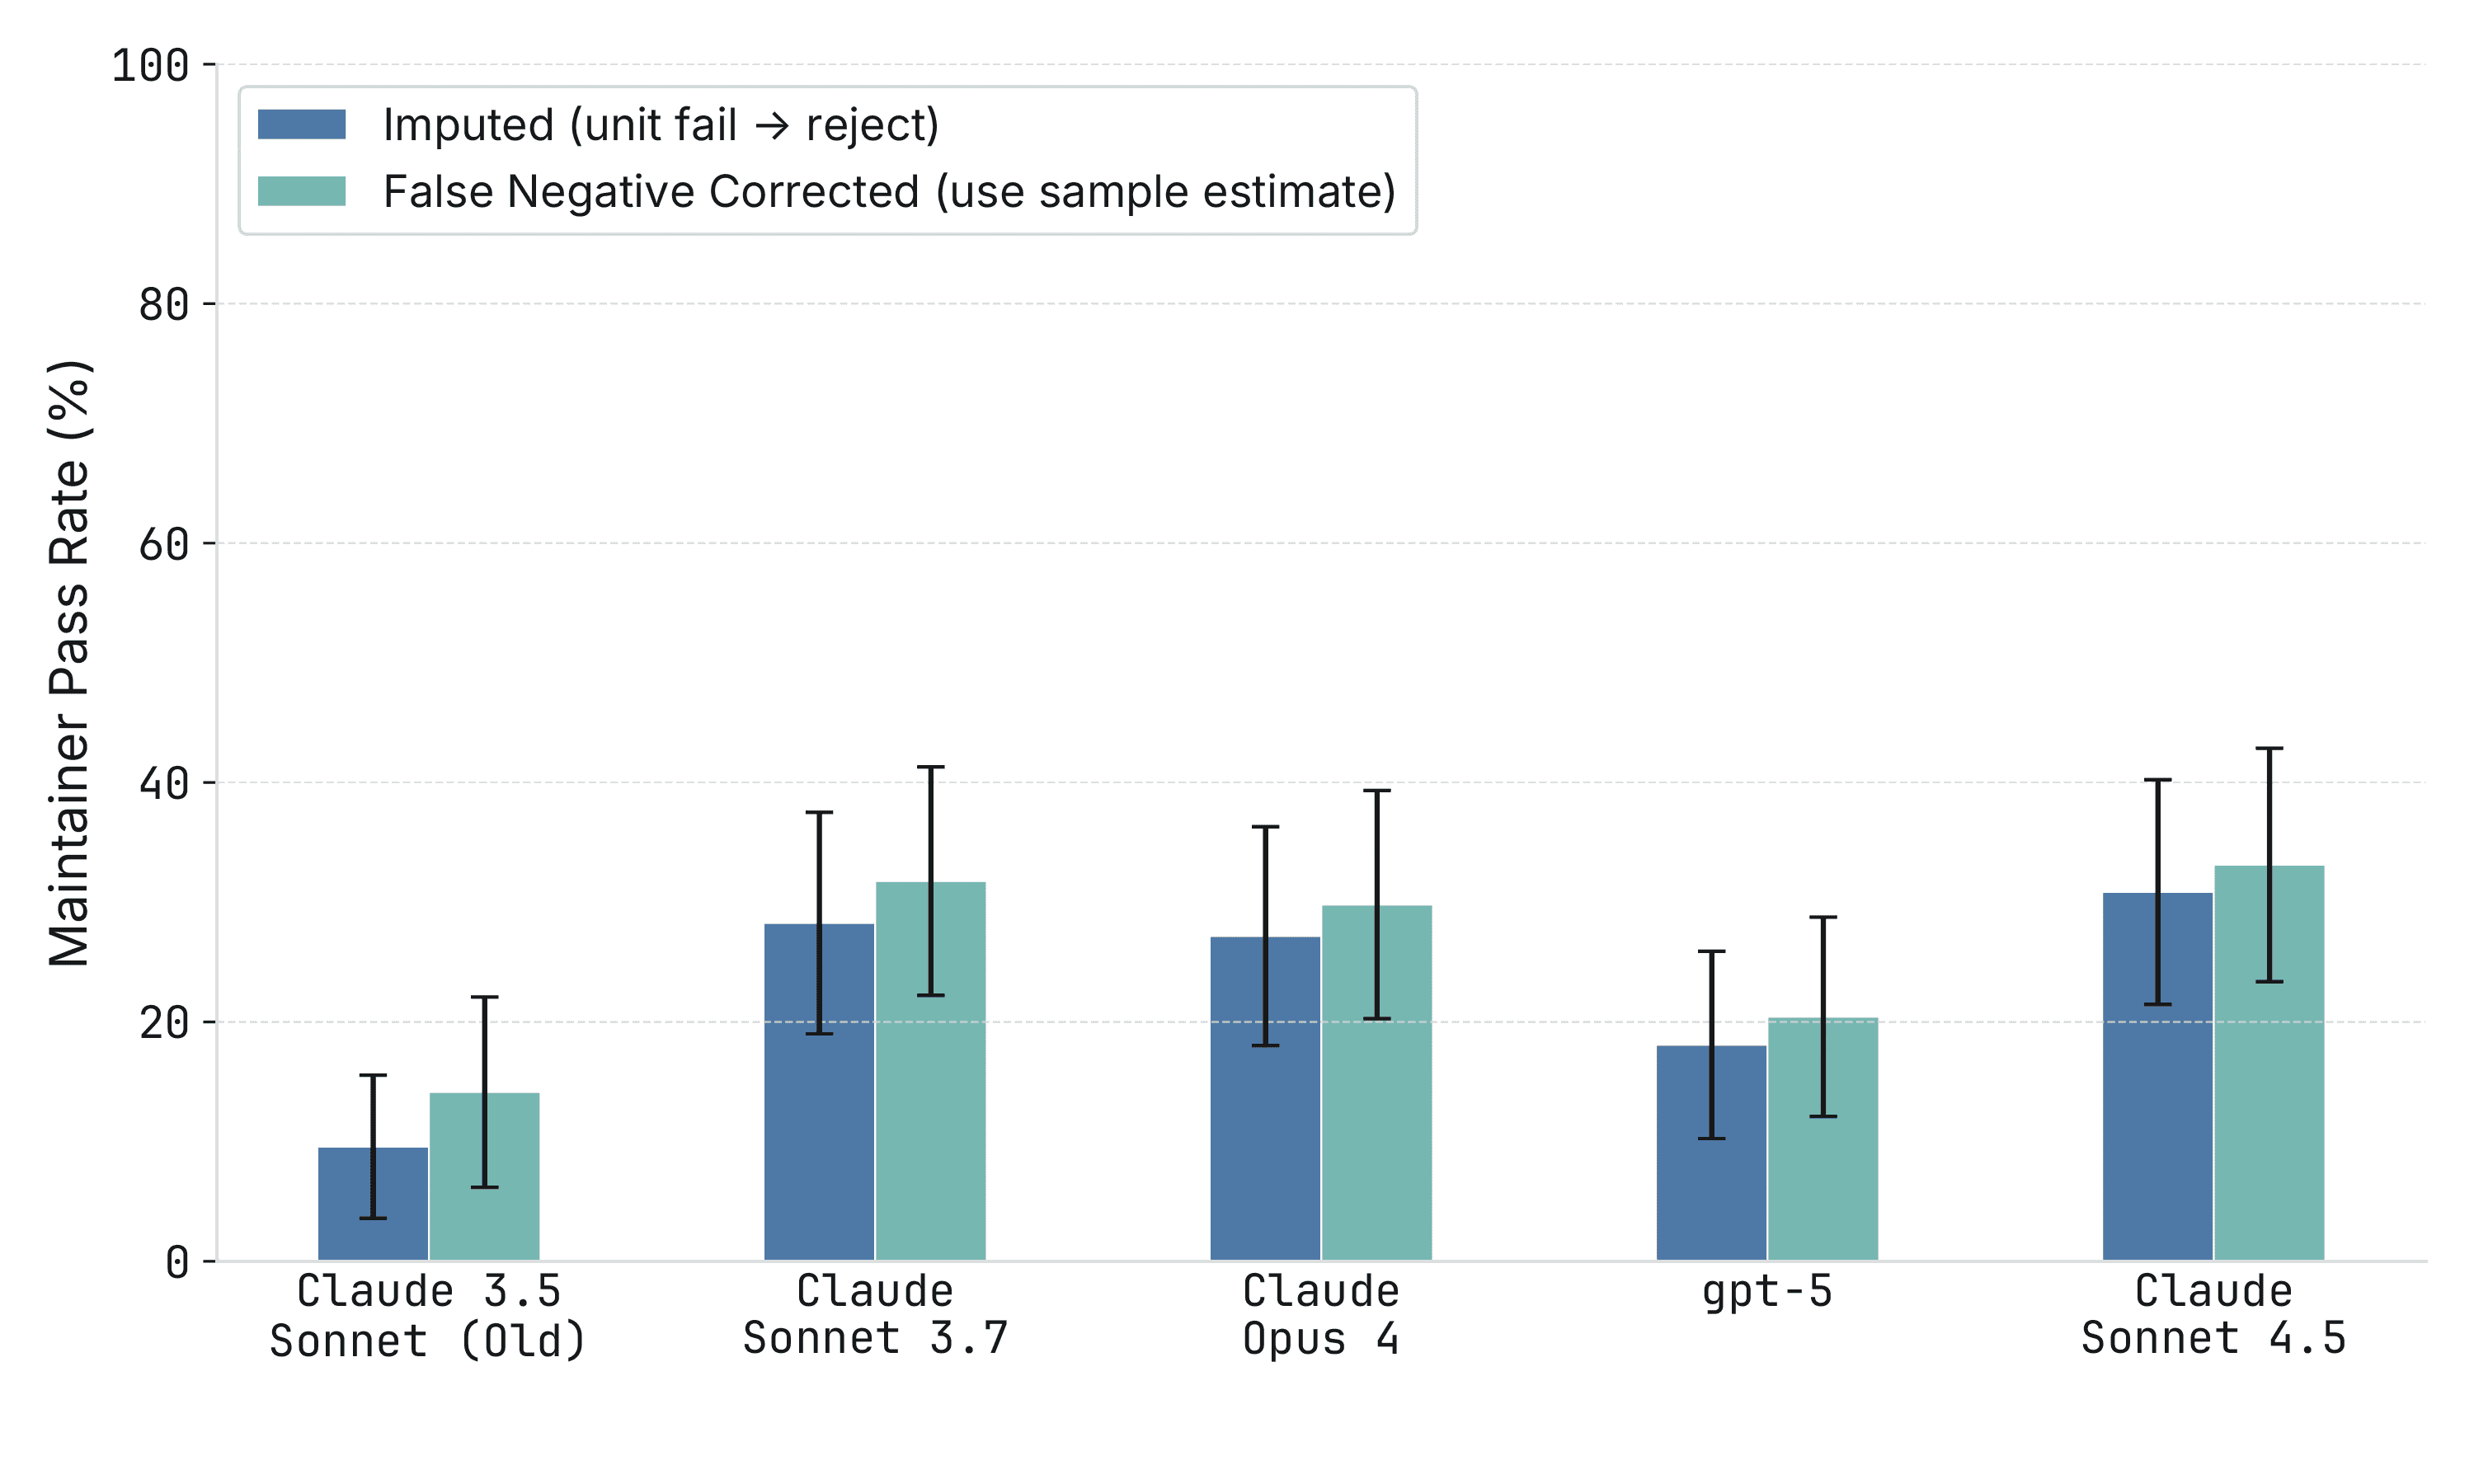
Figure 3: Maintainer Pass Rates with Estimated False Negatives
Notes: The imputed approach (blue) assumes all patches that fail the automated grader would be rejected by maintainers. The false negative corrected approach (teal) adjusts for the observed rate at which maintainers approve patches despite failing the automated grader. Error bars show 95% confidence intervals. We use a pooled false-negative rate across all models because our sample is too small to estimate model-specific rates.
Figure 4: Raw (Unnormalized) Automated Grader vs. Maintainer Pass Rates Over Time
Notes: SWE-bench Automated Grader (orange) records the percentage of patches that pass the automated grader. Maintainer Merge (blue) records percent of patches that are merged by maintainers. Error bars indicate 95% confidence intervals.
Figure 5: Raw (Unnormalized) Progress-Based Pass Rates
Notes: SWE-bench Automated Grader (orange) records the percentage of patches that pass the automated grader. Progress >= 80% (blue) records percent of patches that maintainers said the progress the patch makes towards merging is greater than 80%. Error bars indicate 95% confidence intervals.
Figure 6: Normalized Pass Rates Over Time (SOTA Models Only)
Notes: Restricted to state-of-the-art models at their time of release. Pass rates are normalized as a percentage of the golden (human) baseline.
Figure 7: Automated Grader vs. Maintainer Pass Rates: scikit-learn
Notes: Issues from the scikit-learn repo only. Error bars indicate 95% confidence intervals.
Figure 8: Automated Grader vs. Maintainer Pass Rates: Sphinx
Notes: Issues from the Sphinx repo only. Error bars indicate 95% confidence intervals.
Figure 9: Automated Grader vs. Maintainer Pass Rates: pytest
Notes: Issues from the pytest repo only. Error bars indicate 95% confidence intervals.
Table 1: Linear Regression of Merge Decision on Wave Order
| Variable | Coefficient | P-value |
|---|---|---|
| Wave | 0.016 (0.037) |
0.665 |
| Model FE | Yes | |
| Issue FE | Yes | |
| N | 329 | |
| Partial R² (Wave) | 0.0008 |
Notes: Heteroskedasticity-robust standard errors in parentheses. The dependent variable is whether the maintainer merged the PR (0/1). N=329 reflects only patches that passed the automated grader and were reviewed by maintainers, excluding imputed failures.
We apply the time horizon methodology from Kwa et al. (2025), which converts benchmark scores into a “time horizon”—the human completion time of tasks at which a model achieves 50% success. We use the time-to-complete estimates from SWE-bench directly, though we do not have task families or task weighting as in the original methodology. Note that time-to-complete estimates from SWE-bench come in ranges (e.g., 15min–1hr); we take the geometric mean to get a point estimate.
Methodology. For each evaluation criterion (automated grader and maintainer merge), we fit logistic regressions of pass rate against log task duration. The time horizon T₅₀ is the task duration at which the fitted model predicts 50% success. Note that these estimates are less stable than in Kwa et al. because the task duration range in SWE-bench Verified is narrower, requiring extrapolation away from the data to estimate a 50% time horizon.
Results. The automated grader gives substantially higher time horizons than maintainer review. For example, Claude Sonnet 4.5 has an approximately 50-minute time horizon according to the automated grader but only about an 8-minute time horizon according to maintainers—roughly a 7× overstatement. This level difference is our most robust finding from the time horizon analysis.
claude-sonnet-3.5 1m 4m 15m 1h 4h 16h 0.0 0.2 0.4 0.6 0.8 1.0 P(success) 50% @ 4 min claude-sonnet-3.7 1m 4m 15m 1h 4h 16h 0.0 0.2 0.4 0.6 0.8 1.0 P(success) 50% @ 31 min claude-opus-4 1m 4m 15m 1h 4h 16h 0.0 0.2 0.4 0.6 0.8 1.0 P(success) 50% @ 35 min gpt-5 1m 4m 15m 1h 4h 16h 0.0 0.2 0.4 0.6 0.8 1.0 P(success) 50% @ 39 min Human time claude-sonnet-4.5 1m 4m 15m 1h 4h 16h 0.0 0.2 0.4 0.6 0.8 1.0 P(success) 50% @ 50 min Human time
Figure 10: Time Horizon Estimates: SWE-bench Automated Grader
Notes: Logistic regression fits of pass rate against log task duration using SWE-bench automated grader scores. The time horizon is the task duration at which the fitted model predicts 50% success.
claude-sonnet-3.5 1m 4m 15m 1h 4h 16h 0.0 0.2 0.4 0.6 0.8 1.0 P(success) 50% @ 2 min claude-sonnet-3.7 1m 4m 15m 1h 4h 16h 0.0 0.2 0.4 0.6 0.8 1.0 P(success) 50% @ 6 min claude-opus-4 1m 4m 15m 1h 4h 16h 0.0 0.2 0.4 0.6 0.8 1.0 P(success) 50% @ 4 min gpt-5 1m 4m 15m 1h 4h 16h 0.0 0.2 0.4 0.6 0.8 1.0 P(success) 50% @ 2 min Human time claude-sonnet-4.5 1m 4m 15m 1h 4h 16h 0.0 0.2 0.4 0.6 0.8 1.0 P(success) 50% @ 8 min Human time
Figure 11: Time Horizon Estimates: Maintainer Merge Decision
Notes: Logistic regression fits of pass rate against log task duration using maintainer merge decisions.
Trend. Figure 12 plots time horizons against model release dates. We want to heavily caveat this figure. The only robust conclusion is that the level of time horizon is overstated by a large amount when using the automated grader versus maintainer review. Although it would be tempting to also conclude that the trend is slower under maintainer review, this finding is extremely noisy. The confidence interval for the difference in doubling time ranges from −158 months to 2 months, which is so wide that it is hard to take seriously. Moreover, this result is not very robust to different design decisions. Because SWE-bench data has fairly minimal time horizon dispersion, drawing robust, sufficiently powered conclusions about the rate of improvement is difficult.
Figure 12: Time Horizons Over Model Release Date
Notes: Time horizon estimates plotted against model release date. SWE-bench Automated Grader (orange) and Maintainer Merge (blue). Error bars indicate 95% confidence intervals.
Summary. We find strong evidence that the level of time horizon is overstated by a large amount when using the automated grader versus maintainer review. However, we are unable to draw confident conclusions about the rate of improvement.
此内容由惯性聚合(RSS阅读器)自动聚合整理,仅供阅读参考。 原文来自 — 版权归原作者所有。