



- DESCRIPTION
- TABLE OF CONTENTS
- METHODOLOGY
- DOWNLOAD PDF
Environmental DNA Market by Type of Solution (Services, Products, Instruments & Platforms, Software & Data Analytics), Sample Type (Water, Soil, Sediment, Air, Biological Waste), Detection method, Application, and Region � Global Forecast to 2031

USD 5.61 BN
MARKET SIZE, 2030

CAGR 10.2%
(2025-2030)

300
REPORT PAGES

250
MARKET TABLES
OVERVIEW
Source: Secondary Research, Interviews with Experts, MarketsandMarkets Analysis
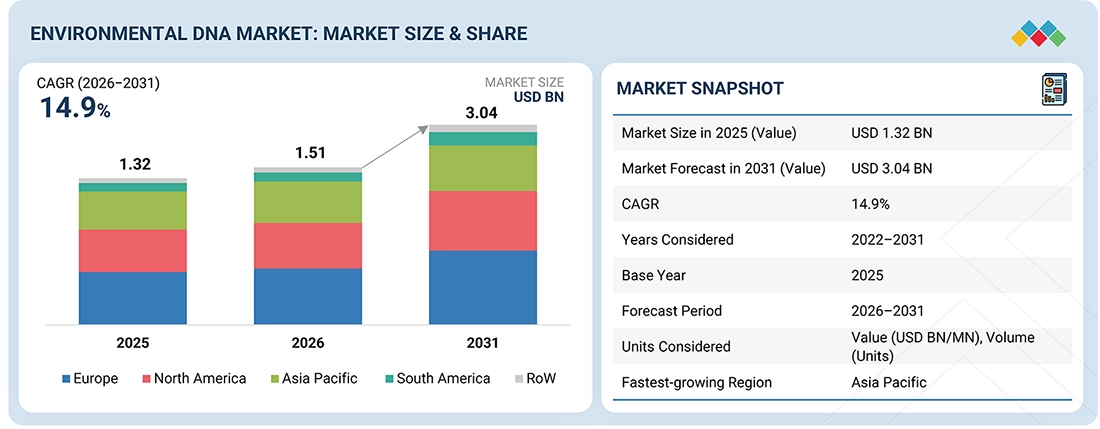
The environmental DNA market is projected to reach USD 5.61 billion by 2031, from USD 1.63 billion in 2026, with a CAGR of 10.2%. The market is growing as monitoring programs shift toward non-invasive approaches. These methods reduce field impact and make data collection easier across different environments. At the same time, there is a higher demand for precise species identification, especially in conservation and regulatory studies. The steady expansion of ecological research programs is also contributing to wider use. Recent advances in sequencing and PCR-based techniques have improved overall performance. Detection is more sensitive, and processing times are shorter than before. This has increased confidence in results and made environmental DNA suitable for routine use. The methods now work reliably across common sample types, including water, soil, and air. Collaboration has also increased across the sector. Research institutes, environmental agencies, and private laboratories are working more closely than in the past. These partnerships help move environmental DNA analysis from research settings into regular monitoring and compliance work, supporting broader adoption.
KEY TAKEAWAYS
-
BY REGION
North America accounted for 57.07% revenue share in 2025.
-
BY TYPE OF SOLUTION
The instruments & platforms segment is expected to lead the environmental DNA market during the forecast period.
-
BY SAMPLE TYPE
The air segment is expected to record the highest CAGR of 11.0% during the forecast period.
-
BY DETECTION METHOD
The qPCR segment accounted for 42.08% of the environmental DNA market in 2025.
-
BY APPLICATION
The biodiversity monitoring segment is expected to capture a large share during the forecast period.
-
COMPETITIVE LANDSCAPE (Key Players)
Key market leaders like Grupo Bimbo, ARYZTA AG, General Mills, and Europastry dominate the frozen bakery market through extensive product portfolios, strong global distribution, and deep expertise in solutions. These players are heavily investing in automation, rapid technologies, high-quality products, and product innovation, while strategic partnerships, acquisitions, and expansion into foodservice channels remain core competitive strategies.
-
COMPETITIVE LANDSCAPE (SME)
Wilderlab NZ Ltd, SimplexDNA, Biome Makers Inc., Metagenom Bio Life Science Inc., and Biomeme have distinguished themselves within the SME landscape by building strong footholds in niche segments, leveraging localized distribution networks, and focusing on biodiversity monitoring and regional demand pockets, underscoring their growing role in the fragmented fro market.
Environmental DNA makes it possible to identify species without direct contact. Samples can be collected from water, soil, sediment, and even air. This supports practical uses such as biodiversity surveys, monitoring invasive species, and checking water quality. Recent progress in sequencing and PCR-based testing has improved how well these methods perform. Detection is now more sensitive and remains reliable even when DNA levels are very low. This has reduced uncertainty in results and expanded the scope of the method. As the need for efficient and scalable environmental monitoring grows, the use of environmental DNA continues to increase. It is now applied across research projects, conservation programs, and regulatory activities, where consistent and repeatable data is required.
TRENDS & DISRUPTIONS IMPACTING CUSTOMERS' CUSTOMERS
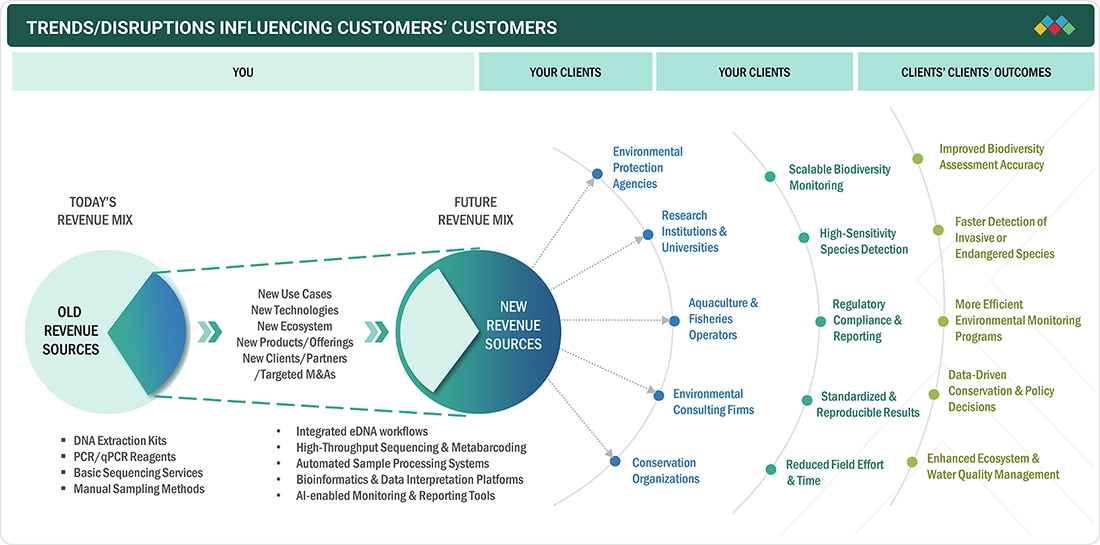
The impact on customers’ customers in the environmental DNA market is largely tied to the need for dependable and timely environmental information. Organizations that use eDNA, such as environmental agencies, research institutions, aquaculture operators, and consulting firms, depend on these results to deliver accurate species detection, consistent outputs, and reduced reliance on intensive fieldwork. These expectations influence how monitoring programs are planned and executed. There is a growing emphasis on methods that can scale efficiently while maintaining data quality. As a result, customers are adopting more advanced eDNA workflows to meet performance and reporting requirements. Improved data quality at this level supports clearer biodiversity assessment, faster identification of target species, and stronger alignment with regulatory standards. It also enables better-informed decisions in conservation planning and ecosystem management, where reliable evidence is essential.
Source: Secondary Research, Interviews with Experts, MarketsandMarkets Analysis
MARKET DYNAMICS

Drivers
Impact
Level
-
• Rising focus on biodiversity conservation

-
• Technological advancements in sequencing and molecular biology


RESTRAINTS
Impact
Level
-
• High initial cost and infrastructure requirements

-
• Lack of standardization and protocol variability


OPPORTUNITIES
Impact
Level
-
• Integration into environmental regulations and compliance frameworks

-
• Adoption in biodiversity credits and natural capital marke+++


CHALLENGES
Impact
Level
-
• Fragmented regulatory and data-governance landscape

-
• Limited awareness and technical understanding among end users

Source: Secondary Research, Interviews with Experts, MarketsandMarkets Analysis
The increasing global emphasis on biodiversity conservation is a key factor driving the growth of the environmental DNA market, as the demand for accurate and scalable ecosystem monitoring solutions continues to rise. According to the World Wildlife Fund, ~ 8.7 million species exist globally, of which nearly 86% of terrestrial and 91% of marine species remain undiscovered, underscoring substantial gaps in biodiversity data and the limitations of conventional monitoring approaches. This lack of comprehensive visibility, combined with ongoing biodiversity decline, is intensifying the need for more efficient and sensitive detection technologies. eDNA is increasingly recognized as a viable solution to these challenges due to its ability to enable non-invasive, high-throughput biodiversity assessment. eDNA facilitates the detection of multiple species from a single environmental sample, significantly improving monitoring efficiency while reducing time, cost, and ecological disturbance. This capability supports broader geographic coverage and repeated monitoring, which are critical for conservation planning and ecosystem management.
High initial cost and infrastructure requirements remain a key restraint in the environmental DNA market, as the use of these methods depends on access to specialized equipment, laboratory facilities, and technical expertise. Although sequencing costs have declined over time, the overall process, including sample collection, processing, sequencing, and data analysis, still involves considerable expense. According to a 2026 study published on the National Center for Biotechnology Information, “the most prevalent concern across all stages of the workflow was affordability,” with costs related to sampling, reagents, analysis, and equipment identified as key barriers. This highlights that cost challenges are not limited to a single step but affect the entire workflow, making it difficult for many organizations to adopt these methods at scale. In addition to cost, infrastructure limitations further restrict adoption. The same study points to a lack of suitable laboratories and limited access to sequencing facilities and bioinformatics capabilities as ongoing constraints, particularly in regions with limited technical resources.
The integration of environmental DNA into environmental regulations and compliance frameworks presents a significant growth opportunity, as governments and regulatory bodies increasingly require reliable and scalable tools for environmental monitoring. Traditional monitoring approaches are often resource-intensive and limited in coverage, creating a need for methods that can support large-scale and repeatable data collection. Environmental DNA is already beginning to be incorporated into monitoring programs and regulatory contexts. A 2025 publication from the eDNA Collaborative notes that federal and state agencies have begun using environmental DNA to help make management and regulatory decisions, and that such data is influencing the implementation of environmental laws. These developments indicate a clear transition of environmental DNA from a research-focused tool toward integration into formal regulatory workflows.
The environmental DNA market faces a significant challenge due to the fragmented regulatory and data-governance landscape, as policies, standards, and data handling practices vary across regions and institutions. While interest in environmental DNA is increasing, there is no unified global framework governing its use, validation, or data interpretation, leading to inconsistencies in how results are accepted and applied. From a market perspective, this fragmented landscape creates uncertainty for industry participants. Differences in regulatory acceptance across regions can slow market entry and limit scalability, while unclear data governance frameworks may create risks related to data use and compliance. Companies may need to adapt their solutions to multiple regulatory environments, increasing complexity and operational costs.
ENVIRONMENTAL DNA MARKET: COMMERCIAL USE CASES ACROSS INDUSTRIES
| COMPANY | USE CASE DESCRIPTION | BENEFITS |
|---|---|---|
|
|
Provides qPCR, NGS workflows, microbial profiling assays, and environmental sample analysis tools for water, soil, and ecosystem monitoring using eDNA | Enables high-sensitivity detection of microbial contaminants and biodiversity signals, supports regulatory environmental testing workflows, and improves scalability of environmental monitoring programs |
|
|
Supplies end-to-end eDNA extraction, purification, and inhibitor-removal kits for wastewater surveillance, biodiversity monitoring, mining-site environmental testing, and microbiome analysis | Improves DNA yield from inhibitor-rich environmental samples, increases reproducibility across large monitoring programs, and enables reliable detection in low-biomass ecosystems |
|
|
Provides next-generation sequencing (NGS) platforms for eDNA metabarcoding, shotgun metagenomics, and biodiversity profiling across aquatic, soil, and airborne environments | Allows simultaneous detection of thousands of species from a single environmental sample, supports large-scale ecosystem monitoring, and enables high-resolution taxonomic identification for conservation and compliance programs |
|
|
Offers contract eDNA sequencing and biodiversity monitoring services (e.g., species detection, invasive species tracking, microbial contamination mapping) using NGS-based environmental DNA analytics | Enables outsourced turnkey biodiversity surveillance, supports long-term environmental monitoring programs, and provides regulatory-grade species detection for conservation and industrial compliance |

Logos and trademarks shown above are the property of their respective owners. Their use here is for informational and illustrative purposes only.
MARKET ECOSYSTEM
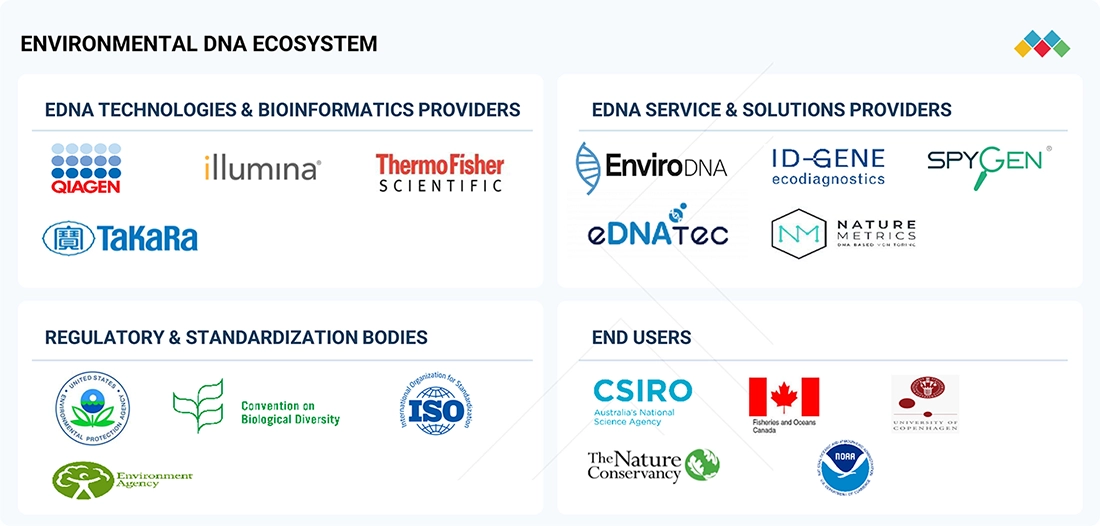
The environmental DNA market ecosystem comprises sample collection providers, molecular reagents, sequencing technologies, bioinformatics solutions, contract testing labs, regulatory authorities, and end users, including environmental monitoring agencies, conservation organizations, research organizations, and infrastructure builders. Reagents provide kits that can extract DNA from low-biomass environmental samples, filtration tools, and amplification reactions designed to work with eDNA samples. Sequencing technologies facilitate the processing of large volumes of genetic material to detect species through metabarcoding and metagenomics analysis. Bioinformatics solutions are required to interpret the results, perform species identification, biodiversity assessment, and ecological modeling. Contract testing laboratories offer their services for species detection, biodiversity monitoring, and water quality analysis. The regulatory authorities develop standards for species detection and water quality monitoring processes.
Logos and trademarks shown above are the property of their respective owners. Their use here is for informational and illustrative purposes only.
MARKET SEGMENTS
Source: Secondary Research, Interviews with Experts, MarketsandMarkets Analysis
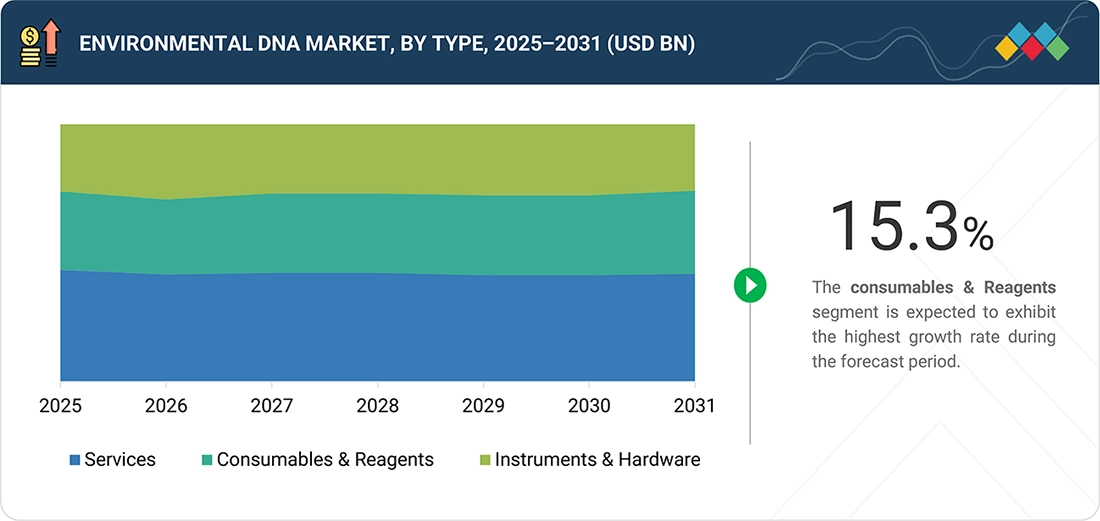
The instruments & platforms category is the major market segment within eDNA, due mainly to the fact that sequencing platforms and PCR platforms constitute the underlying technology foundation necessary for biodiversity monitoring and ecological monitoring activities. The capital-intensive technologies are vital in all areas of application, including governmental monitoring organizations, academic research organizations, third-party laboratories, and environmental consulting services, and hence account for the significant market share held by these segments. With increasing deployment of eDNA technology beyond research purposes and into regulation and ecosystem monitoring, demand for sequencing and analytical instruments will continue to underpin market expenditure.
Water is the leading segment due to the extensive adoption of water bodies as the most developed field of application for eDNA analysis. The detection of aquatic organisms, including fish, invasive species, amphibians, pathogens, and bio-indicators via water sampling can be performed effectively, and the DNA yield in water samples is higher than in other media. Therefore, the use of water samples in eDNA analysis is widespread among environmental protection authorities, fisheries, conservation initiatives, hydroelectric power plants, and water suppliers. Water samples are integral to biodiversity monitoring programs, which enhances their share in the total market value.
Metabarcoding is currently the fastest-growing method, since it allows for the identification of many species from one sample at once, thus being extremely useful in studying biodiversity on an ecosystem scale. Metabarcoding is rapidly growing because there is a great demand for landscape-scale studies, habitat restoration assessment, impacts of construction works, as well as mapping the country's biodiversity. This is caused by the fast growth of next-generation sequencing (NGS) technologies, the decrease in the cost of sequencing, and more reliable reference databases.
Biodiversity monitoring remains the leading application in terms of market share as a result of widespread adoption of eDNA in the form of non-invasive tests to confirm the presence of species in various ecosystems. Government departments, conservation groups, and developers of infrastructure projects find applications for eDNA in the process of mapping ecosystems based on their economic viability and ability to track down species that may otherwise not be seen. Biodiversity monitoring accounts for most of the overall market value.
REGION
Asia-Pacific is projected to be the fastest region in the environmental DNA market
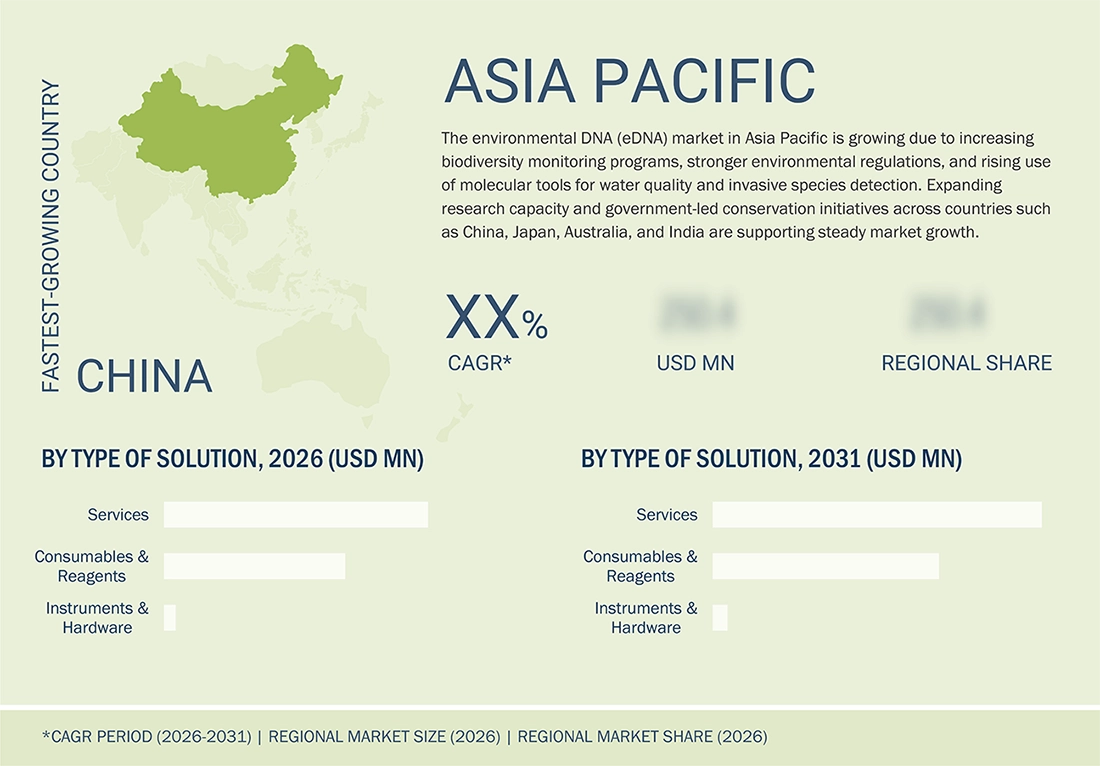
The Asia Pacific is the fastest-growing market for the environmental DNA market. The rapid growth of this market can be attributed to several factors, such as increased government investment in biodiversity monitoring projects, the development of aquaculture and fisheries management programs, rapid adoption of environmental surveillance technology, and strong regulations that ensure conservation of ecosystems. Apart from this, there has been an increase in demand owing to extensive projects being undertaken to monitor river basins, analyze marine biodiversity, and undertake environmental impact studies associated with infrastructure development. Additionally, developments in the field of genomics, along with growing cooperation among research institutions and environmental authorities, have led to widespread adoption of eDNA in both aquatic and terrestrial environments.
ENVIRONMENTAL DNA MARKET: COMPANY EVALUATION MATRIX
In the environmental DNA market, key companies profiled include Thermo Fisher Scientific, QIAGEN, Illumina Inc., Eurofins Genomics, Bio-Rad Laboratories, Inc., Agilent Technologies, Inc., DNATeC, PacBio, NatureMetrics, and EnviroDNA.
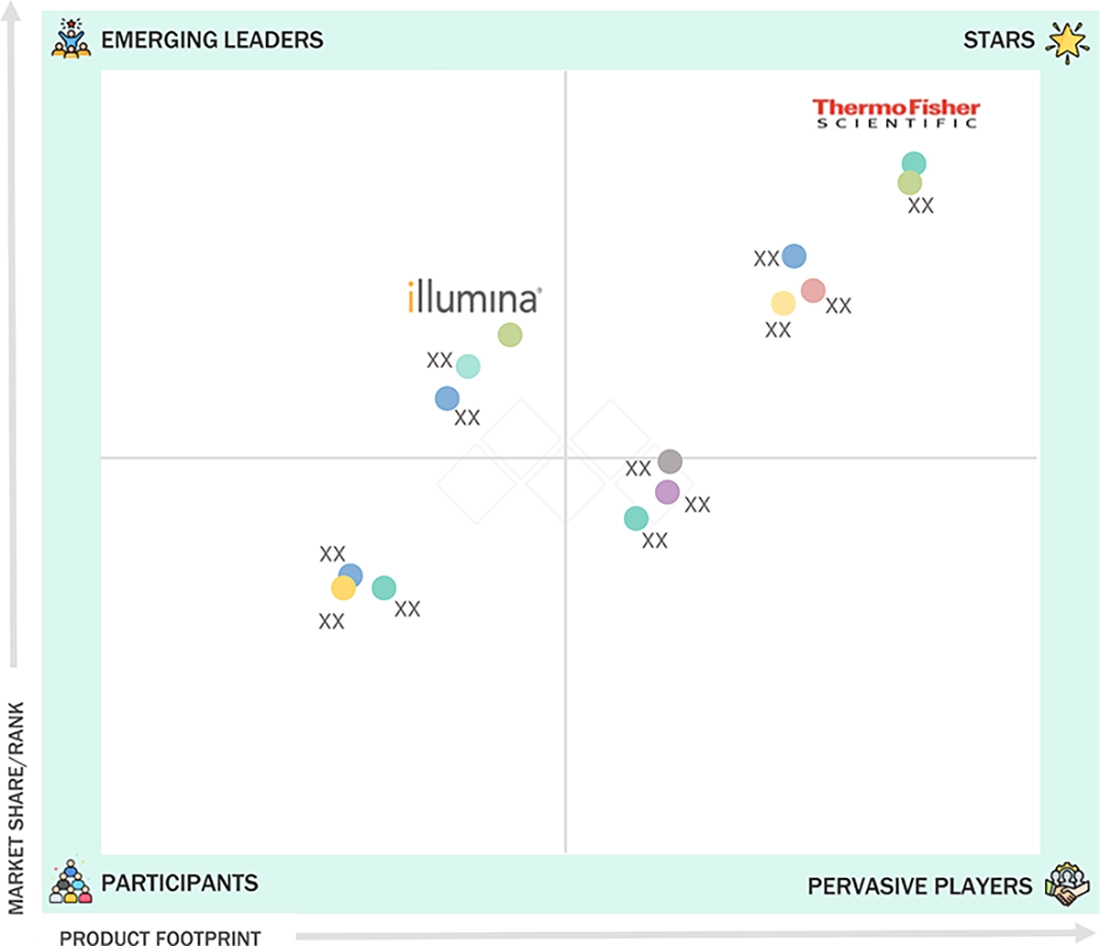
Source: Secondary Research, Interviews with Experts, MarketsandMarkets Analysis
KEY MARKET PLAYERS
- Thermo Fisher Scientific (US)
- QIAGEN (Netherlands)
- Illumina Inc. (US)
- Eurofins Genomics (Germany)
- Bio-Rad Laboratories, Inc. (US)
- Agilent Technologies, Inc. (US)
- eDNATeC (Canada)
- PacBio (US)
- NatureMetrics (UK)
- EnviroDNA (Australia)
- Cramer Fish Sciences (US)
- Psygen (Canada)
- Takara Bio Inc. (Japan)
- Smith Root Inc. (US)
- Stantec (Canada)
MARKET SCOPE
| REPORT METRIC | DETAILS |
|---|---|
| Market Size in 2025 (Value) | USD 1.54 BN |
| Market Forecast in 2030 (Value) | USD 5.61 BN |
| Growth Rate | CAGR of 10.2% from 2026 to 2031 |
| Years Considered | 2021–2031 |
| Base Year | 2025 |
| Forecast Period | 2026–2031 |
| Units Considered | Value (USD BN/MN), Volume (Metric Tons) |
| Report Coverage | Revenue forecast, company ranking, competitive landscape, growth factors, and trends |
| Segments Covered |
|
| Regions Covered | North America, Europe, Asia Pacific, South America, Rest of the World |
WHAT IS IN IT FOR YOU: ENVIRONMENTAL DNA MARKET REPORT CONTENT GUIDE
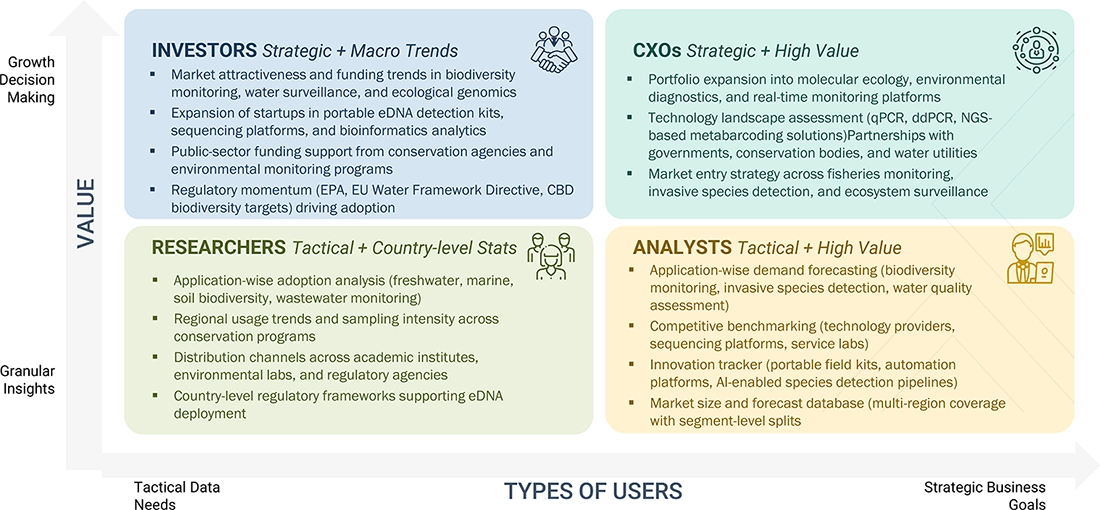
DELIVERED CUSTOMIZATIONS
We have successfully delivered the following deep-dive customizations:
| CLIENT REQUEST | CUSTOMIZATION DELIVERED | VALUE ADDS |
|---|---|---|
| Environmental DNA market sizing | Conducted market sizing across key eDNA solution segments (services, products, instruments & platforms, software & data analytics) and sample types (water, soil, sediment, air, biological waste) | Identified high-growth solution segments supporting investment prioritization |
| Detection technology assessment | Evaluated detection methods including qPCR, ddPCR, metabarcoding, metagenomics, CRISPR-based detection, and hybrid workflows across environmental monitoring applications | Identified transition from single-species detection toward multi-species ecosystem intelligence platforms |
| Application-level opportunity mapping | Assessed demand across biodiversity monitoring, invasive species detection, conservation biology, aquaculture & fisheries, water quality assessment, climate change impact assessment, and regulatory compliance | Identified priority application areas with strongest regulatory adoption and funding support |
RECENT DEVELOPMENTS
- February 2026 : Illumina partnered with the San Diego Zoo Wildlife Alliance to sequence thousands of samples from its Frozen Zoo biobank, enabling genomic analysis of endangered species and supporting global biodiversity conservation efforts.
- February 2026 : SGS announced the launch of its environmental DNA biodiversity monitoring services in the UK, expanding its environmental testing capabilities in the region. The offering includes structured service packages such as QuickScan, BioScan, FullScan, and InsectScan, enabling non-invasive species detection across environmental samples. This expansion strengthens SGS’s positioning in the Environmental DNA market by enhancing its service availability in a key regulatory and biodiversity-focused geography.
- October 2025 : NatureMetrics expanded into Brazil by launching local laboratory services through a partnership with Firjan SENAI, enabling in-country biodiversity monitoring and reporting using eDNA technology. This expansion establishes local analytical capabilities in one of the world’s most biodiverse regions, improving data accessibility and turnaround times. The move strengthens NatureMetrics’ presence in the Environmental DNA market by enabling scalable, region-specific biodiversity intelligence and supporting wider adoption of eDNA-based monitoring solutions.
Table of Contents
 Exclusive indicates content/data unique to MarketsandMarkets and not available with any competitors.
TITLE
PAGE NO
1
INTRODUCTION
15
2
EXECUTIVE SUMMARY
3
PREMIUM INSIGHTS
4
MARKET OVERVIEW
4.1
INTRODUCTION
4.2
MARKET DYNAMICS
4.2.1
DRIVERS
4.2.2
RESTRAINTS
4.2.3
OPPORTUNITY
4.2.4
CHALLENGES
4.3
UNMET NEEDS AND WHITE SPACES
4.4
INTERCONNECTED MARKETS AND CROSS-SECTOR OPPORTUNITIES
4.5
STRATEGIC MOVES BY TIER-1/2/3 PLAYERS
5
INDUSTRY TRENDS
5.1
PORTER’S FIVE FORCES ANALYSIS
5.2
MACROECONOMICS INDICATORS
5.2.1
INTRODUCTION
5.2.2
GDP TRENDS AND FORECAST
5.2.3
TRENDS IN THE GLOBAL GENOMICS AND MOLECULAR BIOLOGY INDUSTRY
5.2.4
TRENDS IN ENVIRONMENTAL DNA MARKET INDUSTRY
5.3
SUPPLY CHAIN ANALYSIS
5.4
VALUE CHAIN ANALYSIS
5.5
ECOSYSTEM ANALYSIS
5.6
PRICING ANALYSIS
5.6.1
AVERAGE SELLING PRICE TREND OF KEY PLAYERS, BY SAMPLE TYPE
5.6.2
AVERAGE SELLING PRICE TREND, BY REGION
5.7
TRADE ANALYSIS
5.7.1
IMPORT SCENARIO (HS CODE)
5.7.2
EXPORT SCENARIO (HS CODE)
5.8
KEY CONFERENCES AND EVENTS, 2026–2027
5.9
TRENDS/DISRUPTIONS IMPACTING CUSTOMER BUSINESS
5.10
INVESTMENT AND FUNDING SCENARIO
5.11
CASE STUDY ANALYSIS
5.12
IMPACT OF 2025 US TARIFF
5.12.1
KEY TARIFF RATES
5.12.2
PRICE IMPACT ANALYSIS
5.12.3
IMPACT ON COUNTRIES/REGIONS
5.12.4
IMPACT ON END-USE INDUSTRIES
6
TECHNOLOGICAL ADVANCEMENTS, AI-DRIVE IMPACT, PATENTS, INNOVATIONS, AND FUTURE APPLICATIONS
6.1
KEY TECHNOLOGIES
6.2
COMPLEMENTARY TECHNOLOGIES
6.3
TECHNOLOGY/PRODUCT ROADMAP
6.4
PATENT ANALYSIS
6.5
FUTURE APPLICATIONS
6.6
IMPACT OF AI/GEN AI ON ENVIRONMENTAL DNA MARKET
6.6.1
TOP USE CASES AND MARKET POTENTIAL
6.6.2
BEST PRACTICES
6.6.3
CASE STUDIES RELATED TO AI IMPLEMENTATION
6.6.4
INTERCONNECTED ECOSYSTEM AND IMPACT ON MARKET PLAYERS
6.6.5
CLIENTS’ READINESS TO ADOPT GEN AI
6.7
SUCCESS STORIES AND REAL-WORLD APPLICATIONS
7
SUSTAINABILITY AND REGULATORY LANDSCAPE
7.1
REGIONAL REGULATIONS AND COMPLIANCE
7.1.1
REGULATORY BODIES, GOVERNMENT AGENCIES, AND OTHER ORGANIZATIONS
7.1.2
INDUSTRY STANDARDS
7.2
SUSTAINABILITY INITIATIVES
7.3
SUSTAINABILITY IMPACT AND REGULATORY POLICY INITIATIVES
7.4
CERTIFICATIONS, LABELING, ECO-STANDARDS
8
CUSTOMER LANDSCAPE AND BUYER BEHAVIOR
8.1
DECISION-MAKING PROCESS
8.2
BUYER STAKEHOLDERS AND BUYING EVALUATION CRITERIA
8.3
ADOPTION BARRIERS & INTERNAL CHALLENGES
8.4
UNMET NEEDS FROM VARIOUS END-USE INDUSTRIES
8.5
MARKET PROFITABILITY
9
ENVIRONMENTAL DNA MARKET, BY TYPE OF SOLUTION (MARKET SIZE & FORECAST TO 2031 – IN VALUE, USD MILLION & VOLUME, TONS)
9.1
INTRODUCTION
9.2
SERVICES
9.2.1
SAMPLE COLLECTION & FIELD SERVICES
9.2.2
LABORATORY ANALYSIS
9.2.3
SEQUENCING SERVICES
9.2.4
BIOINFORMATICS & DATA INTERPRETATION
9.2.5
END-TO-END PROJECT STUDIES
9.3
PRODUCTS
9.3.1
SAMPLING KITS
9.3.2
DNA EXTRACTION KITS
9.3.3
PCR REAGENTS (QPCR, DDPCR)
9.3.4
LIBRARY PREPARATION KITS
9.4
INSTRUMENTS & PLATFORMS
9.4.1
PCR SYSTEMS (QPCR, DDPCR)
9.4.2
SEQUENCING PLATFORMS (NGS)
9.4.3
SAMPLE PROCESSING INSTRUMENTS
9.5
SOFTWARE & DATA ANALYTICS
9.5.1
BIOINFORMATICS PIPELINES
9.5.2
SPECIES IDENTIFICATION DATABASES
9.5.3
MONITORING & REPORTING PLATFORMS
10
ENVIRONMENTAL DNA MARKET, BY SAMPLE TYPE (MARKET SIZE & FORECAST TO 2031 – IN VALUE, USD MILLION & VOLUME, TONS)
10.1
INTRODUCTION
10.2
WATER
10.3
SOIL
10.4
SEDIMENT
10.5
AIR
10.6
BIOLOGICAL WASTE
11
ENVIRONMENTAL DNA MARKET, BY DETECTION METHOD (MARKET SIZE & FORECAST TO 2031 – IN VALUE, USD MILLION & VOLUME, TONS)
11.1
INTRODUCTION
11.2
QPCR (QUANTITATIVE POLYMERASE CHAIN REACTION)
11.3
DDPCR (DIGITAL DROPLET PCR)
11.4
METABARCODING
11.5
METAGENOMICS
11.6
CRISPR-BASED DETECTION
11.7
HYBRID METHODS (E.G., QPCR + NGS)
12
ENVIRONMENTAL DNA MARKET, BY APPLICATION (MARKET SIZE & FORECAST TO 2031 – IN VALUE, USD MILLION & VOLUME, TONS)
12.1
INTRODUCTION
12.2
BIODIVERSITY MONITORING
12.3
INVASIVE SPECIES DETECTION
12.4
CONSERVATION BIOLOGY
12.5
AQUACULTURE & FISHERIES
12.6
WATER QUALITY ASSESSMENT
12.7
CLIMATE CHANGE IMPACT ASSESSMENT
12.8
FORENSICS &COMPLIANCE
13
ENVIRONMENTAL DNA MARKET, BY REGION (MARKET SIZE & FORECAST TO 2031 – IN VALUE, USD MILLION & VOLUME, TONS)
13.1
INTRODUCTION
13.2
NORTH AMERICA
13.2.1
US
13.2.2
CANADA
13.2.3
MEXICO
13.3
EUROPE
13.3.1
UK
13.3.2
GERMANY
13.3.3
FRANCE
13.3.4
ITALY
13.3.5
SPAIN
13.3.6
REST OF EUROPE
13.4
ASIA PACIFIC
13.4.1
CHINA
13.4.2
INDIA
13.4.3
JAPAN
13.4.4
AUSTRALIA & NEW ZEALAND
13.4.5
REST OF ASIA PACIFIC
13.5
SOUTH AMERICA
13.5.1
BRAZIL
13.5.2
ARGENTINA
13.5.3
REST OF SOUTH AMERICA
13.6
REST OF THE WORLD
13.6.1
AFRICA
13.6.2
MIDDLE EAST
14
COMPETITIVE LANDSCAPE
14.1
OVERVIEW
14.2
KEY PLAYER STRATEGIES/RIGHT TO WIN
14.3
MARKET SHARE ANALYSIS,
14.4
REVENUE ANALYSIS, 2023–2025
14.5
BRAND/PRODUCT COMPARISON
14.6
COMPANY VALUATION AND FINANCIAL METRICS
14.7
COMPANY EVALUATION MATRIX: KEY PLAYERS,
14.7.1
STARS
14.7.2
EMERGING LEADERS
14.7.3
PERVASIVE PLAYERS
14.7.4
PARTICIPANTS
14.7.5
COMPANY FOOTPRINT
14.8
COMPANY EVALUATION MATRIX: START-UPS/SMES,
14.8.1
PROGRESSIVE COMPANIES
14.8.2
RESPONSIVE COMPANIES
14.8.3
DYNAMIC COMPANIES
14.8.4
STARTING BLOCKS
14.8.5
COMPETITIVE BENCHMARKING
14.9
COMPETITIVE SCENARIO
15
COMPANY PROFILES
15.1
KEY PLAYERS
15.1.1
THERMO FISHER SCIENTIFIC INC.
15.1.1.1
BUSINESS OVERVIEW
15.1.1.2
PRODUCTS/SOLUTIONS/SERVICES OFFERED
15.1.1.3
RECENT DEVELOPMENTS
15.1.1.4
MNM VIEW
15.1.1.4.1
KEY STRENGTHS/RIGHT TO WIN
15.1.1.4.2
STRATEGIC CHOICES
15.1.1.4.3
WEAKNESSES/COMPETITIVE THREATS
15.1.2
QIAGEN
15.1.3
ILLUMINA, INC.
15.1.4
EUROFINS GENOMICS
15.1.5
BIO-RAD LABORATORIES, INC.
15.1.6
AGILENT TECHNOLOGIES, INC.
15.1.7
EDNATEC
15.1.8
PACBIO
15.1.9
NATUREMETRICS
15.1.10
ENVIRODNA
15.1.11
CRAMER FISH SCIENCES
15.1.12
SPYGEN
15.1.13
TAKARA BIO INC.
15.1.14
SMITH-ROOT, INC.
15.1.15
STANTEC
15.2
OTHER PLAYERS
15.2.1
MACHEREY-NAGEL GMBH & CO.
15.2.2
ID-GENE ECODIAGNOSTICS LTD.
15.2.3
NEW ENGLAND BIOLABS
15.2.4
SGS SOCIÉTÉ GÉNÉRALE DE SURVEILLANCE SA
15.2.5
EDNATURE LTD.
15.2.6
APPLIED GENOMICS
15.2.7
IDL (ICEBERG DATA LAB)
15.2.8
ZYMO RESEARCH CORPORATION
15.2.9
FERA SCIENCE LIMITED
15.2.10
SURESCREEN SCIENTIFICS LIMITED
NOTE: THE LIST OF COMPANIES MENTIONED ABOVE IS TENTATIVE. AS THE RESEARCH PROGRESSES, WE SHALL RETAIN ONLY ENVIRONMENTAL DNA COMPANIES.
16
RESEARCH METHODOLOGY
16.1
RESEARCH DATA
16.1.1.1
SECONDARY DATA
16.1.1.2
KEY DATA FROM SECONDARY SOURCES
16.1.2
PRIMARY DATA
16.1.2.1
KEY DATA FROM PRIMARY SOURCES
16.1.2.2
KEY PRIMARY INSIGHTS
16.1.2.3
BREAKDOWN OF PRIMARY INTERVIEWS
16.2
MARKET SIZE ESTIMATION
16.2.1
BOTTOM-UP APPROACH
16.2.2
TOP-DOWN APPROACH
16.3
DATA TRIANGULATION
16.4
RESEARCH ASSUMPTIONS
16.5
RESEARCH LIMITATIONS AND RISK ASSESSMENT
17
ADJACENT & RELATED MARKETS
18
APPENDIX
18.1
DISCUSSION GUIDE
18.2
KNOWLEDGESTORE: MARKETSANDMARKETS’ SUBSCRIPTION PORTAL
18.3
CUSTOMIZATION OPTIONS
18.4
RELATED REPORTS
18.5
AUTHOR DETAILS
Methodology
The study employed two primary approaches to estimate the current size of the environmental DNA market. Exhaustive secondary research was conducted to gather information on the market, peer markets, and parent markets. The next step was to validate these findings, assumptions, and sizing with industry experts across the value chain through primary research. Both top-down and bottom-up approaches were employed to estimate the complete market size. After that, market breakdown and data triangulation were used to estimate the market size of segments and subsegments.
Secondary Research
This research study involved the extensive use of secondary sources—directories and databases such as Web of Science, Scopus, PubMed, GenBank, EMBL-EBI, and GBIF—to identify and collect information useful for a technical, market-oriented, and commercial study of the market. In the secondary research process, various sources such as annual reports, press releases & investor presentations of companies, white papers, food journals, certified publications, articles from recognized authors, directories, and databases were referred to to identify and collect information. Secondary research was mainly used to obtain key information about the industry’s supply chain, the total pool of key players, and market classification and segmentation as per the industry trends to the bottom-most level, regional markets, and key developments from both market- and technology-oriented perspectives.
Primary Research
Extensive primary research was conducted after obtaining information regarding the environmental DNA market scenario through secondary research. Several primary interviews were conducted with market experts from both the demand and supply sides across major countries of North America, Europe, Asia Pacific, South America, and RoW. Primary data was collected through questionnaires, emails, and telephonic interviews. The primary sources from the supply side included various industry experts, such as CXOs, VPs, directors from business development, marketing, research, and development teams, and key opinion leaders. Primary interviews were conducted to gather insights such as market statistics, data on revenue collected from the products and services, market breakdowns, market size estimations, market forecasting, and data triangulation. Primary research also helped in understanding the various trends related to eDNA sample type, type of solution, detection methods, and application. Stakeholders from the demand side, such as research institutions and universities, and third-party vendors, were interviewed to understand the users’ perspective on the service, and their current usage of eDNA and the outlook of their business, which will affect the overall market.
Breakdown of Primary Interviews

Note: The tiers of the companies are defined based on their total revenues in 2024 or 2025, as per the availability of financial data: Tier 1: Revenue >USD 1 billion; Tier 2: USD 100 million ≤ Revenue ≤ USD 1 billion; Tier 3: Revenue <USD 100 million.
To know about the assumptions considered for the study, download the pdf brochure
|
COMPANY |
DESIGNATION |
|
Thermo Fisher |
R&D Expert |
|
EnviroDNA |
Sales Manager |
|
Illumina, Inc. |
Manager |
|
NatureMetrics |
Sales Manager |
|
Eurofins Scientific |
Marketing Manager |
Market Size Estimation
Both the top-down and bottom-up approaches were used to estimate and validate the total size of the environmental DNA market. These approaches were also used extensively to determine the size of various subsegments in the market. The research methodology used to estimate the market size includes the following details:
- The key players in the industry and the overall markets were identified through extensive secondary research.
- All shares, splits, and breakdowns were determined using secondary sources and verified through primary sources.
- All possible parameters that affect the market covered in this research study were accounted for, viewed in extensive detail, verified through primary research, and analyzed to obtain final quantitative and qualitative data.
- The research included the study of reports, reviews, and newsletters of top market players, along with extensive interviews for opinions from leaders, such as CEOs, directors, and marketing executive.
Environmental DNA Market : Top-Down and Bottom-Up Approach

Data Triangulation
After arriving at the overall market size from the estimation process explained above, the total market was split into several segments and subsegments. The data triangulation and market breakdown procedures were employed, wherever applicable, to estimate the overall environmental DNA market and arrive at the exact statistics for all segments and subsegments. The data was triangulated by studying various factors and trends from the demand and supply sides. The market size was also validated using both the top-down and bottom-up approaches.
Market Definition
The environmental DNA market comprises products and services used to collect, analyze, and interpret genetic material obtained from environmental samples such as water, soil, sediment, and air.
According to the European Commission Joint Research Center, environmental DNA refers to genetic material extracted directly from environmental samples without the need to capture or observe organisms, enabling the detection and monitoring of species and ecosystems.
Similarly, the International Organization for Standardization recognizes environmental DNA-based methods as molecular approaches for biodiversity assessment and environmental monitoring, supporting standardized and reproducible detection of species from environmental samples.
Key Stakeholders
- Sample collection kit and consumables providers
- Molecular reagent and assay developers
- Sequencing technology providers (NGS platforms, PCR systems)
- Bioinformatics and data analysis solution providers
- Environmental testing laboratories and service providers
- Academic institutions and research organizations
- Aquaculture, fisheries, and environmental consulting firms
- Water utilities and environmental monitoring agencies
- Conservation organizations and biodiversity monitoring groups
- Government and regulatory authorities
- Associations, regulatory bodies, and other industry-related bodies
- Convention on Biological Diversity
- International Organization for Standardization
- European Commission (including Joint Research Center)
- United States Environmental Protection Agency
- National Oceanic and Atmospheric Administration
- Food and Agriculture Organization
- United Nations Environment Programme
- Research institutes and universities
- Industry and trade associations
Report Objectives
- To determine, define, and project the size of the environmental DNA market, with respect to sample type, detection method, type of solution application, and regional markets, over five years, ranging from 2026 to 2031
- To identify the attractive opportunities in the market by determining the largest and fastest-growing segments across regions
- To provide detailed information about the key factors influencing the growth of the market (drivers, restraints, opportunities, and challenges)
- To analyze the micro markets with respect to individual growth trends, prospects, and their contribution to the total market
- To strategically profile key market players and comprehensively analyze their core competencies in each segment
- To track and analyze competitive developments, such as alliances, joint ventures, new product developments, mergers, and acquisitions, in the environmental DNA market
Available customizations:
With the given market data, MarketsandMarkets offers customizations according to company-specific scientific needs.
The following customization options are available for the report:
Product Analysis
- Products Matrix, which gives a detailed comparison of the service portfolio of each company.
Regional Analysis
-
With the given market data, MarketsandMarkets offers customizations according to company-specific scientific needs.
- Further breakdown of the Rest of Europe environmental DNA market into key countries.
- Further breakdown of the Rest of Asia Pacific environmental DNA market into key countries.
- Further breakdown of the Rest of South America environmental DNA market into key countries.
Company Information
- Detailed analyses and profiling of additional market players (up to five)
⚡ Growth Signals
Personalize This Research
- Triangulate with your Own Data
- Get Data as per your Format and Definition
- Gain a Deeper Dive on a Specific Application, Geography, Customer or Competitor
- Any level of Personalization
Let Us Help You
- What are the Known and Unknown Adjacencies Impacting the Environmental DNA Market
- What will your New Revenue Sources be?
- Who will be your Top Customer; what will make them switch?
- Defend your Market Share or Win Competitors
- Get a Scorecard for Target Partners


Business Innovation Director
US Based Leading Agribusiness,
Food and Ingredients Manufacturer
I highly appreciate the team's efficiency for a well-conducted study that helped us clarify some blind spots in the area of proteins. Although compiling information for B2B ingredients is very difficult, the MnM team pulled out the task successfully. The quality of research, level of insights, and the responsiveness of the team were commendable!
What the Environmental DNA Report Didn't Show You?
Explore the strategic intelligence behind the Environmental DNA Market
- 🏆 Competitors
- 🎯 Opportunities
- 📈 Growth Signals
Generate 15+ consulting-grade insights instantly
Powered by 17 years of MarketsandMarkets intelligence
